HAL Id: inserm-00663535
https://www.hal.inserm.fr/inserm-00663535
Submitted on 27 Jan 2012
HAL is a multi-disciplinary open access
archive for the deposit and dissemination of
sci-entific research documents, whether they are
pub-lished or not. The documents may come from
teaching and research institutions in France or
abroad, or from public or private research centers.
L’archive ouverte pluridisciplinaire HAL, est
destinée au dépôt et à la diffusion de documents
scientifiques de niveau recherche, publiés ou non,
émanant des établissements d’enseignement et de
recherche français ou étrangers, des laboratoires
publics ou privés.
SAMPLEX: automatic mapping of perturbed and
unperturbed regions of proteins and complexes.
Mickaël Krzeminski, Karine Loth, Rolf Boelens, Alexandre Bonvin
To cite this version:
Mickaël Krzeminski, Karine Loth, Rolf Boelens, Alexandre Bonvin. SAMPLEX: automatic mapping
of perturbed and unperturbed regions of proteins and complexes.. BMC Bioinformatics, BioMed
Central, 2010, 11 (1), pp.51. �10.1186/1471-2105-11-51�. �inserm-00663535�
S O F T W A R E
Open Access
SAMPLEX: Automatic mapping of perturbed and
unperturbed regions of proteins and complexes
Mickaël Krzeminski
1, Karine Loth
1,2, Rolf Boelens
1, Alexandre MJJ Bonvin
1*Abstract
Background: The activity of proteins within the cell is characterized by their motions, flexibility, interactions or even the particularly intriguing case of partially unfolded states. In the last two cases, a part of the protein is affected either by binding or unfolding and the detection of the respective perturbed and unperturbed region(s) is a fundamental part of the structural characterization of these states. This can be achieved by comparing
experimental data of the same protein in two different states (bound/unbound, folded/unfolded). For instance, measurements of chemical shift perturbations (CSPs) from NMR1H-15N HSQC experiments gives an excellent opportunity to discriminate both moieties.
Results: We describe an innovative, automatic and unbiased method to distinguish perturbed and unperturbed regions in a protein existing in two distinct states (folded/partially unfolded, bound/unbound). The SAMPLEX program takes as input a set of data and the corresponding three-dimensional structure and returns the confidence for each residue to be in a perturbed or unperturbed state. Its performance is demonstrated for different applications including the prediction of disordered regions in partially unfolded proteins and of interacting regions in protein complexes.
Conclusions: The proposed approach is suitable for partially unfolded states of proteins, local perturbations due to small ligands and protein-protein interfaces. The method is not restricted to NMR data, but is generic and can be applied to a wide variety of information.
Background
During the last decennia, there has been a growing interest in biological system dynamics, which consist for instance of interactions between proteins and folding pathways. This also includes proteins that partially unfold under specific environmental stimuli (taxis), and act as intermediates in a cascade of events [1]. In all cases, only a part of the protein is involved in the biolo-gical process while the remaining part stays dormant. Indeed, in a protein-protein complex, only the interac-tion surface is often affected, even though, sometimes, a larger part of the protein is modified, like in the case of allosteric interactions or conformational changes upon binding. As for partially unfolded proteins, which are typically composed of mobile regions linked to a folded core, they show some flexibility due to the internal motions of the protein and the reorganization of the
unfolded part upon partial unfolding. In order to struc-turally characterize such systems, it is crucial to distin-guish the unperturbed regions from the perturbed ones.
Nuclear Magnetic Resonance (NMR) is particularly convenient for monitoring, at atomic level, structural and/or environmental changes, which occur upon bind-ing to a partner molecule or at (partial) unfoldbind-ing. In particular, heteronuclear shift correlation experiments, such as 1H-15N HSQC, are very useful to detect altera-tions in the electronic environment of atoms which affect their chemical shifts. Hence, comparison of HSQC spectra of a molecule in two different states (bound/ unbound, folded/unfolded) allows the detection of affected residues by analyzing the chemical shift pertur-bations (CSPs) [2-4].
A common method to distinguish unperturbed resi-dues from others is to reject the ones for which the CSP is higher than a pre-defined threshold that usually corre-sponds to the average of all CSPs plus one or two times their standard deviation. This procedure is repeated
* Correspondence: a.m.j.j.bonvin@uu.nl
1Bijvoet Center for Biomolecular Research, Science Faculty, Utrecht University,
3584 CH, Utrecht, The Netherlands
© 2010 Krzeminski et al; licensee BioMed Central Ltd. This is an Open Access article distributed under the terms of the Creative Commons Attribution License (http://creativecommons.org/licenses/by/2.0), which permits unrestricted use, distribution, and reproduction in any medium, provided the original work is properly cited.
with the remaining residues, until no rejection occurs anymore. The choice of a cut-off can be biased by sub-jectivity in the selection process. In addition, there is no simple relationship between the amount of chemical shift perturbations and the magnitude of the perturba-tion; this sometimes results in biased data (like very low CSP for a residue that is flanked by two others with very high CSPs), leading to misinterpretations. With that respect, it might be more relevant to consider not only the CSP of the concerned residue or its sequential neighbors, but also the CSPs of the residues close to it in the 3D structure.
This problem has previously been addressed by Kalbit-zer et al. [5] for the case of protein-protein interactions. Their method yields the probability for a given residue to be involved in the interaction by comparing its CSP and the average CSP of the same residue found in all complexes of the BMRB database [6]. This approach however depends on the way the CSP is calculated [5] and an user-defined cut-off. In the present study we present an automated and less biased procedure to dis-criminate perturbed regions from unperturbed ones in a protein using its three dimensional structure and a set of experimental data. We will use in this work CSP data, but the method is generic and can be used for other types of data as well. The program we developed for this purpose, SAMPLEX (Smoothed Automatic Map-ping of Protein from Listed Extremes), is based on a topologic approach and can overcome problems due to peak overlap or to sparse data. We tested our method on several systems, including protein complexes and partially unfolded proteins, for which NMR data were available.
Implementation
Considering a system existing in two different states, the CSP of the atoms of a given residue can be calculated from the HSQC spectra of the protein obtained for each state as follows [2]:
CSP (HN) (N SWN) (C SWC ) (CO SWCO)
2 2 2 2
(1)
whereΔHN,ΔN, ΔCaandΔCO are the chemical shift
differences of the hydrogen (HN), the amide nitrogen
(N), the alpha carbon (Ca) and the carbon of the car-boxyl group (CO) of the backbone, respectively, and
SWN, SWCa and SWCO are the spectral width ratio
between HNand N, HNand Caand HN and CO,
respec-tively [3].
From these CSPs determined for each residue (ideally) and the known native structure of the protein of inter-est, SAMPLEX automatically delimits the perturbed regions of the protein. The method has been divided into four consecutive steps that aim at defining groups
of residues that belong to a similar state (perturbed/ unperturbed) within the protein.
Step 1. Attribution of confidences
In an ensemble of CSPs values, a way to reflect how sig-nificantly different is a CSP value compared to all others is to calculate the factor k defined as:
ki CSPi
(2)
where CSPiis the CSP of the residue i, μ the average
of all CSPs ands the standard deviation. The factor k can be positive or negative. We subsequently transform these factors into values ri such that the highest CSP
value(s) becomes 1, the lowest -1 and all others have intermediate values. From now on, we will call ri the
confidence of the residue i. However, to avoid that the highest and lowest CSP values, which can be extreme, dominate this transformation, we first determine mini-mum factors khigh and klow. For this, we run several
times (roughly 1000 times the number of available data) the following process:
• Selection of a sub-ensemble made of the highest, the lowest and randomly selected CSP values such that the size of this sub-ensemble corresponds to 15% of the number of available data.
• Calculation of the factor k for this sub-ensemble using the equation 1.
We then define khighand klowas the lowest and
high-est k values found among all runs performed.
Then, to determine the confidenceri of each residue
i, we perform the following steps: 1. Initialization of the variableaι= 0.
2. Selection of a sub-ensemble made of the CSP value of residue i and randomly selected CSP values such that the size of this sub-ensemble corresponds to 15% of the number of available data.
3. Calculation of the factor ki for this given
ensemble.
4. IncrementaibyΓ(ki) defined as:
( )k ( k k k ) (k k ) if if if Otherwi i
i high low high low
1 2 1 0 sse k k k k k k k i high low i high i low (3)
The value of 0 accounts for a null standard devia-tion, which is not informative.
5. Steps 2 to 4 are repeated n_trial = 100 times the number of available data.
Krzeminskiet al. BMC Bioinformatics 2010, 11:51 http://www.biomedcentral.com/1471-2105/11/51
6. The confidence ri of residue i is finally given by
the quotient ofaiover n_trial.
Step 2. Inference of missing residues
In some cases, no data are available for a given residue (e.g. in the case of CSPs, due to missing assignments, line broadening, prolines...) To overcome such lack of information, we can still infer a confidence by the mean of multivariate interpolation, using an inverse distance weighting approach: a delusive confidenceriis assigned
based on the residue direct environment using a bary-centric method which depends on the distances to its neighbors as follows: i j ij j n ij j n 1 1 (4)
where i is the residue to infer, j a neighbor of i within a cut-off distance of 7.5 Å, n the total number of neigh-bors and ij a sigmoidal function. This latter depends
on the distance between the non-weighted barycentres of atoms of residues i to residue j for which we have some data; it is defined so that its value is very close to 1 when the distance is null and very close to 0 when the distance is equal to the predefined cut-off of 7.5 Å:
ij e c dij e c dij ( ) ( ) (5)
where dij is the distance between residues i and j, c
the predefined cut-off,ε is a very small number set to 10-3in this work, aε a constant equal toε/(1-ε) and l(c) a function defined as follows:
( )c ln c 1 1 (6) At least two neighboring residues with available experimental data should be detected otherwise the resi-due is excluded from further calculations and no deci-sion about its state is made in the end. When an ensemble of structures is provided, neighbors are defined by considering the average distance over all models. This allows taking into account possible confor-mational heterogeneity into the procedure.
Step 3. Homogenization of confidences
The confidenceriof each residue is then adjusted based
on its neighborhood in the 3D structure of the protein. We apply an iterative process until the root mean square deviation between two consecutive steps is
becoming lower than a threshold value of 10-5. This results in the creation of blocks of residues for which the homogenized confidences are close to each other. Each step of this process consists of attributing a new confidence iN to residue i as follows:
iN iS j ij k n ij k n 1 1 1 (7)
In this formula, iN is the newly attributed
confi-dence of residue i, iS the starting confidence, n the
number of neighbors of residue i, and ijthe sigmoidal
function defined in Eq. 5.
Step 4. Final decision
From the homogenized confidences, we define all resi-dues with a confidence higher than 0.05 as being in a perturbed state and all residues with a confidence lower than -0.05 as remaining in their unperturbed state. The residues in between those two values are considered to be in an ambiguous state, which can mean that they might be close to a perturbed region or indirectly affected by a perturbed region.
Results and Discussion
The selection approach described above was tested on five distinct systems with different characteristics. The various test cases are representative of both binding -and partial unfolding - induced CSP data. In the case of protein-protein complexes, the situation is delicate in the sense that the measure of the accuracy of the selec-tion depends on the way we define the interface and on the quality of the structures. In this work, we defined the residues at the interface as the ones having at least one atom of the backbone within 5 Å of any atom of the other subunit, excluding hydrogen atoms. In the case of an ensemble of conformations, we consider that a contact is effective if it is found in at least one model. Graphical results are given for each test case [Additional file 1].
Performance of diverse test cases
Chymotrypsin inhibitor 2 (CI2) subunit in complex with the Subtilisin BPN’
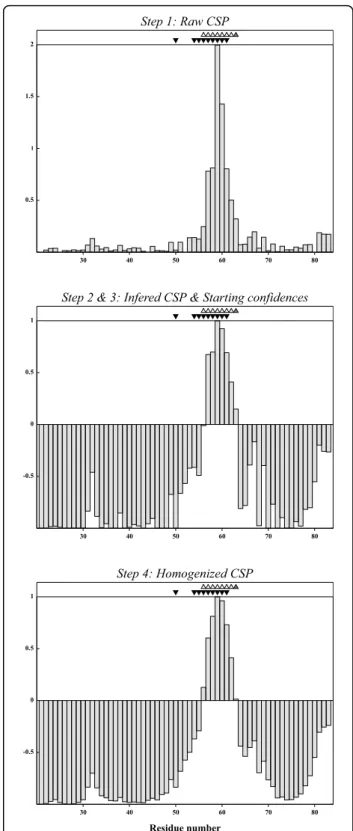
Subtilisin BPN’ is a serine protease [7] which can be inhibited by the chymotrypsin inhibitor 2, an 83 amino acid protein with a disordered N-terminal tail [8]. Figure 1 shows the evolution of the residue selection for the CI2 subunit of the Subtilisin/CI2 complex as a function of the raw CSP data (C. van Heijnoort and L. Koharu-din, personal communication), starting confidences and the resulting homogenized confidences. In this case we
took for the selection process the structures from the complex (PDB entry 1LW6) [8].
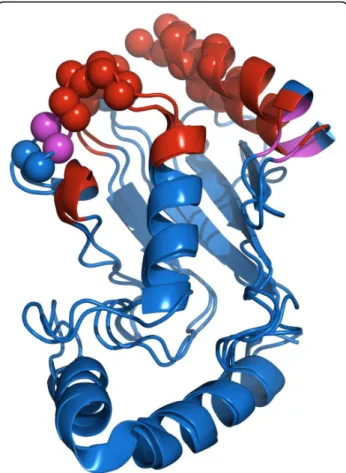
For CI2, SAMPLEX estimates that residues 56-62 are perturbed and residue 63 is in an ambiguous state. The CI2/BPN’ X-ray complex, solved at 1.50 Å (PDB entry 1LW6) [8], shows that residues 50 and 54 to 61 are involved in the interaction (Figure 2). Residue 50 how-ever is only defined as interacting based on the proxi-mity of its carbonyl oxygen to a side chain oxygen of D99 in BPN’ (distance between both oxygens is 4.8 Å). This can explain why its amide group is not affected by the binding and therefore not selected by SAMPLEX.
For BPN’, the situation is more complicated because of the size of the protein (281 residues) and the lack of data (16% of confidences had to be inferred). Residues 33, 97, 99-109, 126-128, 141, 154-156, 167-171 and 218-219 are predicted by SAMPLEX as being in a non-native-like environment, and residues 65, 98 and 220 as being in an ambiguous state. The interface measured from the X-ray complex includes residues 99-104, 125-128, 154-157, 167, 218-221. Besides residue 141, all resi-dues selected by SAMPLEX are either in or close to the interface (see figure 2) and consequently could be per-turbed due to the interaction with CI2. Residue 141, which is not close to the interface, shows the second highest experimental CSP; this could be due to an indir-ect perturbation (e.g. conformational change).
The Ubiquitin-conjugating enzyme E2-7 (UBCH5) in complex with CCR4-NOT (CNOT4)
UBCH5 is a human protein involved in the ubiquitina-tion of proteins [9]. It interacts with CNOT4, a tran-scription factor [10]. From the unbound form of the protein (PDB entry: 2ESO) [11], our algorithm estimates that residues 1-12, 16-17, 60-64, 88 and 94-101 of UBCH5 are perturbed. No Residue is classified in an ambiguous state. The contacts defined from the struc-tural model obtained with HADDOCK [12,13] (PDB entry: 1UR6) 8-59, 61-63, 88 and 91 to 96 are involved in the interaction. Although this structural model was obtained based on chemical shift information, we are confident that it presents an accurate picture of the complex due to its high homology to the UbcH7-c-Cbl complex solved by X-ray crystallography (PDB entry 1FBV) [14].
SAMPLEX finds the correct regions, but extends the one of the N-terminal helix (residues 1-13, 16-17). When we align the structures of the unbound and bound forms of UBCH5, ignoring this first helix (Figure 3), we clearly see that the position of this helix has shifted. In the same way, we also notice a shift of resi-dues 87 and 88. The region delimited by the resiresi-dues 93 to 101 corresponds to a loop that is in contact with CNOT4. Hence, these regions might be perturbed accounting for the selection made by SAMPLEX.
30 40 50 60 70 80 -0.5 0 0.5 1 30 40 50 60 70 80 -0.5 0 0.5 1 Residue number 30 40 50 60 70 80 0.5 1 1.5 2
Step 2 & 3: Infered CSP & Starting confidences Step 1: Raw CSP
Step 4: Homogenized CSP
Figure 1 Chemical shift perturbations and derived confidences as function of the residue sequence for CI2 (unbound and bound to BPN’). Top: Raw CSP data; Middle: Starting confidences; Bottom: Confidences after homogenization. The triangles filled in black show residues involved in the interaction between CI-2 and BPN’, the ones filled in grey show the selection made by SAMPLEX and the open ones, residues in an intermediate state.
Krzeminskiet al. BMC Bioinformatics 2010, 11:51 http://www.biomedcentral.com/1471-2105/11/51
On the CNOT4 side, the predictions turn out to be rather accurate. The algorithm predicts residues 15 to 19, 41, 45, 47 to 50 and 53 to 57 as perturbed and resi-dues 14, 40, 46 and 52 in an intermediate state. The interface from the structural model comprises residues 15 to 20, 40 to 41, 44 to 45, 48 to 50, 52 to 55 and 57.
Colicin E9 domain (CE9) subunit in complex with its cognate immunity protein (IM9)
CE9 is a small bacterial protein with cytotoxic endonu-clease activity. The structures of its unbound and bound forms have been solved by X-ray at 1.80 Å and 1.70 Å, respectively (PDB entries 1FSJ and 1EMW, respectively) [15]. In addition, NMR chemical shifts have been mea-sured for both the unbound and bound forms (BMRB accession numbers 4352 and 4293, respectively) [16,17]. As for its partner, Im9, both bound (1EMW) and unbound forms are also available. The latter has been solved by NMR (PDB code 1IMP) [18]. Chemical shifts are available for both forms (BMRB accession numbers 4115 and 4116) [19].
For E9, the perturbed region estimated by SAMPLEX encloses residues 23, 72-79, 86-87 and 94-99. Residues 70, 80, 85 and 93 are in an ambiguous state. From the crystal structure, residues 72-75, 77-, 81, 83, 86, 89 and 97 are at the interface. In the case of Im9, SAMPLEX defines residues 24, 30-37, 47-57 and 82 as perturbed
and residue 38 as ambiguous. The crystal structure indi-cates that residues 23-25, 30, 33-34, 50-51, 54-55 and 62 are involved in the interaction. SAMPLEX predicted a somewhat larger region in both proteins that correctly encompass the true interface. The additional predictions are mainly located in loops that can undergo conforma-tional changes upon binding. Indeed, chemical shift per-turbations alone cannot distinguish between direct interactions and induced conformational changes.
The lactose operon repressor and its inducer
The Lac repressor is a tetrameric protein that binds a specific operator on DNA and therefore inactivates the transcription of the enzymes involved in the metabolism of the lactose [20,21]. When a molecule of isopropyl- b-D-thiogalactoside (IPTG) is embedded in the repressor, this later is inhibited due to a structural rearrangement.
In this case, SAMPLEX predicts residues 66-82, 97, 124, 126-128, 133, 160-163, 192-197, 222, 276-280, 292-293, 319-320 and 322 as perturbed. In addition, residues 83, 95-96, 98-99, 125, 132, 221, 294 and 318 are
Figure 3 Alignment of the free and the bound form of UBCH5. In red are depicted perturbed residues as predicted by SAMPLEX, in purple are residues in an intermediate state. The real interface defined from 1UR6 is displayed with spheres. We clearly see the shift of the first helix and of residues 87-88 (black arrow) upon the formation of the complex.
Figure 2 Selection of perturbed regions of CI2 after complexation with BPN’. In red and purple are displayed residues selected by SAMPLEX in a non-native like environment and in an ambiguous state, respectively. Spheres represent the interface based on the criterion defined in this paper: a residue belongs to the interface if at least one atom of the backbone is at a maximum distance of 5Å of any atom of the other subunit, excluding hydrogen atoms.
classified as ambiguous state. The prediction corre-sponds to the binding pocket of IPTG and the beta sheet involved in the interaction between two mono-mers, which has previously been demonstrated as being perturbed [22].
The Photoactive Yellow Protein (PYP)
PYP is a 14 kDa protein found in the bacterium Halor-hodospira halophila. Upon illumination at 446 nm, this protein partially unfolds and triggers the signal, which results in the movement by the bacterium away from the light [23-25]. The protein contains a PAS domain as found in many signaling proteins [26]. The chromo-phore is a p-coumaric acid, which undergoes a trans-to-cis isomerization after activation of the ground state. This isomerization results in the partial unfolding of the protein. A truncated form of PYP,Δ25-PYP, with the 25 first N-terminal amino acids deleted, shows a longer lifetime in the excited state (about 10 minutes), which allowed to record 1H-15N HSQC spectra and compare the ground and excited states [27].
Using as input the NMR structure ofΔ25-PYP (PDB entry 1XFN) [27] the program defines the regions that comprise residues 29, 42-52, 54-58, 63-65, 67-74, 76-77 and 97 to 102 as perturbed, i.e., in this case, as partially unfolded. Residues 53, 66, 78-79 and 103 are in an ambiguous state. These regions contain the loop, which bears the chromophore (residue 69), residue E46, which is part of helix 3 and yields a proton to the chromophore before unfolding of the protein, and the loop flanked by beta sheets 4 and 5. This loop can be seen as the lead that covers the chromophore. Finally, a part of the helix 5 is perturbed, while all beta sheets stay in their native like environment. In conclusion, only the part surround-ing the chromophore is predicted as affected.
Since the structure of the partially unfolded state of Δ25-PYP has been solved by NMR, we investigated the dependence of the predictions on the structure used: when running SAMPLEX from the unfolded structure (PDB code 1XFQ) [27] residues 28-29, 43-58, 63-65, 67-68, 70-74, 77-78, 97-102 are predicted as perturbed and residues 42, 66, 69, 76, 79, 103 as ambiguous. These results are quite similar (97% overlap considering per-turbed and ambiguous regions together) to the ones obtained using the folded protein indicating that our method is robust with respect to the structure used.
An unperturbed protein
SAMPLEX can also assess whether data are indicative of a perturbation or not, by making use of the relative standard deviationsRdefined assR=s/μ, where μ and
s are the mean and the standard deviation of all avail-able data, respectively. Below a value of 25%, the pro-gram will consider that no part of the protein has been affected and will ask the user whether he wishes to con-tinue. We tested this by analyzing HSQC spectra of the
Lac Headpiece repressor in complex with DNA at two different frequencies (500 MHz and 900 MHz) and cal-culating CSP values from their difference. The resulting sRwas 5.9% and consequently SAMPLEX did not make
any prediction. In the case of the other examples dis-cussed in this paper, sR increased to 200.7%, 286.4%,
141.6%, 115.5%, 153.0%, 200.8%, 117.6% and 88.9% for CI2, BPN’, UBCH5, CNOT4, CE9, Im9, the lactose operon repressor and PYP, respectively.
Comparison with general methods
Common methods that are often used to define per-turbed regions within a protein from CSPs are:
i. to consider as perturbed all residues with a CSP value higher than the average of all available data plus one or two times their standard deviation ii. to iterate a process in which residues with a CSP value higher than the average plus one or two times their standard deviation are rejected and start again with the remaining residues until no rejection occurs; all rejected are finally classified as perturbed. We compared the performance of SAMPLEX with these two methods in the case of the complexes described above. The accuracy of the selection was mea-sured by the Matthews coefficient correlation as described by Baldi et al. [28]:
MCC TN TP FN FP
TP FN TP FP TN FP TN FN
( )( )( )( ) (8) where TP, FP, TN and FN are the true positive (cor-rectly predicted), false positive (wrongly predicted), true negative (correctly not predicted) and false negative (wrongly not predicted) residues, respectively. This coef-ficient reaches 1 when the prediction is perfect.
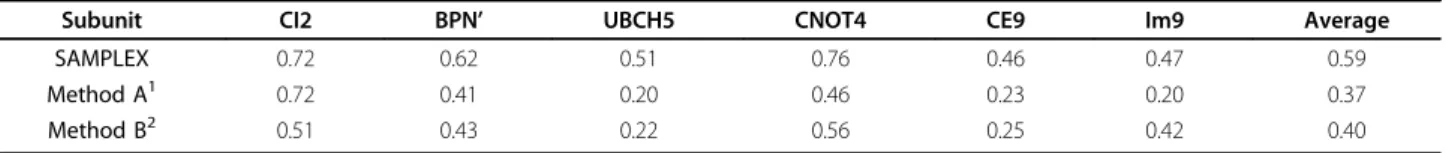
Table 1 summarizes the quality of the prediction for CI2, BPN’ and UBCH5 using the various selection meth-ods. We clearly see that SAMPLEX always outperforms the other two methods.
Conclusion
In this paper we have described a new un-biased strat-egy to distinguish perturbed from unperturbed regions in NMR spectra that define two different states of a pro-tein. The program developed for this purpose, SAM-PLEX, requires on the one hand the chemical shifts (or some other kind of data distinguishing the various states) of the protein in both the ground/free and the excited/bound state and on the other hand the structure (or an ensemble of structures) of the ground/free form as input. The method can be used to find the partially unfolded moiety of a protein, or in the case of proteins complexes, to define the interaction surface.
Krzeminskiet al. BMC Bioinformatics 2010, 11:51 http://www.biomedcentral.com/1471-2105/11/51
In this work, we only used CSP data from 1H-15N HSQC spectra and showed that they are already suffi-cient for a successful selection. However, since the result will depend on the quality and the amount of data, SAMPLEX would yield more accurate solution by including additional chemical shifts (13Ca, 13CO...), in
particular in the case of large proteins. It is worth not-ing again that, in the case of complexes, chemical shifts can report on both direct interaction and indirect effects such as remote conformational changes; results should thus always be carefully analyzed.
It should be noted that our selection method is gen-eric and therefore not restricted to NMR CSP data. It can also be applied to e.g. order parameters from NMR relaxation data, protection factors calculated from H/D exchange experiments or any other experimental data as long as it provides information on a molecule at an atomic level. This makes it applicable to a large variety of problems in which some selection/classification needs to be performed.
Software availability
SAMPLEX is written in python and is available free of charge. It can be downloaded from: http://www.nmr. chem.uu.nl/Software/samplex.
Additional file 1: Figures presenting the chemical shift
perturbations and derived confidences as function of the residue sequence for all test cases discussed in the text. Each column corresponds to one test case. Top: Raw CSP data; Middle: Starting confidences; Bottom: Confidences after homogenization. The horizontal red lines displayed on the graphic after homogenization delimit the perturbed (above the upper line), the unperturbed (bellow the lower line) and the intermediate (between the two lines) regions, as determined by SAMPLEX.
Click here for file
[ http://www.biomedcentral.com/content/supplementary/1471-2105-11-51-S1.PDF ]
Acknowledgements
We acknowledge financial support from the Netherlands Organization for Scientific Research (NWO) ("van Molecuul tot Cell” grant n° 805.47.121 and VICI grant n° 700.56.442 to A.M.J.J.B.) and from the European Community (FP6 STREP“UPMAN”, contract n° LSHG-CT-2005-512052).
Author details
1
Bijvoet Center for Biomolecular Research, Science Faculty, Utrecht University, 3584 CH, Utrecht, The Netherlands.2Centre de biophysique moléculaire, UPR
n°4301 CNRS, affiliated to the University of Orléans and to Inserm, rue Charles Sadron, 45071 Orléans Cedex 2, France.
Authors’ contributions
MK and AMJJB developed the original idea and algorithm of SAMPLEX, programmed the method and prepared the first draft of the manuscript. AMJJB supervised and coordinated the entire project. KL and RB brought precious help to adjust some aspects of the original method due to the subtleties of interpretation of NMR data. All authors read and approved the final manuscript.
Received: 19 August 2009
Accepted: 26 January 2010 Published: 26 January 2010 References
1. Horst van der MA, Hellingwerf KJ: Photoreceptor proteins,“star actors of modern times": a review of the functional dynamics in the structure of representative members of six different photoreceptor families. Acc Chem Res 2004, 37(1):13-20.
2. Farmer BT, Constantine KL, Goldfarb V, Friedrichs MS, Wittekind M, Yanchunas J Jr, Robertson JG, Mueller L: Localizing the NADP+ binding site on the MurB enzyme by NMR. Nat Struct Biol 1996, 3(12):995-997. 3. Mulder FA, Schipper D, Bott R, Boelens R: Altered flexibility in the
substrate-binding site of related native and engineered high-alkaline Bacillus subtilisins. J Mol Biol 1999, 292(1):111-123.
4. Zuiderweg ER: Mapping protein-protein interactions in solution by NMR spectroscopy. Biochemistry 2002, 41(1):1-7.
5. Schumann FH, Riepl H, Maurer T, Gronwald W, Neidig KP, Kalbitzer HR: Combined chemical shift changes and amino acid specific chemical shift mapping of protein-protein interactions. J Biomol NMR 2007,
39(4):275-289.
6. Ulrich EL, Akutsu H, Doreleijers JF, Harano Y, Ioannidis YE, Lin J, Livny M, Mading S, Maziuk D, Miller Z, et al: BioMagResBank. Nucleic Acids Res 2008, , 36 Database: D402-408.
7. Bott R, Ultsch M, Kossiakoff A, Graycar T, Katz B, Power S: The three-dimensional structure of Bacillus amyloliquefaciens subtilisin at 1.8 A and an analysis of the structural consequences of peroxide inactivation. J Biol Chem 1988, 263(16):7895-7906.
8. Radisky ES, Koshland DE Jr: A clogged gutter mechanism for protease inhibitors. Proc Natl Acad Sci USA 2002, 99(16):10316-10321. 9. Scheffner M, Huibregtse JM, Howley PM: Identification of a human
ubiquitin-conjugating enzyme that mediates the E6-AP-dependent ubiquitination of p53. Proc Natl Acad Sci USA 1994, 91(19):8797-8801. 10. Albert TK, Lemaire M, van Berkum NL, Gentz R, Collart MA, Timmers HT:
Isolation and characterization of human orthologs of yeast CCR4-NOT complex subunits. Nucleic Acids Res 2000, 28(3):809-817.
11. Ozkan E, Yu H, Deisenhofer J: Mechanistic insight into the allosteric activation of a ubiquitin-conjugating enzyme by RING-type ubiquitin ligases. Proc Natl Acad Sci USA 2005, 102(52):18890-18895.
12. de Vries SJ, van Dijk AD, Krzeminski M, van Dijk M, Thureau A, Hsu V, Wassenaar T, Bonvin AM: HADDOCK versus HADDOCK: new features and performance of HADDOCK2.0 on the CAPRI targets. Proteins 2007, 69(4):726-733.
Table 1 Performance of SAMPLEX
Subunit CI2 BPN’ UBCH5 CNOT4 CE9 Im9 Average
SAMPLEX 0.72 0.62 0.51 0.76 0.46 0.47 0.59
Method A1 0.72 0.41 0.20 0.46 0.23 0.20 0.37
Method B2 0.51 0.43 0.22 0.56 0.25 0.42 0.40
Comparison of the quality of the predictions for the interfaces of CI2, BPN’, UBCH5, CNOT4, CE9 and IM9 using SAMPLEX and two commonly used methods as measured by the Matthews coefficient correlation (Eq. 8)
(1) Residues that have a CSP value higher than the average of all available CSP values plus one time their standard deviation are considered as perturbed (2) Considering an iterative process, which consists on rejecting all residues with a CSP value higher than the average of all CSP values plus two times the standard deviation and starting again with remaining residues until no rejection occurs, all rejected residues are considered as perturbed.
13. Dominguez C, Boelens R, Bonvin AM: HADDOCK: a protein-protein docking approach based on biochemical or biophysical information. J Am Chem Soc 2003, 125(7):1731-1737.
14. Zheng N, Wang P, Jeffrey PD, Pavletich NP: Structure of a c-Cbl-UbcH7 complex: RING domain function in ubiquitin-protein ligases. Cell 2000, 102(4):533-539.
15. Kuhlmann UC, Pommer AJ, Moore GR, James R, Kleanthous C: Specificity in protein-protein interactions: the structural basis for dual recognition in endonuclease colicin-immunity protein complexes. J Mol Biol 2000, 301(5):1163-1178.
16. Whittaker SB, Boetzel R, MacDonald C, Lian LY, James R, Kleanthous C, Moore GR: Assignment of 1H, 13C and 15N signals of the DNase domain of colicin E9. J Biomol NMR 1999, 14(2):201-202.
17. Whittaker SB, Czisch M, Wechselberger R, Kaptein R, Hemmings AM, James R, Kleanthous C, Moore GR: Slow conformational dynamics of an endonuclease persist in its complex with its natural protein inhibitor. Protein Sci 2000, 9(4):713-720.
18. Osborne MJ, Breeze AL, Lian LY, Reilly A, James R, Kleanthous C, Moore GR: Three-dimensional solution structure and 13C nuclear magnetic resonance assignments of the colicin E9 immunity protein Im9. Biochemistry 1996, 35(29):9505-9512.
19. Boetzel R, Czisch M, MacDonald CJ, Kaptein R, Hemmings AM, James R, Kleanthous C, Moore GR: Assignment of 1H, 13C and 15N signals of the inhibitor protein Im9 bound to the DNase domain of colicin E9. J Biomol NMR 1998, 12(4):567-568.
20. Daber R, Stayrook S, Rosenberg A, Lewis M: Structural analysis of lac repressor bound to allosteric effectors. J Mol Biol 2007, 370(4):609-619. 21. Lewis M, Chang G, Horton NC, Kercher MA, Pace HC, Schumacher MA,
Brennan RG, Lu P: Crystal structure of the lactose operon repressor and its complexes with DNA and inducer. Science 1996, 271(5253):1247-1254. 22. Bell CE, Lewis M: The Lac repressor: a second generation of structural
and functional studies. Curr Opin Struct Biol 2001, 11(1):19-25. 23. Hellingwerf KJ, Crielaard WC, Joost Teixeira de Mattos M, Hoff WD, Kort R,
Verhamme DT, Avignone-Rossa C: Current topics in signal transduction in bacteria. Antonie Van Leeuwenhoek 1998, 74(4):211-227.
24. Dux P, Rubinstenn G, Vuister GW, Boelens R, Mulder FA, Hard K, Hoff WD, Kroon AR, Crielaard W, Hellingwerf KJ, et al: Solution structure and backbone dynamics of the photoactive yellow protein. Biochemistry 1998, 37(37):12689-12699.
25. Rubinstenn G, Vuister GW, Mulder FA, Dux PE, Boelens R, Hellingwerf KJ, Kaptein R: Structural and dynamic changes of photoactive yellow protein during its photocycle in solution. Nat Struct Biol 1998, 5(7):568-570. 26. Pellequer JL, Wager-Smith KA, Kay SA, Getzoff ED: Photoactive yellow
protein: a structural prototype for the three-dimensional fold of the PAS domain superfamily. Proc Natl Acad Sci USA 1998, 95(11):5884-5890. 27. Bernard C, Houben K, Derix NM, Marks D, Horst van der MA, Hellingwerf KJ,
Boelens R, Kaptein R, van Nuland NA: The solution structure of a transient photoreceptor intermediate: Delta25 photoactive yellow protein. Structure 2005, 13(7):953-962.
28. Baldi P, Brunak S, Chauvin Y, Andersen CA, Nielsen H: Assessing the accuracy of prediction algorithms for classification: an overview. Bioinformatics 2000, 16(5):412-424.
doi:10.1186/1471-2105-11-51
Cite this article as: Krzeminski et al.: SAMPLEX: Automatic mapping of perturbed and unperturbed regions of proteins and complexes. BMC Bioinformatics 2010 11:51.
Publish with BioMed Central and every scientist can read your work free of charge
"BioMed Central will be the most significant development for disseminating the results of biomedical researc h in our lifetime."
Sir Paul Nurse, Cancer Research UK Your research papers will be:
available free of charge to the entire biomedical community peer reviewed and published immediately upon acceptance cited in PubMed and archived on PubMed Central yours — you keep the copyright
Submit your manuscript here:
http://www.biomedcentral.com/info/publishing_adv.asp
BioMedcentral
Krzeminskiet al. BMC Bioinformatics 2010, 11:51 http://www.biomedcentral.com/1471-2105/11/51