Publisher’s version / Version de l'éditeur:
Questions? Contact the NRC Publications Archive team at
PublicationsArchive-ArchivesPublications@nrc-cnrc.gc.ca. If you wish to email the authors directly, please see the first page of the publication for their contact information.
https://publications-cnrc.canada.ca/fra/droits
L’accès à ce site Web et l’utilisation de son contenu sont assujettis aux conditions présentées dans le site LISEZ CES CONDITIONS ATTENTIVEMENT AVANT D’UTILISER CE SITE WEB.
Annual Conference of the Canadian Society for Civil Engineering [Proceedings],
pp. 1-9, 2003-06-04
READ THESE TERMS AND CONDITIONS CAREFULLY BEFORE USING THIS WEBSITE. https://nrc-publications.canada.ca/eng/copyright
NRC Publications Archive Record / Notice des Archives des publications du CNRC : https://nrc-publications.canada.ca/eng/view/object/?id=0eae446e-2933-499a-bd20-54f2faa1f924 https://publications-cnrc.canada.ca/fra/voir/objet/?id=0eae446e-2933-499a-bd20-54f2faa1f924
NRC Publications Archive
Archives des publications du CNRC
This publication could be one of several versions: author’s original, accepted manuscript or the publisher’s version. / La version de cette publication peut être l’une des suivantes : la version prépublication de l’auteur, la version acceptée du manuscrit ou la version de l’éditeur.
Access and use of this website and the material on it are subject to the Terms and Conditions set forth at
A New approach to programming maintenance activities for concrete
bridge decks
A New approach to programming maintenance
activities for concrete bridge decks
Morcous, G.; Lounis, Z.
NRCC-46138
A version of this document is published in / Une version de ce document se trouve dans: Proceedings of Annual Conference of the Canadian Society for Civil Engineering, Article GCP-135,
pp. 1-9
Congrès annuel de la Société canadienne de génie civil
Annual Conference of the Canadian Society for Civil Engineering
Moncton, Nouveau-Brunswick, Canada 4-7 juin 2003 / June 4-7, 2003
A NEW APPROACH TO PROGRAMMING MAINTENANCE ACTIVITIES
FOR CONCRETE BRIDGE DECKS
G. MorcousA and Z. LounisB
A School of Engineering, Acadia University, Wolfville, Nova Scotia, Canada.
B Institute for Research in Construction, National Research Council, Ottawa, Ontario, Canada.
ABSTRACT: This paper presents an approach to programming maintenance alternatives for a network of concrete bridge decks using genetic algorithms and Markovian performance prediction models. Genetic algorithms are robust and stochastic optimization techniques that overcome the mathematical complications and combinatorial explosion problems of the conventional optimization techniques. Markovian models are the state-of-the art stochastic models used in several maintenance management systems to predict the future condition for a network of infrastructure facilities. An illustrative example for finding the optimal maintenance alternatives for concrete bridge decks using field data is presented to demonstrate the feasibility and capability of the proposed approach.
1. INTRODUCTION
The determination of optimal maintenance alternatives for a network of bridges is the primary task of any bridge management system. The objective of this task is to fulfill the reliability and functionality requirements as well as any other intangible criteria for an entire bridge network under budgetary constraints. Since the early 1980’s, many optimization techniques have been adopted for that purpose, such as optimal control theory, linear and non-linear programming, dynamic programming, integer programming, goal-oriented programming, and multiobjective optimization. Although these conventional techniques have provided satisfactory results when applied to programming maintenance alternatives, few transportation agencies have implemented them their management systems. This is mainly due to the fact that the mathematical formulation of a maintenance programming problem using conventional optimization techniques is complicated and time-consuming. Moreover, the computation time of the problem increases exponentially with the number of structures in the network, number of condition states, number of feasible maintenance alternatives for each state, and number of years in the planning horizon, which is impractical, even for modern computers (Fwa et al. 1998).
Therefore, genetic algorithm (GA) optimization techniques have been adopted by many researchers for programming the maintenance of highway bridges and pavements (Liu et al. 1997; Fwa et al. 1996). This is mainly because GA techniques can provide a reasonable level of accuracy while being more efficient than conventional optimization techniques when applied to large size networks. Current GA formulations use deterministic deterioration models for predicting the future condition of a bridge element or pavement segment as a function of its age and some other factors, such as traffic volume and design truck load.
These deterioration models are unable to capture the considerable randomness that is associated with the structural performance due to uncertainties in initial condition, applied stresses, condition assessment, and the inherent uncertainty of the deterioration process (Lounis 2000; Bogdanoff 1978). On the other hand, the state-of-the art maintenance management systems, such as Pontis (for bridges) and MicroPAVER (for pavements), use Markovian performance prediction models to predict the future condition at the network/project level when different maintenance alternatives are implemented.
The objective of this paper is to present a new approach to programming maintenance alternatives using genetic algorithms in conjunction with Markovian performance prediction models. The following sections present the development of Markovian models for concrete bridge decks, formulation of the maintenance management problem, and solution of this problem using genetic algorithms.
2. MARKOV-CHAIN MODELS FOR CONCRETE BRIDGE DECKS
Markov chain models are based on the concept of probabilistic cumulative damage, which predicts changes in element condition over multiple transition periods (Bogdanoff 1978). The main advantages of these models are: (i) ability to capture the different types of uncertainty; (ii) incremental in nature to account for the current condition in predicting the future condition; and (iii) practicality in dealing with large-sized networks because of their computational efficiency and simplicity of use.
Concrete bridge decks are considered the weakest link and the most expensive element of most bridge systems in North America. This is because many concrete bridge decks are experiencing extensive deterioration due to the corrosion of reinforcing steel resulting from the use of de-icing chemicals in winter, freezing and thawing cycles, and direct exposure to traffic loads (Lounis and Mirza 2001). Concrete bridge decks were selected as a “proof of concept” application of the proposed approach; however, the same procedures can be applied to any other components or infrastructure systems.
The data required for developing Markov-chain deterioration models of concrete bridge decks are obtained from the Ministére des Transports du Québec (MTQ) database. This database includes inventory data, condition data, and maintenance data for about 10,000 highway structures (MTQ 1997). The condition data consist of the results of the detailed visual inspections carried out on approximately one-third of the structures every year. These data contain the material condition rating (MCR) of different bridge components, which describe their condition based upon the severity and extent of observed defects. MCR’s are represented in an ordinal rating scale that ranges from 1 to 6, where 6 represents the condition of undamaged element (MTQ 1995).
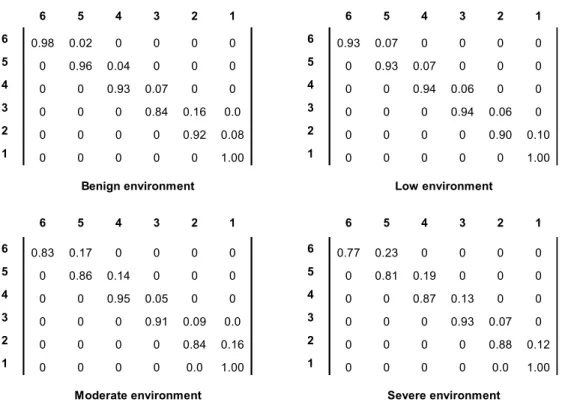
The MTQ data are screened by filtering out the records with missing condition data or incomplete inventory data in order to obtain a consistent, complete, and adequate data set for developing the Markov-chain deterioration models. The filtered data set includes the condition of 9,181 bridge deck spans and 14,982 inspection records. Figure 1 shows the transition probability matrices developed for concrete bridge decks protected with an asphalt concrete (AC) overlay in four environmental categories (benign, low, moderate, and severe). These environmental categories were determined for concrete bridge decks based on the following parameters: highway class, region, average daily traffic and percentage of truck traffic (Morcous et al. 2002). These transition probabilities were calculated as the ratio between the number of bridge decks that deteriorate from state i to state j within one transition period to the total number of bridge decks in state i before the transition, which is called the percentage prediction method (Jiang et al. 1988). These transition probabilities represent the deterioration of concrete bridge decks over one-year transition periods when the “do nothing” maintenance alternative is implemented. It should be noted that all the cells of these matrices are zero’s, except for the diagonal line and the line above it by assuming that a bridge deck can transit by, at most, one condition state in a year. This is referred to as the unit-jump deterioration model (Bogdanoff 1978).
6 5 4 3 2 1 6 5 4 3 2 1 0.98 0.02 0 0 0 0 6 0.93 0.07 0 0 0 0 0 0.96 0.04 0 0 0 5 0 0.93 0.07 0 0 0 0 0 0.93 0.07 0 0 4 0 0 0.94 0.06 0 0 0 0 0 0.84 0.16 0.0 3 0 0 0 0.94 0.06 0 0 0 0 0 0.92 0.08 2 0 0 0 0 0.90 0.10 0 0 0 0 0 1.00 1 0 0 0 0 0 1.0 6 5 4 3 2 1 6 5 4 3 2 1 0.83 0.17 0 0 0 0 6 0.77 0.23 0 0 0 0 0 0.86 0.14 0 0 0 5 0 0.81 0.19 0 0 0 0 0 0.95 0.05 0 0 4 0 0 0.87 0.13 0 0 0 0 0 0.91 0.09 0.0 3 0 0 0 0.93 0.07 0 0 0 0 0 0.84 0.16 2 0 0 0 0 0.88 0.12 0 0 0 0 0.0 1.00 1 0 0 0 0 0.0 1.00
Benign environment Low environment
Moderate environment Severe environment
0 6 5 4 3 2 1 6 5 4 3 2 1
Figure 1. Transition probability matrices for concrete bridge decks with AC overlay within one year
3. FORMULATION OF THE MAINTENANCE OPTIMIZATION PROBLEM
The proposed formulation of the maintenance optimization problem does not deal with individual bridge decks but rather with groups. These groups are determined based on the values of some explanatory variables such as the deck type, material properties, operating loads, and environmental conditions, which govern the deck performance. In this formulation, all bridge decks of the same group are assumed to have the same performance characteristics and should be analyzed in a similar manner. This classification reduces the computational complexity of the optimization problem and provides the decision maker with the flexibility to select the specific bridge decks that will be treated every year according to some other intangible factors (e.g. social, environmental, political, etc.). The parameters of the proposed formulation are defined as follows:
G = number of bridge deck groups;
T = number of years in the planning horizon;
S = number of condition states in the adopted rating system;
Ag = total area of bridge decks in group g;
Mg = number of possible maintenance alternatives for bridge decks in group g;
Dgt = condition vector (1 x S) of group g at the beginning of year t;
[1] Dgt = dgt1 dgt2 ... dgtS
where, dgts = percentage of deck area from group g in condition state s at year t.
Pgm = transition probability matrix (S x S) of group g when the maintenance alternative m
p gm 1,1 p gm 1,2 ... p gm1,S p gm 2,1 p gm 2,2 ... p gm 2,S [2] Pgm = . . ... . . . ... . p gm S,1 p gm S,2 ... p gm S,S
where, pgm i, j = transition probability of group g from condition state i to condition
state j during one year when the maintenance alternative m is implemented.
Xgmt = maintenance vector (1 x S) of group g for maintenance alternative m at year t;
[3] Xgmt = xgmt1 xgmt2 ... xgmtS
where, xgmts = percentage of bridge deck area in group g and condition state s that
had the maintenance alternative m during year t.
Cgm = cost vector (S x 1) of group g and maintenance alternative m.
c gm 1 c gm 2 [4] Cgm = . . c gm S
where, cgms = unit cost of implementing maintenance alternative m on the bridge
decks in group g and condition state s (unit costs should be adjusted for inflation when long planning horizons are used).
The condition of bridge decks from group g at year t can be predicted using the initial condition vector at year (t-1) and the transition probability matrices corresponding to the maintenance alternatives taken during this year multiplied by the maintenance vectors of this year as follows:
∑
= = − −=
Mg m gm t gm t g gtD
IX
P
D
1 ) 1 ( ) 1 ( m [5]where, I is a unit vector (S x 1)
The present value of the total cost of maintenance alternatives implemented on bridge decks from group g over the entire planning horizon T, denoted PVgT, assuming a discount rate r, can be calculated as follows:
∑ ∑
= = = = −+
=
t T t M m m t gm gmt gt g T g gr
C
IX
D
A
PV
1 1)
1
(
[6]The objective is to minimize the sum of the present value of the maintenance costs of all bridge deck groups, while keeping the condition of every group at any time above a pre-defined threshold value. Therefore, the optimization problem can be formulated as follows:
g
∑
= = G g 1 T g PV Minimize [7a] Thr g Cum gt D D : to Subject ≥ [7b]where DgtCum is the cumulative condition vector of group g at the beginning of year t, which contains the
percentages of bridge deck area whose condition is equal to or higher than a given condition state.DgThr is
the threshold condition vector (1 x S) of group g, which represents the minimum acceptable conditions that will be compared with the cumulative condition vector in every year. The threshold conditions vary from a bridge group to another according to the management policy of the transportation agency and are usually obtained from bridge experts based on their own judgment, as well as the availability of funds.
4. GENETIC ALGORITHM-BASED OPTIMIZATION TECHNIQUE
Genetic Algorithms (GA’s) are robust, practical, and general-purpose stochastic search-based optimization techniques. They are considered the most popular algorithms in the class of evolutionary computation, which comprises different methods for solving complex optimization problems by imitating living beings (Holland 1992; Goldberg 1989). GA’s were developed by Holland in the early 1970s based on the principles of natural selection and genetics. Since the early 1980’s, GA applications have been extensively used in a wide range of disciplines such as optimization, pattern recognition, robotics, and operation control. This widespread use of GA’s is due to their advantageous characteristics over conventional optimization techniques (Goldberg 1989) such as: (1) GA’s adopt the solution-pool approach in searching for the optimum solution instead of the single-solution approach of traditional techniques (which means that the GA can efficiently handle problems with large search spaces); (2) GA’s use probabilistic rather deterministic rules of conventional techniques for transition from one pool of solutions to another that contains better solutions (probabilistic rules increase the likelihood of finding the optimum solution without being trapped in local optima); and (3) GA’s use information on the objective function only and do not require any information on its gradients as in the conventional approaches, which greatly simplifies the mathematics of the problem.
This process of problem-solving in GA’s starts with identifying the parameters that describe the solutions of the given problem and determining the objective function. The encoding of solutions into chromosomes is essential because GA’s do not work with problem solutions in their original representation, but rather in a genetic representation that can be manipulated by the genetic operations described later. Each chromosome represents a single solution and consists of several genes that can be obtained using several encoding methods (Gen and Cheng 2000) such as: binary encoding, real-number encoding, integer or literal permutation encoding, and general data structure encoding. Binary encoding, which transfers a solution into a binary string (with 0 and 1 symbols), is the most widely used method because of
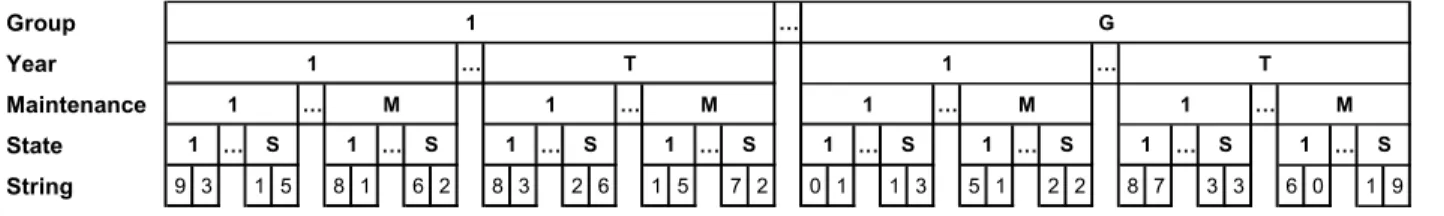
its simplicity. However, this method was not adopted for this current problem because its solution is represented by the percentage of bridge deck area from each group (G) that is subjected to each maintenance alternative (M) in each condition state (S) every year in the planning horizon (T). These percentages are real numbers and require the use of the real-number encoding method. Figure 2 shows the genetic representation of an example solution. In this representation, the number of digits that constitute each string, which is 2 in this example, depends on the level of accuracy required in estimating maintenance vectors. Group 1 … G Year 1 … T 1 … T Maintenance 1 … M 1 … M 1 … M 1 … M State … … … … … … … … String 9 3 1 5 8 1 6 2 8 3 2 6 1 5 7 2 0 1 1 3 5 1 2 2 8 7 3 3 6 0 1 9 S 1 1 1 S 1 S 1 S 1 S 1 1 S S S
Figure 2. Genetic encoding of problem parameters
Genetic algorithms select randomly a population of chromosomes with a predefined size, which constitutes the initial pool of solutions (parent pool). These solutions are evaluated using the objective function, which is referred to as “fitness function”. If the predefined stopping criteria, such as a maximum number of iterations or minimum changes in the average fitness, are satisfied, the solution with the maximum fitness is the optimum. If the stopping criteria are not satisfied, two processes are implemented to generate a new population from the existing one (Chong and Zak 2001). Selection is the first process in which the chromosomes of the parent pool are selected into a mating pool with different probabilities based on their fitness. Evolution is the second process in which the chromosomes of the mating pool are manipulated by two genetic operations, crossover and mutation, in order to produce the offspring pool. In the crossover operation, pairs of parent chromosomes are selected randomly with probability (pc) and
each pair exchanges the genes of the two chromosomes at one or more predefined crossing sites. The objective of this operation is to produce offspring solutions that have combined features from the parent solutions. In the mutation operation, the parent chromosomes are selected and their genes are randomly changed with a probability (pm). In the case of real-number encoding, the digits of the selected genes are
randomly substituted by other digits from 0 to 9. The objective of this operation is to introduce random changes into a small fraction of solutions to try some solutions that have never been selected. The new population resulting from these two operations is also evaluated using the objective function and the process is repeated until the stopping criteria are satisfied: then solution with the highest fitness is adopted as the optimum solution.
5. APPLICATION
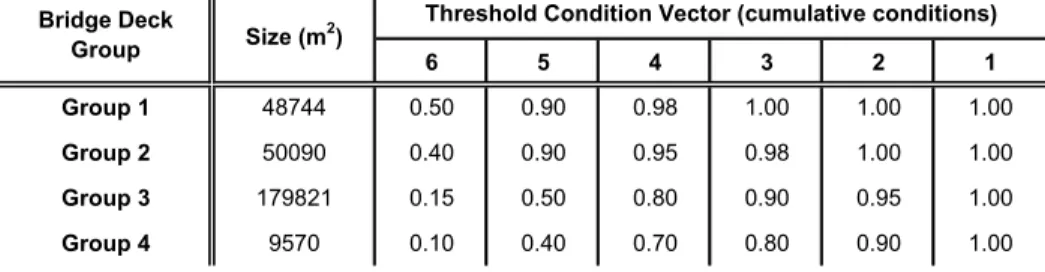
To apply the proposed approach, the concrete bridge decks recorded in the MTQ database are classified into four groups that correspond to the four environmental categories presented earlier. Table 1 shows the size of the bridge deck network (represented by the total deck surface area) of each group and the threshold condition vectors that are defined as annual constraints on the network condition. These vectors differ from one group to another because the definition of bridge deck groups considers parameters such as highway class, average daily traffic, and percentage of truck traffic. These parameters implicitly represent the importance of the structure to the public use and, consequently, control the determination of the minimum acceptable condition. For instance, the minimum acceptable condition of bridge decks on an express highway is higher than that of bridge decks on a collector highway.
Table1. Size and threshold condition vectors of the four bridge deck groups 6 5 4 3 2 1 Group 1 48744 0.50 0.90 0.98 1.00 1.00 1.00 Group 2 50090 0.40 0.90 0.95 0.98 1.00 1.00 Group 3 179821 0.15 0.50 0.80 0.90 0.95 1.00 Group 4 9570 0.10 0.40 0.70 0.80 0.90 1.00
Threshold Condition Vector (cumulative conditions) Bridge Deck
Group Size (m2)
For simplification purposes, the genetic algorithm is applied for each group assuming an undamaged initial condition vector (Dg0 = [1 0 0 0 0 0]) and only three possible maintenance alternatives: (i)
do-nothing, (ii) repair, and (iii) replace. The same procedures can be applied to bridge decks with any initial condition vectors and with a different number of maintenance alternatives. The GA tool called Evolver 4.0 (Palisade Co. 2000) is used in implementing the proposed formulation for a planning horizon of 15 years and a discount rate of 5%. For each group, an initial population with a size of 50 solutions, a probability of crossover equals to 50%, and a probability of mutation equals to 1% are selected. GA iterations are monitored using the progress graph that plot the number of iterations versus the average fitness of the population solutions along with the fitness of the best solution found. A maximum number of 1000 iterations is considered as the stopping criterion since the average fitness shown in the progress graph is almost constant. The optimal solution is determined as the solution with the highest fitness value within these 1000 iterations.
Table 2 lists the maintenance vectors of bridge decks in group 3 that represent the optimal solution obtained from applying the proposed approach to this group. This solution describes the percentage of the deck area in each condition state that requires one of the three identified maintenance alternatives. These percentages are available for each year in the planning horizon along with the overall condition vector resulting from applying these alternatives. For example, at year 3 (shaded row), the optimal maintenance vectors indicate that: (i) for bridge decks in condition 6, the optimal solution is the “do nothing” alternative for all bridge decks; (ii) for bridge decks in condition 5, the optimal solution is the “do nothing” alternative for 75% of the decks and the “repair” alternative for the remaining 25%; (iii) for bridge decks in condition 4, the optimal solution is the “do nothing” alternative for 58% of the decks, the “repair” alternative for 21% of the decks, and the “replace” alternative for the remaining 21%. These are percentages from the overall condition vector of the previous year (i.e. the year 2 in this example), which has the following condition distribution: 75% of the bridge decks are in condition 6, 23% are in condition 5, and only 2% are in condition 4. Applying these maintenance vectors result in the overall condition distribution shown in the shaded row of Table 2. This distribution consists in the following: 68% of the bridge decks are in condition 6, 28% are in condition 5, and 4% are in condition 4, which in turn are used in determining the optimal maintenance vectors of the following year (i.e. year 4 in this example).
Table2. Optimal maintenance vectors for bridge decks in group 3
Year 6 5 4 3 2 1 Average 0 1.00 0.00 0.00 0.00 0.00 0.00 6.00 6 5 4 3 2 1 6 5 4 3 2 1 6 5 4 3 2 1 1 0.83 0.17 0.00 0.00 0.00 0.00 5.83 1.00 - - - 0.00 - - - 0.00 - - - - -2 0.75 0.23 0.02 0.00 0.00 0.00 5.73 1.00 0.63 - - - - 0.00 0.37 - - - - 0.00 0.00 - - - -3 0.68 0.28 0.04 0.00 0.00 0.00 5.65 1.00 0.75 0.58 - - - 0.00 0.25 0.21 - - - 0.00 0.00 0.21 - - -4 0.57 0.38 0.05 0.00 0.00 0.00 5.53 1.00 0.98 0.21 - - - 0.00 0.02 0.51 - - - 0.00 0.00 0.28 - - -… 15 0.24 0.52 0.22 0.02 0.00 0.00 4.99 1.00 1.00 0.89 - - - 0.00 0.00 0.04 - - - 0.00 0.00 0.07 - -
-Overall Condition Vector
Do nothing Repair Replace
6. CONCLUSIONS
This paper introduced an innovative approach to programming maintenance activities for a network of bridges, which is a crucial task in any bridge management system. The proposed approach uses genetic algorithm (GA) optimization techniques and Markovian performance prediction models to find the optimal maintenance alternatives over a specific planning horizon given the condition requirements and budget constraints. GA optimization techniques were adopted to overcome the mathematical complexity and combinatorial explosion associated with using conventional optimization techniques such as, optimal control theory, linear, non-linear, integer, and dynamic programming. Markovian performance prediction models were adopted because of their efficiency with large size networks and ability to capture the uncertainties associated with infrastructure deterioration, maintenance operations, and condition assessment. Field data obtained from the Ministére des Transports du Québec (MTQ) were used in developing Markovian models for four groups of concrete bridge decks exposed to different environments (benign, low, moderate, and severe). Real-number encoding method was used to develop the genetic representation of the solution parameters, which are the percentages of the total deck area of each group in each condition state that require specific maintenance alternative every year in the planning horizon. This application illustrated the feasibility and capability of the new approach in programming maintenance alternatives.
7. ACKNOWLEDGEMENTS
The authors wish to acknowledge the Natural Sciences and Engineering Research Council of Canada for financially supporting this research program. The authors are grateful to M. Guy Richard, Eng., Director, and M. René Gagnon, Bridge Engineer, of the Structures Department - Ministére des Transports du Québec - for their invaluable help in providing the authors with the needed data, manuals and information. 8. REFERENCES
Bogdanoff, J. L. (1978) A New Cumulative Damage Model – Part I, Journal of Applied Mechanics, 45 (2), 246-250.
Chong, P., and Zak, S. (2001) An Introduction to Optimization, John Wiley & Sons Inc., New York.
Fwa, T. F., Chan, W. T., and Hoque, K. Z. (1998) Analysis of Pavement Management Activities
Programming by Genetic Algorithms, Transportation Research Record, TRB, 1643, 1-6.
Fwa, T. F., Chan, W. T., and Tan, C. Y. (1996) Genetic Algorithm Programming of Road Maintenance and
Rehabilitation”, Journal of Transportation Engineering, ASCE, 122 (3), 246-253.
Gen, M., and Cheng, R. (2000) Genetic Algorithms and Engineering Optimization, John Wiley & Sons Inc., New York.
Goldberg, D. E. (1989) Genetic Algorithms in Search, Optimization, and Machine Learning, Addison-Wesley Publishing Co., New York.
Holland, J. (1992) Genetic Algorithms, Scientific American, July.
Jiang, Y., and Sinha, K. C. (1988) A Dynamic Optimization Model for Bridge Management Systems Transportation Research Record, TRB, 1211, 92-100.
Liu, C., Hammad, A., and Itoh, Y. (1997) Maintenance Strategy Optimization of Bridge Decks Using
Genetic Algorithm, Journal of Transportation Engineering, ASCE, 123 (2), 91-100.
Lounis, Z. “(2000) Reliability-Based Life Prediction of Aging Concrete Bridge Decks, Life Prediction and Aging Management of Concrete Structures, Naus, D. (ed.), RILEM Publications, 229-238.
Lounis, Z., and Mirza, M. S., (2001) Reliability-Based Service Life Prediction of Deteriorating Concrete
Structures, Proc. of the 3rd International Conference on Concrete Under Severe Conditions, N.
Banthia, K. Sakai, and O. E. Gjorv (eds.), Vancouver, Canada, 965-972.
Ministére des Transports du Québec (MTQ) (1995) Manuel d’Inspection des Structures: Evaluation des
Dommages, Bibliothèque Nationale du Québec, Gouvernement du Québec, Canada.
Ministére des Transports du Québec (MTQ) (1997) Manuel de l’Usage du Système de Gestion des
Structures SGS-5016, Bibliothèque Nationale du Québec, Gouvernement du Québec, Canada.
Morcous, G., Lounis, Z., and Mirza, S. M. (2002) Identification of Governing Parameters of Markovian
Performance Prediction models for Bridge Structures Using Genetic Algorithms, Journal of Bridge
Engineering, ASCE, Accepted in November 2002.
Palisade Co. (2000) Evolver 4.0, http://www.palisade.com/html/evolver.html. 9. NOTATION
The following symbols are used in this paper: G = number of bridge deck groups
T = number of years in the planning horizon
S = number of condition states in the adopted rating system Ag = total area of bridge decks in group g
Mg = number of possible maintenance alternatives for bridge decks in group g
Dgt = condition vector of group g at the beginning of year t
dgts = percentage of deck area from group g in condition state s at year t
Pgm = transition probability matrix of group g when maintenance alternative m is implemented
pgmi, j = transition probability of group g from condition state i to condition state j during one year
when the maintenance alternative m is implemented
Xgmt = maintenance vector of group g for maintenance alternative m during year t
xgmts = percentage of bridge deck area in group g and condition state s that had the maintenance
alternative m during year t
Cgm = cost vector of group g and maintenance alternative m.
cgms = unit cost of implementing maintenance alternative m on the bridge decks in group g and
condition state s I = unit vector r = discount rate
PVgT = present value of the total cost of maintenance alternatives implemented on bridge decks
from group g over the entire planning horizon T
DgtCum = cumulative condition vector of group g at the beginning of year t