HAL Id: halshs-00705354
https://halshs.archives-ouvertes.fr/halshs-00705354v2
Preprint submitted on 29 Jan 2014HAL is a multi-disciplinary open access
archive for the deposit and dissemination of sci-entific research documents, whether they are pub-lished or not. The documents may come from teaching and research institutions in France or abroad, or from public or private research centers.
L’archive ouverte pluridisciplinaire HAL, est destinée au dépôt et à la diffusion de documents scientifiques de niveau recherche, publiés ou non, émanant des établissements d’enseignement et de recherche français ou étrangers, des laboratoires publics ou privés.
The Fiscal Cost of Trade Liberalization
Julia Cage, Lucie Gadenne
To cite this version:
WORKING PAPER N° 2012 – 27
The Fiscal Cost of Trade Liberalization
Julia Cagé
Lucie Gadenne
JEL Codes: H10, H20, F13, O17
Keywords: Taxation and development, Trade liberalization, State capacity, Tax
and tariff reform
P
ARIS-
JOURDANS
CIENCESE
CONOMIQUES48, BD JOURDAN – E.N.S. – 75014 PARIS TÉL. : 33(0) 1 43 13 63 00 – FAX : 33 (0) 1 43 13 63 10
Tax Revenues, Development, and the Fiscal Cost of Trade
Liberalization, 1792-2006
Julia Cag´e and Lucie Gadenne∗ January 2014
Abstract
This paper puts the recent evolution of tax revenues in developing countries in historical perspective. Using a novel dataset on total and trade tax revenues we compare the fiscal cost of trade liberalization in developing countries and in today’s rich countries at earlier stages of development. We find that trade liberalization episodes led to larger and longer-lived decreases in total tax revenues in developing countries since the 1970s than in rich countries in the 19th and early 20th centuries. The fall in total tax revenues lasts more than ten years in half the developing countries in our sample.
∗
Cag´e: Harvard University and Paris School of Economics, Department of Economics, Littauer Center North, Cambridge, MA 02138, cage@fas.harvard.edu. Gadenne: University College London and Institute for Fiscal Studies, 30 Gordon Street WC1H 0AX, l.gadenne@ucl.ac.uk. The dataset constructed for this paper is available on the authors’ websites. We gratefully acknowledge helpful comments and suggestions from Alberto Alesina, Tim Besley, Denis Cogneau, Emmanuel Farhi, Walker Hanlon, Wojciech Kopczuk, Marc Melitz, Nathan Nunn, Thomas Piketty and Romain Ranci`ere. We also thank Thomas Baunsgaard and Michael Keen for sharing their data and seminar participants at Harvard University, Columbia University and Paris School of Economics for useful comments and suggestions. A previous version of this paper was circulated under the name ‘Tax Capacity and the Adverse Effects of Trade Liberalization’.
1
Introduction
This paper documents the fiscal cost of trade liberalization: the extent to which countries are able to recover the trade tax revenues lost from liberalizing trade by increasing tax revenues from other sources. Our starting point is a puzzle in the recent evolution of tax revenues in developing countries: tax-to-GDP ratios decrease in these countries since 1970, in
contradic-tion with the so-called ‘Wagner’s Law’1 which states that tax ratios increase over time and as
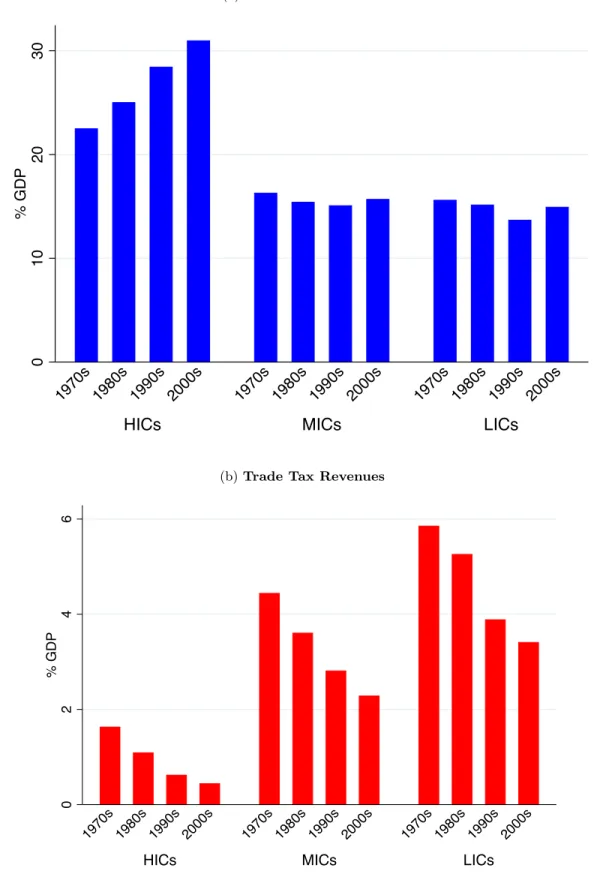
countries become richer. Figure 1 presents the evolution of the share of total tax and trade tax revenues over GDP in high-income countries (hereafter HICs), middle-income countries (MICs) and low-income countries (LICs) since the 1970s. In the top panel (Figure 1a) we see that tax ratios decrease in both MICs and LICs. This is particularly striking over the period 1970-2000 during which they fall by over 2 GDP points on average in both country groups. HICs, in contrast, experience a continuous increase in tax ratios over time. The bottom panel (Figure 1b) offers a potential explanation for this fall in tax ratios. It shows the evolution of trade tax revenues in the three country groups. The decrease in the share of trade tax revenues over GDP in MICs (2.2 GDP points) and LICs (2.5 GDP points) is large enough to explain the observed fall in tax ratios in both country groups.
We investigate the relationship between changes in total and trade tax revenues in de-veloping countries along two dimensions. First, we ask whether countries in which trade tax revenues decrease experience a contemporary fall in total tax revenues and if yes for how long it lasts. We call this fall the fiscal cost of trade liberalization. We consider whether this cost is more frequent in LICs and MICS than in HICs since 1970, as suggested by Figure 1. Second, we turn to the historical experience of today’s developed countries to determine whether the fiscal cost of trade liberalization is specific to the context in which developing countries liberalized trade since 1970.
In order to do so we construct a new dataset on tax revenues and government expenditures from a variety of historical and contemporary sources. For each of the 130 countries in our dataset we go as further back in time as possible: our dataset starts in 1792 for one country (the United States), covers 9 countries in the 19th century and 35 countries in the first half of the 20th century. It is to the best of our knowledge the most exhaustive dataset on tax revenues available to researchers.
We suggest and implement a method to identify episodes of trade liberalization and
mea-sure the contemporary change in total tax revenues. We use a fiscal definition of trade
liberalization: we characterize a trade liberalization episode by a large and prolonged fall in trade tax revenues over GDP. We then study whether countries are able to replace the fall in trade tax revenues by an increase in other (domestic) tax revenues and argue that there is a
1This ‘law’ is named after German economist Adolph Wagner (1835-1917) who first analyzed the relationship between tax ratios and economic development.
fiscal cost of trade liberalization when total tax revenues fall after the start of the episode. We say that there is fiscal recovery once total tax revenues are back to their pre-episode level. Our method may capture decreases in trade tax revenues which are not the consequence of countries’ opening to international trade. We investigate possible causes for each episode using data on tariff rates, trade volumes, exchanges rates and the history of countries’ trade policies. We find that 70% of the episodes can be to linked to changes in trade policy.
We find 140 episodes of trade liberalization. Trade taxes fall by more than 3 GDP per-centage points on average during these episodes. 49% of the countries have recovered the lost tax revenues 5 years after the start of the episode and we never observe a fiscal recovery in over 25% of the countries. There are clear differences by level of development in the period since 1970. The fall in total tax revenues contemporary to the episodes is larger and lasts longer in developing countries (MICs and LICs) than in rich countries (HICs). Rich countries which experience a trade liberalization episode never experience any fiscal cost whilst over 50% of developing countries do. Moreover nearly 40% of LICs (34% of MICs) are never ob-served recovering the lost trade tax revenues through other tax instruments. Turning to the historical (pre-1970) evidence we find that the fiscal cost of trade liberalization experienced by today’s HICs at early levels of economic development is smaller and shorter-lived than the one experienced by developing countries since 1970. This cost is still larger in countries that were poorer at the start of the episode. Overall, episodes of trade liberalization are found to have a more negative impact on tax revenues in poorer countries, particularly so since the 1970s.
Our results are robust to the choices made in defining an episode of trade liberalization. Changing the extent to which we smooth the tax data prior to identifying episodes and fiscal recovery, varying the thresholds used to define an episode and normalizing tax revenues by population instead of GDP hardly affects our results concerning the fiscal cost of trade liber-alization. We also find similar results when excluding episodes for which we see that countries increased tax revenues prior to the onset of the episode, suggesting they may have chosen to pre-empt the fall in trade tax revenues by increasing domestic tax revenues beforehand. Finally, results are similar when we consider only episodes that we can link to changes in trade policy and when we consider the episodes’ impact on government expenditures.
This paper is closely related to ? who first identified the existence of a trade-off between tax revenues and trade liberalization. Using 32 years of panel data they estimate how domestic tax revenues react to changes in trade tax revenues in the short run. They, like us, find an incomplete replacement of lost trade tax revenues in LICs. We complement their work in several ways. First, our method abstracts from short-term co-movements between domestic tax and trade tax revenues which may be unrelated to structural changes in countries’ tax structures. We pay particular attention to the extent to which our conclusions are driven by
our methodological choices and find that they are not. Second, our longer and more complete dataset allows us to generalize their results for today’s developing countries to their complete fiscal history since independence. Third, we compare these results to the fiscal impact of trade liberalization in today’s rich countries when they were at similar levels of development and elaborate on the difference between today’s developing countries and the historical experience of rich countries to discuss potential explanations for the fiscal cost of trade liberalization. Finally, we consider the possibility that countries that do not recover the lost revenues from trade taxes through an increase in domestic taxes may nevertheless experience an increase in non-tax revenues (development aid for example) by studying the impact of trade liberalization not only on tax revenues but also on government expenditures.
Our results also speak to the literature explaining why tax levels and tax structures change as countries develop. Recent examples include the work by ?? in which countries’ decisions to invest in tax capacity allows them to increase their tax ratios over time and to decrease
their dependence on trade taxes. Others argue that as economies develop they undergo
structural changes which make transactions easier to monitor and allow government to rely less on less efficient but easier to levy taxes like taxes on trade (see e.g. ???). These theories imply that countries will decrease trade taxes once they find themselves capable of levying domestic taxes but they cannot rationalize the fiscal cost of trade liberalization. We return to this literature when discussing one possible interpretation for our results, namely that developing countries liberalized trade ‘too early’ from a fiscal perspective. A smaller literature discusses the conditions under which revenue-neutral reforms replacing taxes on trade by domestic taxes such as the VAT will be optimal (???). Our results show that the typical trade liberalization reform in developing countries since 1970 was not revenue-neutral but instead lead to a decrease in total revenues.
This paper contributes more generally to the growing literature on public finance and
development (see for example ?????) by providing a new exhaustive dataset on the subject.2
We assemble historical and contemporary data on tax revenues in a coherent way that allows for meaningful comparison across countries and over three centuries. We hope our dataset will be of use to researchers in this field by providing a historical perspective on how both tax ratios and tax structures change as countries develop.
The remainder of the paper is organized as follows. Section 2 describes the data used and presents descriptive statistics on taxation and development. Section 3 presents our method and results regarding the fiscal cost of trade liberalization. Section 4 discusses the results. Section 5 concludes.
2
Data and descriptive statistics
2.1 Data
We combine data on total tax revenues and trade tax revenues from three different sources: ?’s International Historical Statistics, the dataset constructed by ? and the International
Monetary Fund’s Government Finance Statistics (GFS). We digitize the data in ? who
compiles information on governments revenues from different national sources for all countries from the earliest available date to 2006. ? construct a dataset on total and tax revenues in 117 countries over the period 1975-2006 using the revenue information provided by the IMF’s periodic consultations with member countries. The IMF’s GFS spans the period 1972-2006 and has more limited coverage than the two other sources.
Our aim is to detect and analyze changes in total and trade tax revenues within countries over time. We therefore combine these three datasets in a way that does not allow for within
country ‘jumps’ in the series which could be due to changes in data sources. To do so,
we determine which dataset contains the largest number of observations for each country and use only data from this source for each country, unless we see a clear continuity across
sources.3 When two data sources cover different and large periods of time for a country but
have different information for the time period during which they overlap we create a separate ‘country’ identifier for each period to avoid confounding a change in the series due to a change in the source with a real change in tax revenues. Finally, there are some gaps in the series when data is not available. We do a linear interpolation when the gaps last less than three years. When the gaps are longer (typically during wars), we drop the years for which the data is missing and create another country identifier when the series start again. We obtain a total of 5,200 observations for 130 countries from 1792 to 2006. Most of the observations come from ? (49% of the observations) and ? (44%). The web Appendix describes the data in more detail. Table A lists the countries in our sample and the data sources used for every country.
We complement our analysis of tax revenues by using data on the share of government expenditures in GDP from three different sources. We use the same source for our expenditure variable as for our tax variables whenever possible. Information on expenditures is available from ? for most of the observations for which there is also tax information from this source. The dataset compiled by ? however contains no information on expenditures and the GFS dataset little information. We therefore use the IMF’s World Economic Outlook (WEO) database to complement our dataset. We obtain information on the share of government
3
Formally, we say that there is continuity across sources if both sources have the same information for the years on which they overlap and/or there is less than a 1 GDP point difference in the total tax and trade tax series across sources. This threshold was choosen to ensure that no change in data sources could be mistaken for the start of an episode as defined below.
expenditure in GDP for 5,036 observations for 128 countries, 54% of which from ?, 40% from the WEO database and 6% from GFS.
We use the GDP per capita data constructed by ? to classify countries by level of devel-opment. GDP is measured in 1990 Geary–Khamis dollars and is available for all countries for our period of interest. We classify countries by income group following the earliest available
country classification from the World Bank (1987).4 Based on this classification we say that
a country is a high-income country (HIC) when its GDP per capita is above 8,000 dollars, a low-income country (LIC) when its GDP is below 2,000 dollars and a middle-income country (MIC) in between. The United States for example is a LIC until 1856, a MIC until 1941 and a HIC after that. We sometimes classify countries with respect to their GDP in 2006. When we refer to ‘today’s developing countries’ we include all countries that are a LIC or a MIC in 2006. Classifying countries with respect to their 2006 GDP per capita our dataset includes 41 LICs, 49 MICs and 40 HICs. Countries are listed by their 2006 country group in the web Appendix Table A.
Finally, we collect data on countries’ trade policies and macro-economic situations to investigate whether the episodes we identify are due to trade liberalization. We use data on average tariff rates from ? which provide annual data from 1865 to 1999, and complement it with information from the United Nations’ Statistical Yearbook and the World Bank’s World
Development Indicators.5 Data on trade volumes and exchange rates comes from the World
Development Indicators. Information on the dates of entry of the different countries in our sample in regional and international trade agreements is obtained from the World Trade Organization and its Regional Trade Agreements Information System. Finally we collect information on the historical trade policy of countries from various volumes of the Cambridge Economics Histories.
2.2 Descriptive Statistics
Table 1 shows the evolution of total and trade tax revenues as a share of GDP and GDP per capita since the 1830s for countries that are HICs, MICs or LICs in 2006. It highlights several stylized facts of interest regarding taxation and development. First, we see that tax-to-GDP ratios (hereafter tax ratios) increase with GDP per capita, in line with Wagner’s Law. This is particularly evident in column 1 depicting the evolution of tax ratios for today’s HICs. In the 1830s, the two countries for which data is available (the UK and the US) are what we would today call LICs and levy less than 7% of their GDP in taxes. Tax ratios then increase
4
The World’s Bank 1987 country classification uses a GDP concept that is slightly different from the one used in ?. We choose the GDP per capita thresholds that most closely match the World Bank’s classification in 1987 in our dataset.
5Average tariff rates are calculated as the total revenue from import duties divided by the value of total imports in the same year.
in the second half of the 19th century to 9% as countries become MICs and keep increasing by roughly 4-5 GDP points every twenty years until today. The trend of the first half of the 20th century, well-documented and often explained by higher demand for public spending during wars (see for example ?), is maintained in the second half of the century. These findings are robust to considering only the 8 today’s HICs for which data is available from the 1890s to the 1990s, as shown in the web Appendix Table B.1. The cross-sectional comparison between HICs, MICs and LICs in 2000-2006 also shows a positive, albeit weaker, correlation between economic development and tax ratios. HICs are today on average 16 times richer than LICs and levy twice as much taxes as a share of GDP.
Table 1 also illustrates a lesser-known stylized fact about taxation and development, the ‘tax transition’. Countries at an early state of development rely on taxes on trade to levy
a large share of their revenues, as they develop this share becomes smaller.6 Trade taxes
represent nearly 50% of total taxes on average in the HICs we observe in the 1830s (column 1). This share falls to 18% in the 1920s, 12% in the 1950s and decreases in the last 50 years to around 2% today. We observe a similar decrease in the share of trade taxes in total taxes in developing countries, where trade taxes represent more than 25% (MICs) and nearly 40% (LICs) of total taxes in the 1970s. This share decreases to less than 15% (22%) in the 2000s. The correlation between the share of trade taxes in total tax revenues and development also holds in the cross-section: in 2000-2006, the share of trade taxes in total tax revenues is ten times bigger in LICs than in HICs.
The evidence also suggests that the tax transition took a different form in today’s HICs compared to developing countries. In HICs the decrease in the share of trade taxes in total taxes is mostly due to an increase in non-trade tax revenues: from 1860 to 1980 the share of trade taxes in GDP remains roughly constant (between 1 and 2.5%) while the tax ratio strongly increases. The share of trade taxes in GDP only clearly decreases from 1980 to 2006, a period during which trade taxes already represent a negligible share of total revenues. In developing countries on the contrary the tax transition is due to a decrease in the share of trade taxes over GDP, starting from a higher level, and not to an increase in tax ratios.
Changes in the number of countries in each group may lead to spurious changes in average
values over time. Focusing on the recent period during which more data for developing
countries is available we see a similar pattern when we only consider the 87 countries for which we have data in each decade from 1970 to 2006 (Table 2). As discussed in the introduction tax ratios have decreased in both MICs and LICs during the 1980s and 1990s with tax ratios falling by 2 GDP points in LICs over the period. The share of trade taxes in GDP falls by nearly half in all country groups. This fall is more than enough to explain the decrease in total tax ratios over time in MICs and LICs but does not halt the increase in tax ratios in
HICs.7
3
The Fiscal Cost of Trade Liberalization
3.1 Method
We take a fiscal approach to trade liberalization. We define trade liberalization episodes by a fall in trade tax revenues as a percentage of GDP of at least 1 GDP point from a local
maximum to the next local minimum.8 Ratios of tax revenues to GDP experience short-run
fluctuations that may come from exchange rate volatility, changes in the reporting period or business cycles and be unrelated to change in tax policy. We isolate the trends in our data on total tax, trade tax and expenditure as a share of GDP to avoid confounding episodes of trade liberalization with short-run correlations. Our main method uses the Hodrick-Prescott
filter; we follow ? in using a 6.25 smoothing parameter9. We define the ‘size’ of an episode
by the difference between the local maximum value of trade tax revenues as a percentage of GDP at the start of the episode (year s) and the following local minimum value of trade tax revenues at the end of the episode (year e). The distance between year e and year s is the ‘length’ of the episode.
We measure the potential fiscal cost of trade liberalization by looking at the evolution of total tax revenues as a percentage of GDP. By definition, total tax revenues are expected to fall during an episode unless countries are able to increase their tax collection from other (domestic) sources of tax revenues by an amount large enough to compensate the fall in trade tax revenues. In the absence of such an increase, we say that countries experience a fiscal cost of trade liberalization. More precisely we measure for each episode of decrease in trade tax revenues (i) whether total tax revenues as a share of GDP fall at the start of the episode; and (ii) if they do, the number of years before total tax revenues come back to their level before the start of the episode. Formally, we define the ‘revenue recovery’ year (r) as the first year in which total tax revenues as a percentage of GDP are at least equal to their value in year s. We call the distance between year r and year s the ‘recovery time’.
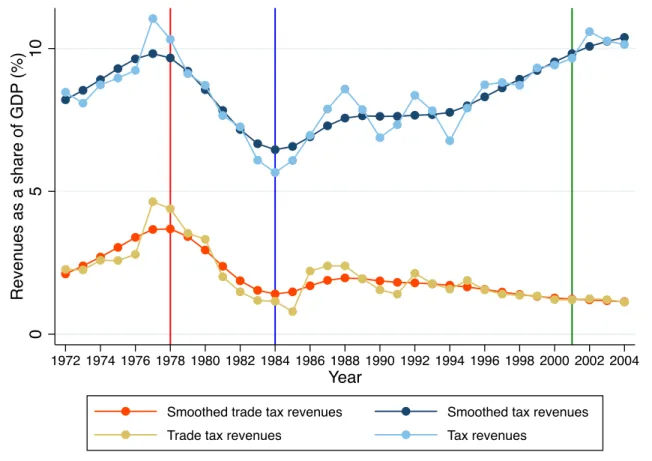
Figure 2 illustrates graphically how we construct the episodes, the fiscal cost and the fiscal recovery variables using the example of Guatemala for which we have data over the period 1972-2004. The vertical red line shows the start of the episode, the blue line its end and the
7Part of the very large increase in tax ratios in HICs is due to changes in the data sources used over time. Our educated guess from comparing our data to official numbers released by countries’ statistical institutes is that social security contributions are not included in the ? data but they are in the ? data. Web Appendix Table B.2 shows that the increase is smaller when we use only data from ?.
8
We say that an observation is a local maximum (minimum) if it is higher (lower) than the preceding and following observations.
9
This corresponds to a value of 1600 for quarterly data. ? show that the smoothing parameter should be adjusted according to the fourth power of a change in the frequency of observations.
green line the year of recovery. The episode starts in 1978, lasts six years and has a size of 2.4 GDP points. We observe a fiscal recovery after 23 years.
Trade liberalization is not the only possible explanation for the decreases in trade tax revenues we observe. They could also be the consequence of a fall in trade volumes, a shock to the exchange rate or a major destructive event that leads to a collapse in both trade and domestic tax collection. We use data on average tariff rates, trade volumes, exchange rates and dates of entry in regional and international trade agreements to identify potential explanations for the episodes. We argue that episodes which start during or just before a free trade agreement or which are contemporary to large decreases in average tariff rates,
are episodes that are likely due to trade liberalization.10 Our example of Guatemala in 1978
counts as one such episode: the average tariff rate fell by 30% between 1978 and 1982. Table A in the web Appendix lists the countries in which episodes occur, episode start dates, and possible explanations for the decrease in trade tax revenues. We find that nearly 70% of the episodes can be traced back to some form of trade liberalization policy (a trade agreement, a fall in tariffs or a documented change in trade policy). Another 11% are contem-porary with a fall in trade and 6% with an exchange rate shock. A few episodes could be the consequence of wars or natural disasters and we cannot find an explanation for 12 episodes.
Finally, categorizing a decrease in total tax revenues after the start of an episode as a ‘fiscal cost of trade liberalization’ is not appropriate if the decrease in trade tax revenues has been pre-empted. Countries may decide to increase tax revenues from domestic sources before lowering tariffs precisely to counterbalance for the coming fall in trade tax revenues. The level of domestic tax revenues we observe at the start of the episode would then already compensate for the loss in trade tax revenues during the episode. We consider the evolution of domestic tax revenues in the years prior to the start of the episode to investigate whether such pre-emptive measures occur.
3.2 Results: Trade Liberalization Episodes
Table 3 presents descriptive statistics on our sample of 140 episodes of decreases in trade tax revenues. We consider separately the pre- and post-1970 periods and countries that were HICs, MICs and LICs at the start of the episode to investigate whether today’s developing countries experienced a different fiscal cost of trade liberalization from today’s HICs when they decreased trade tax revenues in the 19th and early 20th centuries. The choice of the 1970 year to split our sample is driven by the fact that for the majority of developing countries in our sample, data only becomes available a few years after independence. We report the
10More precisely, we associate an episode with a free-trade agreement if it occurs 3 years before or after the agreement. This is to take into account the fact that our smoothing method may lead us to measure the precise onset of the episode with error.
total number of observations available in our dataset for the period and country groups under consideration to consider whether episodes are more likely in some periods and groups.
We see that the average potential loss in tax revenues due to an episode is large: trade tax revenues fall on average by 3.2 GDP points during the episode (column 1). This fall represents 58% of the average trade tax revenues and 19% of total tax revenues at the start of the episode. The typical episode lasts 12 years. There is a small increase in the frequency of episodes in the recent period compared to the pre-1970 period (3 episodes for 100 observations versus 2 episodes for 100 observations prior to 1970) despite its much shorter time span. Episodes are also slightly deeper (bigger sizes spread out over shorter periods) since 1970. Turning to differences by income group at the start of the episode we see that poorer countries always experience deeper episodes. There are also much more likely to experience episodes since 1970: there are 0.3 episodes per 100 observations among HICs, 3.6 among MICs and 4.6 among LICs.
The last line of Table 3 presents the share of countries in which total tax revenues increase in the 3 years prior to the episode by at least as much as the size of the episode. We see that on average few countries – 6.6% – preempt the loss in trade tax revenues (column 1). This share is much higher among countries that are HICs at the start of the episode; in particular the three rich countries which experience an episode after 1970 also experience increases in tax revenues prior to the episode that more than compensate for the loss in trade taxes. Excluding these episodes from our sample does not change the overall picture in Table 3 (see web Appendix Table B.3).
Table 4 presents descriptive statistics for the 96 episodes that we can associate with a change in trade policy. These episodes are very similar to the average episode in Table 3. On the whole the two tables indicate that countries are more likely to experience episodes of decrease in trade tax revenues at earlier stages of economic development and that this is particularly true since 1970.
3.3 Results: Fiscal Cost of Trade Liberalization
Table 5 presents our measure of the fiscal cost of trade liberalization. We find several patterns of interest.
First, many countries do not experience any fiscal cost of trade liberalization. The first line of the table presents the share of countries for which we do not observe any fall in total tax revenues at the start of an episode. In these countries trade tax revenues fall but domestic sources of tax revenues increase more than enough to compensate this fall. This occurs for nearly half of the episodes and more often in the pre-1970 period (55% of episodes, column 2) than in the recent period (44%, column 6). Developing countries are more likely than HICs to experience a fall in total tax revenues in the recent period (post-1970). None of the
three HICs which experience a fall in tax revenues after 1970 experience such a fall in total tax revenues, while more than 50% of the MICs and 60% of the LICs do. Second, roughly one-fourth of the countries are never observed going back to their pre-episode level of tax revenues – we say that they experience no fiscal recovery. This is more likely in the recent period and again varies with economic development. All the HICs experience a fiscal recovery but more than a third of the developing countries for which the episode starts after 1970 do not. Third, the countries for which we observe both a fiscal cost and a fiscal recovery return to their pre-episode level of tax revenues faster since 1970 than before 1970 (third line). They do so on average 7 years after the start of the episode in the pre-1970 period and 4 years in the post-1970 period.
The fact that countries that experience episodes since 1970 are less likely to recover fiscally but recover faster when they do suggests that part of the differences across periods may be due to the fact that our data is truncated. We indeed observe countries for a smaller number of years in the post-1970 than in the pre-1970 period and may not have long enough time series after the most recent episodes to observe fiscal recoveries. Similarly, we could be observing less recovery in developing countries because data series are typically shorter for these countries than for HICs. We check that this is not what is driving our results. The fourth line in Table 5 indicates the number of years for which we observe countries in the data after the start of the episode. This number is only slightly higher in the post- than in the pre-1970 period. Results are moreover similar when we only consider countries which we observe for five, ten or twenty years after the start of the episode (last three lines). We always see countries recovering more in the pre- than in the post-1970 period; developing countries are always less likely to recover than HICs, especially in the post-1970 period.
3.4 Robustness Checks
Our definition of ‘trade liberalization episodes’ is overly sweeping. As explained above some of the episodes probably have little to do with trade liberalization policies; the evolution of total tax revenues after these episodes should not be interpreted as reflecting the fiscal cost of trade liberalization. Table 6 replicates the results in Table 5 for the sample of episodes that we can associate with a change in trade policy. The share of developing countries making a full fiscal recovery in the medium-run (10 or 20 years after the end of the episode) is slightly higher than in Table 5, in line with the idea that some of the other episodes may be due to external shocks that affect both domestic and trade collection negatively. The main pattern -lower likelihood of recovery in developing countries, particularly since 1970 - remains however similar.
The paper’s web Appendix presents additional robustness checks on our measures of episodes of decreases in trade tax revenues and the fiscal cost of trade liberalization. Our
results are unaffected if we only consider non pre-empted episodes (web Appendix Table
B.9).11 Another potential concern is that the method we use to define episodes does not
get rid of all noisy short-run variations in tax revenues, in which case some of our episodes are spurious, or gets rid of too much variation, leading us to exclude informative episodes. We consider episodes defined using a higher (2 GDP points) threshold for the fall in trade tax revenues and check for the robustness of the results to the choice of filter by consid-ering episodes obtained using different smoothing parameters for the HP filter (8.25, as in ? and 10, as in ? and ?). Another concern with the HP filter is its ‘end-point bias’ (see for example ?) as the last point of the series has an exaggerated impact on the trend. We use the Christiano-Fitzgerald band-pass filter to check that this bias is not driving some of our results (?). Results are presented in Tables B.4 to B.7 and Tables B.10 to B.13 in the web Appendix. We obtain slightly more episodes (169) when using the Christiano-Fitzgerald method and slightly less when using higher values of the HP filter or a higher threshold for the definition of the episodes, as expected. The main patterns found in Tables 3 and 5 are however unaffected; the results on the fiscal cost of trade liberalization are particularly robust to changes in the method used.
Finally, a large share of the economy in developing countries is informal (?). If the informal sector of the economy is untaxed but partially captured in GDP data faster growth in the informal than in the formal sector would lead us to identify spurious episodes for which there is no fiscal recovery. We consider an alternative measure of episodes using data on tax revenues per capita to try to mitigate this concern: we say there is an episode when we observe a large fall in (smoothed) trade tax revenues per capita and look for fiscal recovery of the total tax
revenues per capita variable.12 The results are again very similar to those obtained using
tax data normalized by GDP. The difference between the pre- and post-1970 periods is even stronger as all countries which experience an episode prior to 1970 are observed making a fiscal recovery at some point (web Appendix Tables B.8 and B.14).
Our findings therefore indicate that developing countries are more likely to experience a fiscal cost of trade liberalization, and experience it for longer, than both HICs today and HICs when they were at earlier stages of economic development. This suggests that the fall in tax ratios in these countries over the period 1970-2000 discussed in the introduction can at least partially be explained by the decrease in trade tax revenues. In the next section, we elaborate on the difference between today’s developing countries and the historical experience of rich countries to discuss potential explanations for the fiscal cost of trade liberalization that we observe.
11We take a conservative definition of ‘non pre-empted episodes’ and only keep episodes for which we have data 3 years prior to the episodes and there is no increase in tax revenues before the episode that is at least as big as the episode itself. This leaves us with 86 episodes.
12
We choose a 50% threshold to obtain a number of episodes that is similar (112) to the one obtained using our main definition.
4
Discussion
Why are some countries able to recover the lost tax revenues from liberalizing trade through domestic sources of taxation when others are not? To answer this question one must first understand why trade taxes are such an important tax handle for countries at an early stage of economic development. We have seen that they represent more than 30% of total tax revenues in LICs in the 1970s as well as in today’s HICs in the 1830s. The consensus in the literature is that while the Diamond-Mirrlees production efficiency theorem (?) implies that taxes on international trade are inferior to most forms of domestic taxation (for a review see ?), the former are easier to levy or more ‘revenue-efficient’, to follow the terminology in ?. Optimal tax theory therefore predicts that countries will only tax trade if they cannot raise sufficient revenues through taxes on domestic transactions. This may be the case in developing countries if economies at an early stage of development are intrinsically harder to tax – agriculture is hard to tax, and small firms are less likely to be tax compliant than large firms, as in ?. Alternatively, and following the concepts developed in ??, we can think that developing countries have less fiscal capacity and that less fiscal capacity is needed to levy trade taxes than broader-based domestic taxes: to levy tariffs governments only need to observe a few large transactions that are typically concentrated geographically.
These theories explain the tax transition observed in our data: as countries develop they decrease their revenues from taxes on trade and increase taxation from other sources. They are also consistent with the anecdotal historical evidence on rich countries which suggest that they gradually lowered tariffs once they had developed a fiscal administration which made it possible to raise tax revenues through other means (?). As an example, consider one of the earliest episode we identify, in the United Kingdom in 1842. At this time over a third of the UK’s tax revenues came from export and import duties. Prime minister Robert Peel implemented a large over-the-board decrease in tariffs, and financed the budget overhaul by re-introducing the income tax and mobilizing the country’s modern tax bureaucracy built during the Napoleonic Wars. The extra tax revenue raised was more than expected, allowing for further tariff reforms starting in 1846, the famous repeal of the Corn Laws (?). We observe immediate revenue recovery (no fiscal cost) for this episode.
These theories cannot on the other hand explain why we observe a fiscal cost of trade liberalization. On the contrary they predict that tax ratios will increase when tariffs decrease: as countries become able to shift their tax mix away from inefficient taxes on trade the marginal cost of raising taxes falls leading to an increase in (optimal) tax ratios. To explain the decrease in tax ratios that we observe one has to assume that trade taxes decrease for exogenous – non fiscal – reasons. Governments may wish to enter trade agreements regardless of their potential fiscal costs, or may be pressured to do so by international institutions or large trade partners. ? argue for example that powerful governments often succeed in changing
the tariff policies of their smaller trade partners, a situation that may well characterize the experience of many developing countries since the 1970s. This would have lead them to decrease taxes on trade ‘too early’ from a fiscal perspective, i.e. before they were in a position to increase revenues from domestic sources of taxation.
An alternative explanation is that what we observe is the consequence of an optimal policy change: governments in developing countries may have chosen to simultaneously open up to trade and lower their tax ratios. This seems consistent with the fact that many of our episodes occur during the 1980s and 1990s, a period during which many developing countries implemented structural stabilization plans, often under the auspices of the IMF. Liberalizing trade and lowering government expenditures were often seen as steps towards stabilizing the economy. Government policies that used tariff decreases as a way to both liberalize trade and lower tax ratios could explain the patterns we observe.
We do not attempt to discuss the potential net welfare gain or cost of trade liberalization here. On the one hand, given concerns about corruption levels in developing countries (??) the decrease in tax revenues associated with trade liberalization may be optimal. On the other hand, public finance constraints could explain persistent differences in growth rates across countries (?). We can however document the fiscal cost further by considering government expenditures. A fall in tax revenues can only be thought of as costly if it leads to a decrease in public spending and public spending has a positive impact on welfare. If it is compensated for by an increase in other sources of revenues - development aid or revenues from natural resources - the main potential reason to worry about the fiscal cost of trade liberalization
becomes moot.13 Using our data on government expenditures over GDP we consider whether
(i) government expenditures fall at the start of each episode and (ii) if they do, the number of years before government expenditures come back to their pre-episode level.
Table 7 presents our results regarding the expenditure cost of trade liberalization. We see that the shares of countries that experience an expenditure cost or are never observed to recover are slightly smaller than when we consider tax revenues in most income and period groups, particularly in LICs. This suggests that non-tax sources of public revenues were sometimes found to compensate for the fall in trade taxes. However, the general pattern remains the same: poorer countries are more likely than rich countries to experience a fiscal cost and less likely to recover in five, ten or twenty years. Trade liberalization episodes lead to a fall in government expenditures that is permanent in our data over 25% of the time in developing countries since 1970.
13This is particularly important in the post-1970 period given the importance that the ‘aid for trade’ paradigm has taken during this period. This paradigm advocates poverty alleviation via aid aimed at expanding export opportunities and domestic complementarities to trade (see for example ?).
5
Conclusion
This paper shows that trade liberalization sometimes comes at a fiscal cost. Using a new panel dataset of tax revenues covering 130 developed and developing countries from 1792 to 2006, we characterize 140 episodes of decrease in trade tax revenues and consider the contemporary evolution of total tax revenues to investigate the potential fiscal cost of trade liberalization. We show that in the period since 1970 developing countries are more likely than rich countries to experience a fall in total tax revenues as they decrease trade taxes and less likely to recover the lost tax revenues through other sources of taxation. They are also more likely to experience a fall in total government expenditures. We observe similar episodes of decreases in trade tax revenues in today’s rich countries when they were at earlier level of development in the 19th and early 20th centuries but find that they were less likely to experience a simultaneous decrease in total tax revenues than today’s developing countries and that when they did this decrease was smaller and shorter-lived. Trade liberalization seems to have come at a larger fiscal cost in today’s developing countries, possibly because they decreased taxes on trade before having developed tax administrations capable of taxing domestic transactions on a large scale.
The fiscal cost of opening up to trade experienced by developing countries could be eroding support for further trade liberalization. Trade taxes still represent 3.4% of GDP on average in 2000-2006 in the 30 low-income-countries in our sample, nearly one-fourth of total tax revenues. These are precisely the countries in which the international community calls for increases in domestic revenue mobilization (???). Our findings suggest that increasing these countries’ capacity to tax could weaken one of the reasons they are reluctant to embrace free trade by making governments less dependent on taxes on trade for public revenues.
Figure 1: Evolution of Total and Trade Tax Revenues since 1970 by Level of Development
(a) Total Tax Revenues
0
10
20
30
% GDP
HICs MICs LICs
1970s 1980s 1990s 2000s 1970s 1980s 1990s 2000s 1970s 1980s 1990s 2000s
(b) Trade Tax Revenues
0
2
4
6
% GDP
HICs MICs LICs
1970s 1980s 1990s 2000s 1970s 1980s 1990s 2000s 1970s 1980s 1990s 2000s
Notes: Each bar represents a mean taken over the 29 High Income Countries, 28 Middle Income Countries and 30 Low Income Countries for which data on total and trade tax revenues is available in all decades. Each country is given
Figure 2: Definition of Trade Liberalization Episodes and Fiscal Recovery: Example of Guatemala 0 5 10 R e ve n u e s a s a sh a re o f G D P (% ) 1972 1974 1976 1978 1980 1982 1984 1986 1988 1990 1992 1994 1996 1998 2000 2002 2004 Year
Smoothed trade tax revenues Smoothed tax revenues Trade tax revenues Tax revenues
Notes: The figure illustrates our method for constructing episodes of trade liberalization and the fiscal recovery variable. The vertical red line shows the start of the episode, the blue line its end and the green line the year of recovery. See the text for a description of the dataset used.
T able 1: Ev olu tion of T ax Ratios, T ax Structures and GDP since 1830 b y Lev el of Dev elopmen t HICs MICs LICs (1) (2) (3) (4) (5) (6) (7) (8) (9) T otal tax T rade tax GDP T otal tax T rade tax GDP T otal tax T rade tax GDP 1830-1839 6.6 3.0 1674.5 1860-1869 9.1 1.4 2161.2 1890-1899 8.6 1.9 2334.6 1920-1929 12.7 2.3 3504.6 1 1. 5 2.3 1658.5 1950-1959 16.9 2.0 5702.8 9 .5 2.2 1734.2 1970-1979 22.2 1.6 10754.0 15 .9 4.2 3286.7 15.6 5.9 970.3 2000-2006 27.6 0.6 16219.8 16 .1 2.3 4069.0 14.0 3.1 928.9 Notes: Eac h v alue is a me a n o v er a decade. The table presen ts descriptiv e statistics on total and trade tax rev e n ues as a share of GDP and GDP p e r capita. Coun tries are categorized b y their lev el of economic dev el o pm en t in 2006, see the text for a description of the data and the coun try income groups. Eac h coun try is giv en equal w eigh t in the mean. The n um b er of observ ations in eac h decade from the top to b ottom is (i) HICs: 3, 4,9, 12, 18, 2 5; (ii) MICs: 5, 12, 3 0, 43; (iii) LICs: 30, 40.
T able 2: Ev olut ion of T ax Ratios, T ax Structures and GDP since 1970 b y Lev el of Dev elopmen t, Fixed Sample of Coun tries HICs MICs LICs (1) (2) (3) (4) (5) (6) (7) (8) (9) T otal tax T rade tax GDP T otal tax T rade tax GDP T otal tax T rade tax GDP 1970-1979 22.5 1.6 11016.0 16 .3 4.4 3196.3 15.6 5.9 970.3 1980-1989 25.0 1.1 12741.4 15 .4 3.6 3346.2 15.1 5.3 946.5 1990-1999 28.4 0.6 15430.2 15 .1 2.8 3732.3 13.7 3.9 877.0 2000-2006 31.0 0.4 18272.8 15 .7 2.3 4115.9 14.9 3.4 928.3 Notes: Eac h v alue is a mean o v er a decade. The sample consists of the 29 high-income coun tries, 28 middle-income coun tries a nd 30 lo w -inc o me coun tries for whic h w e ha v e data in all decades. Coun tries are categorized b y their lev el of economic dev elopmen t in 2006, see the text for a description of the coun try income groups. Eac h coun try is giv en equal w eigh t in the mean.
T able 3: Episo des of Decreases in T rade T ax Rev en ues 1792-1969 1970-2006 (1) (2) (3) (4) (5) (6) (7) (8) (9) En tire Sampl e All coun tries HICs MICs LICs All coun tries HICs MICs LICs Size of the episo de (GDP p oin ts) 3.2 2.3 1.9 2.4 2.3 3.5 2.1 3.1 3.8 (2.3) (1.3) (0.9) (1.4) (1.1) (2.5) (1.3) (2.2) (2.7) Length of the episo de (y ears) 12 14 17 15 12 11 13 10 12 (6) (7) (8) (7) (5) (5) (3) (4) (6) T otal tax rev en ues (% GDP) 16.9 14.7 19.7 15.2 11.1 17.7 24.7 18.2 16.9 (7.1) (6.8) (8.2) (6.8) (4.6) (7.0) (10.1) (6.7) (7.0) T rade tax rev en ues (% GDP) 5.5 3.8 3.0 3.7 4.2 6.1 2.6 5.4 6.8 (4.0) (1.6) (0.9) (1.8) (1.4) (4.5) (1.2) (3.6) (5.0) % Pre-empted episo des 6.5 6.5 25.0 4.8 0.0 6.6 100.0 3.6 6.2 (24.8) (25.0) (50.0) (21.8) (0.0) (25.0) (.) (18.9) (24.6) Num b er of episo des 140 38 4 25 9 102 3 44 55 Num b er of coun tries 110 28 2 20 6 82 3 36 43 Num b er of observ ations 5206 1862 178 1152 532 3344 927 1224 1193 Notes: Mean (standard error). The table presen ts descriptiv e statistics on our sample of 140 episo des of decrease in tra de tax rev en ues. T otal a nd trade tax rev en ues are measured a t the start of the episo de. The n um b er of observ ations refers to the n um b er of observ ations in our data set for the p erio d and coun try income gro up under consideration. Column 1 presen ts results for the en tire sample of episo des. In columns 2 to 5 (resp ectiv ely 6 to 9), w e presen t results considering only the p erio d 1792-1969 (resp ectiv ely 1970-2006). HI C s (columns 3 and 7), MICs (columns 4 and 8) and LICs (columns 5 and 9) are defined using the coun try’s income group at the start of the episo de. Episo des are obtained on da ta smo othed using a HP filter with a smo othing parameter of 6.25. Se e the text for a description o f the dataset and the metho d used to construct episo des.
T able 4: Episo des of Decreases in T rade T ax Rev en ues, Changes in T rade P olicy On ly 1792-1969 1970-2006 (1) (2) (3) (4) (5) (6) (7) (8) (9) En tire Sample All coun tries HICs MICs LICs All coun tries HICs MICs LICs Size of the episo de (GDP p oin ts) 3.2 2.4 1.4 2.6 2.2 3.4 2.4 3.1 3.8 (2.3) (1.4) (0.4) (1.5) (0.8) (2.5) (1.7) (2.1) (2.9) Length of the episo de (y ears) 12 15 18 15 12 11 14 10 12 (6) (7) (13) (7) (6) (6) (1) (4) (7) T otal tax rev en ues (% G DP ) 16.7 14.2 16.7 15.2 10.1 17.6 20.3 17.8 17.3 (6.8) (7.0) (12.8) (6.8) (5.3) (6.6) (9.2) (6.1) (7.2) T rade tax rev en ues (% G DP ) 5.4 4.0 2.6 4.1 3.9 5.9 2.4 5.1 7.0 (4.1) (1.6) (0.6) (1.8) (1.0) (4.7) (1.7) (2.7) (6.0) Num b er of episo des 96 27 2 19 6 69 2 34 33 Num b er of coun tries 80 20 0 15 5 60 2 29 29 Notes: Mean (standard erro r). The ta bl e presen ts descriptiv e statistics on the sample of episo des of de crea se in trade ta x rev en ues whic h w e can asso ciate with a change in trade p olicy . T otal and trade tax rev en ues are measur e d at the start of the episo de. Column 1 presen ts results for the en tire sample of episo des. In columns 2 to 5 (resp ectiv ely 6 to 9), w e presen t results considering only the p erio d 1792-1969 (resp ectiv ely 1970-2006). HICs (columns 3 and 7), MICs (columns 4 and 8) and LICs (columns 5 and 9) are defined using the coun tr y income group at the start of the episo de. Episo des are obtained on data smo o thed using a HP filter with a smo othing parameter of 6.25. See the text for a description of the dataset and the metho ds used to construct episo des and determine p oten tial causes of the episo des.
T able 5: The Fiscal Cost of T rade Lib erali z ation 1792-1969 1970-2006 (1) (2) (3) (4) (5) (6) (7) (8) (9) En tire Sampl e All coun tries HICs MICs LICs All coun tries HICs MICs LICs % Episo des with no fall in total tax rev en ues 47.1 55.3 50.0 64.0 33.3 44.1 100.0 47.7 38.2 (50.1) (50.4) (57.7) (49.0) (50.0) (49.9) (0.0) (50.5) (49.0) % Episo des with no fiscal reco v ery 27.9 7.9 0.0 8.0 11.1 35.3 0.0 34.1 38.2 (45.0) (27.3) (0.0) (27.7) (33.3) (48.0) (0.0) (47.9) (49.0) Actual reco v ery time (y ears) 5 7 6 4 16 4 1 4 4 (8) (10) (6) (5) (15) (6) (0) (7) (6) P oten tial reco v ery ti m e (y ears) 21.1 40.0 . 17.0 86.0 19.6 . 16.3 21.9 (13.5) (41.9) (.) (18.4) (.) (8.0) (.) (9.2) (6.3) % Episo des with reco v ery und e r 5 y ears 49.3 56.8 50.0 66.7 33.3 46.5 100.0 48.8 41.8 (50.2) (50.2) (57.7) (48.2) (50.0) (50.1) (0.0) (50.6) (49.8) % Episo des w ith reco v ery und e r 10 y ears 56.6 64.9 75.0 75.0 33.3 53.3 100.0 52.8 50.9 (49.8) (48.4) (50.0) (44.2) (50.0) (50.2) (0.0) (50.6) (50.5) % Episo des w ith reco v ery und e r 20 y ears 66.7 84.4 100.0 95.2 42.9 55.1 100.0 60.0 51.5 (47.4) (36.9) (0.0) (21.8) (53.5) (50.3) (.) (50.7) (50.8) Num b er of episo des 140 38 4 25 9 102 3 44 55 Num b er of coun tries 110 28 2 20 6 82 3 36 43 Notes: Mean (standard err or). The table prese n ts descriptiv e statistics on fiscal reco v ery for all episo des of decreases in trade tax rev en ues. T he n um b er of observ ations refers to the n um b er of observ ations in our data set for the p erio d and coun try income group under consideration. Column 1 presen ts results for the en tire sample of episo d e s. In columns 2 to 5 (resp ectiv ely 6 to 9), w e presen t results considering only the p erio d 17 92-1969 (resp ectiv ely 197 0-2006). H ICs (columns 3 and 7), MICs (columns 4 and 8) and LICs (columns 5 a nd 9) are defined using the coun try income group at the start of the episo de. Episo des are obtained on data smo othed using a HP filter with a smo o thi n g parameter of 6.25. See the text for a description of the dataset and the metho d used to construct episo des.
T able 6: The Fiscal cost of T rad e lib eralization, Changes in T rade P olicy Only 1792-1969 1970-2006 (1) (2) (3) (4) (5) (6) (7) (8) (9) En tire Sampl e All coun tries HICs MICs LICs All coun tries HICs MICs LICs % Episo des with no fall in total tax rev en ues 49.0 59.3 50.0 68.4 33.3 44.9 100.0 50.0 36.4 (50.3) (50.1) (70.7) (47.8) (51.6) (50.1) (0.0) (50.8) (48.9) % Episo des with no fiscal reco v ery 21.9 7.4 0.0 10.5 0.0 27.5 0.0 29.4 27.3 (41.6) (26.7) (0.0) (31.5) (0.0) (45.0) (0.0) (46.2) (45.2) Actual reco v ery time (y ears) 6 8 5 4 19 5 1 4 5 (8) (11) (6) (6) (16) (6) (0) (6) (6) P oten tial reco v ery ti m e (y ears) 17.3 17.0 . 17.0 . 17.3 . 14.0 21.0 (9.6) (18.4) (.) (18.4) (.) (9.1) (.) (10.0) (6.7) % Episo des with reco v ery und e r 5 y ears 52.1 61.5 50.0 72.2 33.3 48.5 100.0 51.5 42.4 (50.2) (49.6) (70.7) (46.1) (51.6) (50.3) (0.0) (50.8) (50.2) % Episo des w ith reco v ery und e r 10 y ears 62.1 69.2 100.0 77.8 33.3 59.0 100.0 59.3 56.2 (48.8) (47.1) (0.0) (42.8) (51.6) (49.6) (0.0) (50.1) (50.4) % Episo des w ith reco v ery und e r 20 y ears 74.0 84.0 100.0 94.1 50.0 64.0 . 70.0 60.0 (44.3) (37.4) (0.0) (24.3) (54.8) (49.0) (.) (48.3) (50.7) Num b er of episo des 96 27 2 19 6 69 2 34 33 Num b er of coun tries 80 20 0 15 5 60 2 29 29 Notes: Mean (standard error). The table presen ts descriptiv e statistics on fiscal reco v e ry for all episo des of decreases in tra de tax rev e n ues whic h w e can asso ciate with changes in trade p olicy . In columns 2 to 5 (resp ectiv ely 6 to 9), w e presen t results considering only the p erio d 1792-1969 (resp ectiv ely 1970-2006). HI C s (columns 3 and 7), MICs (columns 4 and 8) and LICs (columns 5 and 9) are defined using the coun try income group at the sta rt of the episo de. Episo des are obtained on data smo othed using a HP filter with a smo othing parameter of 6.25. See the text for a description of the data se t and the metho ds used to construct episo des and determine p oten tial causes o f the episo des.
T able 7: The Fiscal Cost of T rade Lib e ral iz ati on: Go v ernmen t Exp end itures Reco v ery 1792-1969 1970-2006 (1) (2) (3) (4) (5) (6) (7) (8) (9) En tire Sample All coun tries HICs MICs LICs All coun tries HICs MICs LICs % Episo des with no fall in exp enditures 55.7 68.4 75.0 76.0 44.4 51.0 66.7 47.7 52.7 (49.9) (47.1) (50.0) (43.6) (52.7) (50.2) (57.7) (50.5) (50.4) % Episo des with no exp enditure reco v ery 23.57 2.63 0.00 4.00 0.00 31.37 0.00 43.18 23.64 (42.60) (16.22) (0.00) (20.00) (0.00) (46.63) (0.00) (50.11) (42.88) Actual reco v ery time (y ears) 4 6 2 4 12 3 3 3 3 (8) (12) (3) (11) (13) (5) (3) (7) (4) P oten tial reco v ery time (y ears) 18.7 14.0 . 14.0 . 18.8 . 16.7 22.0 (7.8) (.) (.) (.) (.) (7.9) (.) (8.8) (5.1) % Episo des with reco v ery und e r 5 y ears 59.4 73.0 75.0 83.3 44.4 54.5 66.7 51.2 56.4 (49.3) (45.0) (50.0) (38.1) (52.7) (50.0) (57.7) (50.6) (50.1) % Episo des with reco v ery und e r 10 y ears 67.4 78.4 100.0 83.3 55.6 63.0 100.0 52.8 67.9 (47.0) (41.7) (0.0) (38.1) (52.7) (48.5) (0.0) (50.6) (47.1) % Episo des with reco v ery und e r 20 y ears 79.0 87.5 100.0 95.2 57.1 73.5 100.0 60.0 78.8 (41.0) (33.6) (0.0) (21.8) (53.5) (44.6) (.) (50.7) (41.5) Num b er of episo des 140 38 4 25 9 102 3 44 55 Num b er of coun tries 110 28 2 20 6 82 3 36 43 Notes: Mean (standard error). The table presen ts desc ri ptiv e statistics on exp enditure reco v ery for all episo des of de crea se s in trade tax rev en ues. The n um b er of observ ations refers to the n um b er of observ ations in our data set for the p erio d and coun try income group under consideration. Column 1 presen ts results for the en tire sample of epis o des. In columns 2 to 5 (resp ectiv ely 6 to 9), w e presen t results considering only the p erio d 1792-1969 (resp ectiv ely 197 0-2006). HICs (columns 3 and 7 ), M ICs (columns 4 and 8) and LICs (columns 5 and 9) are defined using the coun try income group at the start of the episo de. Episo des are obtained on data smo othed usi n g a HP filter with a smo othing parameter of 6.25. See the text for a description of the data se t and the metho d used to construct episo des.