Publisher’s version / Version de l'éditeur:
Vous avez des questions? Nous pouvons vous aider. Pour communiquer directement avec un auteur, consultez la
première page de la revue dans laquelle son article a été publié afin de trouver ses coordonnées. Si vous n’arrivez
Questions? Contact the NRC Publications Archive team at
PublicationsArchive-ArchivesPublications@nrc-cnrc.gc.ca. If you wish to email the authors directly, please see the first page of the publication for their contact information.
https://publications-cnrc.canada.ca/fra/droits
L’accès à ce site Web et l’utilisation de son contenu sont assujettis aux conditions présentées dans le site LISEZ CES CONDITIONS ATTENTIVEMENT AVANT D’UTILISER CE SITE WEB.
PLoS ONE, 10, 8, 2015-08-12
READ THESE TERMS AND CONDITIONS CAREFULLY BEFORE USING THIS WEBSITE.
https://nrc-publications.canada.ca/eng/copyright
NRC Publications Archive Record / Notice des Archives des publications du CNRC : https://nrc-publications.canada.ca/eng/view/object/?id=c20377fb-772e-41ed-8818-3299e3f7a33c https://publications-cnrc.canada.ca/fra/voir/objet/?id=c20377fb-772e-41ed-8818-3299e3f7a33c
Archives des publications du CNRC
This publication could be one of several versions: author’s original, accepted manuscript or the publisher’s version. / La version de cette publication peut être l’une des suivantes : la version prépublication de l’auteur, la version acceptée du manuscrit ou la version de l’éditeur.
For the publisher’s version, please access the DOI link below./ Pour consulter la version de l’éditeur, utilisez le lien DOI ci-dessous.
https://doi.org/10.1371/journal.pone.0135620
Access and use of this website and the material on it are subject to the Terms and Conditions set forth at
A study of the vaginal microbiome in healthy Canadian women utilizing
cpn60-based molecular profiling reveals distinct Gardnerella subgroup
community state types
Albert, Arianne Y. K.; Chaban, Bonnie; Wagner, Emily C.; Schellenberg,
John J.; Links, Matthew G.; Van Schalkwyk, Julie; Reid, Gregor;
A Study of the Vaginal Microbiome in
Healthy Canadian Women Utilizing
cpn60-Based Molecular Profiling Reveals Distinct
Gardnerella
Subgroup Community State
Types
Arianne Y. K. Albert1☯, Bonnie Chaban2,8☯, Emily C. Wagner1, John J. Schellenberg2, Matthew G. Links2,3, Julie van Schalkwyk1,4, Gregor Reid5, Sean M. Hemmingsen6,7, Janet E. Hill2, Deborah Money1,4*, VOGUE Research Group
1Women’s Health Research Institute, Vancouver, BC, Canada, 2 Department of Veterinary Microbiology, University of Saskatchewan, Saskatoon, SK, Canada, 3 Agriculture and AgriFood Canada, Saskatoon, SK, Canada, 4 Department of Obstetrics and Gynaecology, University of British Columbia, Vancouver, BC, Canada, 5 Department of Microbiology and Immunology, University of Western Ontario and Lawson Health Research Institute, London, ON, Canada, 6 National Research Council Canada, Saskatoon, SK, Canada, 7Department of Microbiology & Immunology, University of Saskatchewan, Saskatoon, SK, Canada, 8Faculty of Natural Sciences, Department of Life Sciences, Imperial College London, South Kensington Campus, London, United Kingdom
☯ These authors contributed equally to this work.
¶ Membership of the VOGUE Research Group is provided in the Acknowledgements *dmoney@cw.bc.ca
Abstract
The vaginal microbiota is important in women’s reproductive and overall health. However, the relationships between the structure, function and dynamics of this complex microbial community and health outcomes remain elusive. The objective of this study was to deter-mine the phylogenetic range and abundance of prokaryotes in the vaginal microbiota of healthy, non-pregnant, ethnically diverse, reproductive-aged Canadian women. Socio-demographic, behavioural and clinical data were collected and vaginal swabs were ana-lyzed from 310 women. Detailed profiles of their vaginal microbiomes were generated by pyrosequencing of the chaperonin-60 universal target. Six community state types (CST) were delineated by hierarchical clustering, including three Lactobacillus-dominated CST (L. crispatus, L. iners, L. jensenii), two Gardnerella-dominated (subgroups A and C) and an “intermediate” CST which included a small number of women with microbiomes dominated by seven other species or with no dominant species but minority populations of Streptococ-cus, StaphylococStreptococ-cus, Peptoniphilus, E. coli and various Proteobacteria in co-dominant communities. The striking correspondence between Nugent score and deep sequencing CST continues to reinforce the basic premise provided by the simpler Gram stain method, while additional analyses reveal detailed cpn60-based phylogeny and estimated abun-dance in microbial communities from vaginal samples. Ethnicity was the only demographic or clinical characteristic predicting CST, with differences in Asian and White women a11111
OPEN ACCESS
Citation: Albert AYK, Chaban B, Wagner EC, Schellenberg JJ, Links MG, van Schalkwyk J, et al. (2015) A Study of the Vaginal Microbiome in Healthy Canadian Women Utilizing cpn60-Based Molecular Profiling Reveals Distinct Gardnerella Subgroup Community State Types. PLoS ONE 10(8): e0135620. doi:10.1371/journal.pone.0135620 Editor: David N Fredricks, Fred Hutchinson Cancer Center, UNITED STATES
Received: May 27, 2015 Accepted: July 24, 2015 Published: August 12, 2015
Copyright: © 2015 Albert et al. This is an open access article distributed under the terms of the
Creative Commons Attribution License, which permits unrestricted use, distribution, and reproduction in any medium, provided the original author and source are credited.
Data Availability Statement: Due to ethical and legal restrictions related to protecting participant privacy imposed by the University of British Columbia Ethics Board, all relevant data are available upon request pending ethical approval. Please submit all requests to initiate the data access process to the corresponding author.
Funding: Financial support for this study was provided by a joint Canadian Institutes of Health Research (CIHR) Emerging Team Grant and a Genome British Columbia (GBC) grant awarded to
(p = 0.05). In conclusion, this study confirms previous work describing four cpn60-based subgroups of Gardnerella, revealing previously undescribed CST. The data describe the range of bacterial communities seen in Canadian women presenting with no specific vaginal health concerns, and provides an important baseline for future investigations of clinically important cohorts.
Introduction
The microorganisms that inhabit the human body, the microbiota, are an integral component of an individual’s health. Within the female reproductive tract, the resident vaginal microbiota play an important protectiv e role by interfering with the proliferation of organisms that cause vulvo-vaginal, urinary tract and sexually transmitted infections [1–5]. A healthy vaginal micro-bial community is generally defined as being dominated by Lactobacillus species, many of which produce acid, hydrogen peroxide, biosurfactants and bacteriocins antagonistic to patho-gens [6–11]. Although the relationship between vaginal microbiology and adverse clinical symptoms (such as odour and discharge) is not well understood, women with a high diversity of anaerobic bacteria in communities dominated by organisms other than Lactobacillus, are generally considered to have a condition called bacterial vaginosis (BV). However, research especially on microbiota of asymptomatic women who meet the microbiological criteria of BV has expanded our understanding of the microbial constituents of the vagina [12–14].
High-throughput, culture-independent technologies have allowed investigation of the vagi-nal microbiome on a much larger scale and with unprecedented taxonomic resolution. To date, several research groups have surveyed the vaginal microbiomes of women from around the world in both cross-sectional [15–26] and longitudinal studies [27–33]. While methodologies and study cohorts vary considerably, the common finding from these studies has been that vag-inal microbiota generally exist in one of a limited number of community configurations. These configurations have been termed “community state types” (CST) [17,18,27], with the most widely accepted typing scheme proposed by Ravel et al. [18], describing six CST depending on the dominant organisms present. CST I, II, III and V are Lactobacillus-dominated communi-ties, composed primarily of L. crispatus, L. gasseri, L. iners or L. jensenii, respectively. CST IV was described initially as a heterogeneous group of non-lactobacilli [18] and has since been divided into two subgroups: IVA, consisting primarily of Bifidobacterium, Dialister, Streptococ-cus, and Bacteroides, and IVB containing more Gardnerella, Prevotella, Megasphaera, bacterial vaginosis-associated bacteria (BVAB), and Mobiluncus [27]. Other less frequently described vaginal CST include those where two Lactobacillus species co-dominate (such as L. crispatus/L. iners or L. crispatus/L. jensenii) or study-specific versions of the heterogeneous, non-lactobacilli CST IV [15–17,19].
In addition to a growing consensus regarding the most commonly observed CST, an expanding list of individual factors and behaviours have been associated with particular CST or with women changing from a Lactobacillus-dominated CST to one associated with BV or vice versa. Profiles of vaginal microbiota have been reported to be associated with race/ethnicity [15,18], level of education [34], use of hormonal contraceptives [35,36], use of feminine hygiene products [37], gender of sexual partners [35,38], number of sexual partners [39], con-dom use [35,39], sexual behaviours [39] and smoking [38]. Some factors, such as level of edu-cation, most likely represent a composite variable of numerous factors associated with differences in the vaginal microbiota, including race/ethnicity, sexual behaviour and
DM, SMH, GR and JEH (grant reference #108030). The funders had no role in study design, data collection and analysis, decision to publish, or preparation of the manuscript.
Competing Interests: The authors have declared that no competing interests exist.
socioeconomic class [34]. Given the complex and interconnected nature of many of these fac-tors, more research is needed with diverse cohorts of women to help clarify and understand how they contribute to the composition and dynamics of the vaginal microbiota.
In this study, phylogenetic profiles of vaginal microbiota were generated by massively paral-lel sequencing of the universal target (UT) from the cpn60 gene. This target has been shown to provide comparable information to the 16S rRNA gene in terms of community coverage [21] but provide better discrimination of species and subspecies [40–43], increased coverage of Bifi-dobacteriales [44,45] and detection of eukaryotic microbes [46]. This resolution is critical, par-ticularly for the vaginal microbiome, given recent evidence that the species Gardnerella vaginalis is actually comprised of four genotypically and phenotypically distinct subgroups, easily distinguished by variation in cpn60 UT sequences [47–49]. However, it is a recognized limitation of cpn60 that some Mollicutes, notably some species of Mycoplasma and Urea-plasma, lack this gene target. Given the established importance of these species in the vaginal microbiome, specific PCR assays were included in this study to estimate prevalence of these organisms. Finally, an estimate of total bacterial population density was generated using a 16S rRNA targeted quantitative PCR. The combination of cpn60 microbial profiling with targeted additional assays ensured complete microbiome profiling consistent with the largest 16S rRNA gene studies, but at a finer resolution with consequently increased phylogenetic detail.
The primary objective for this study was to define the range of vaginal microbiota profiles common in non-pregnant Canadian women of reproductive age without specific vaginal health concerns, in relation to socio-demographic, behavioural and clinical characteristics. In addition to our results broadly confirming previous studies in terms of the most commonly observed Lactobacillus-dominated CST in healthy women, they provide important phyloge-netic insight into non-Lactobacillus-dominated CST based on distinct cpn60-based Gardnerella subgroups.
Materials and Methods
Ethics statement
This study received ethical approval from the University of British Columbia Children’s & Women’s Research Ethics Board (certificate no. H10-02535).
Participants and study design
Healthy, reproductive-aged women aged 18–49 years were recruited from the greater Vancou-ver area of British Columbia, Canada, through research clinics, primary care offices, and online and print advertisements. Women were eligible to participate if the following inclusion criteria were met: between the ages of 18–49 and premenopausal (e.g. reported having a menstrual cycle over the previous 12 months), not pregnant, HIV negative, and had not used any oral or intravaginal antibiotic or antifungal treatments in the four weeks prior to the study visit (antivi-ral medications, e.g. valacyclovir for suppression of HSV infection, were permitted). After obtaining written informed consent, research staff collected demographic and clinical data from the participants via interview and by reviewing medical charts. Two vaginal swab samples were collected for Gram stain assessment and sequencing analysis, either by a clinician during an indicated speculum examination (i.e. routine pap smear screening), or by a study nurse con-ducting a speculum examination for study purposes, or using a validated self-collection method [28]. Amies gel transport swabs without charcoal (Stevens Company Ltd., Brampton, ON) were used to collect samples for Gram stain assessment, and dry Dacron swabs (Copan Diag-nostics Inc., Murrieta, CA) were used to collect samples for sequencing analyses.
Samples collected for Gram stain assessment were processed within 48 h at the clinical labo-ratory for BC Women’s Hospital and Health Centre utilizing validated Nugent’s scoring meth-odology [50].
Samples collected for sequencing analyses were transferred to -80°C storage within 30 min-utes, with the exception of those collected in community-based clinics, in which case, they were stored at 4°C for a maximum of 12 hours prior to transfer to -80°C. Total nucleic acid was extracted from batches of swabs using the MagMAX Total Nucleic Acid Isolation Kit (Applied Biosystems, Life Technologies, Burlington, ON, Canada) as per manufacturer’s instructions. To minimize opportunities for cross contamination between samples, small batches were pro-cessed. In addition, a negative control sample (sterile water) was run with each kit and tested with the subsequent cpn60 PCR to ensure no PCR product was generated.
Quantitative PCR (qPCR) and conventional PCR
Samples were quantified for total bacterial DNA with a SYBR Green assay targeting the 16S rRNA gene (V3 region) as described previously [51]. Mollicutes (Mycoplasma and/or Urea-plasma) were detected by genus-specific, conventional semi-nested PCR targeting the 16S rRNA gene [52]. The primary PCR targeted a 700 bp portion of the 16S rRNA gene using prim-ers GPO-1 and MGSO [52]. PCR was performed under the following conditions: 40 cycles of 94°C for 30 s, 64°C for 30 s, and 72°C for 60 s. The secondary PCR used primers My-ins [53] and MGSO, and 2 μl of the primary PCR product as template. Thermocycling parameters included 35 cycles of 94°C for 30 s, 60°C for 30 s, and 72°C for 60 s. Ureaplasma species (U. parvum and U. urealyticum) were detected using a conventional PCR based on the multi-ple-banded antigen gene with primers UMS-125 and UMA226, which yield products of two different sizes depending on the target species: 403 bp (Ureaplasma parvum) or 443 bp (Urea-plasma urealyticum) [54,55]. Representative PCR products (several products of each size gen-erated) were sequenced and confirmed to the expected target sequence. Every PCR assay contained a no template control (NTC) reaction containing all the PCR components without added template DNA and had to generate no signal (qPCR) or product (conventional PCR) for the assay to be valid.
cpn60 universal target (UT) PCR and pyrosequencing
Generation of cpn60 PCR amplicon libraries for microbial profiling of vaginal samples was car-ried out as previously described [28]. cpn60 UT-specific primer sets [44,56] were modified at the 5' end with a unique decamer multiplexing identification (MID) sequences. Amplicons were pooled in equimolar concentrations to create libraries for sequencing on the GS Junior platform as per the manufacturer’s recommendations (Roche/454, Brandford, CT, USA).
Analysis of operational taxonomic units (OTU)
Sequence data were processed as previously described with minor modifications [28], using the default on-rig procedures from 454/Roche, which include confirmation of key sequence and trimming for quality. To classify experimental data, MID-partitioned reads were mapped using Bowtie 2 (http://bowtie-bio.sourceforge.net/bowtie2/) on to a previously created, manually curated reference set of 1,561 OTU sequences generated by assembly of cpn60 sequence reads from each of 546 vaginal microbiome samples from non-pregnant and pregnant Canadian women of reproductive age. The reference assembly was created by the microbial Profiling Using Metagenomic Assembly pipeline (mPUMA,http://mpuma.sourceforge.net)[57] with Trinity as the assembly tool [58]. Assembled OTU (> 150 bp) were identified and labeled according to their nearest reference sequence determined by watered-Blast comparison [21] to
the cpn60 reference database, cpnDB_nr_vag (downloaded on September 18, 2014 fromhttp:// www.cpndb.ca, [59]). OTU having less than 55% identity to any reference sequence were con-sidered to be non-cpn60 sequences and removed from the data set [60]. This reference assem-bly strategy facilitates comparison of microbiome profiles from various cohorts under study, including the 310 women described in this sub-study. Raw sequence data files for the 310 sam-ples described in this study were deposited to the NCBI Sequence Read Archive (Accession SRP056439, BioProject PRJNA278895).
Statistical analysis
All analyses were carried out in R v3.1.1 (R Core Team 2014). We restricted the pool of OTU to those having a total of at least 20 reads across all samples. A Jensen-Shannon distance matrix was calculated using the ‘vegdist’ function in the vegan package [61], with a custom distance function that calculates the square root of the Jensen-Shannon divergence [62]. This distance matrix was used for hierarchical clustering using the ‘hclust’ function in R, with Ward linkage.
Several internal cluster validation metrics were assessed [63], including average silhouette width [64], average Pearson gamma [65] and Dunn index [66], as calculated by the ‘cluster. stats’ function in the fpc package [67]. The Pearson gamma index measures the correlation between distances and a vector of 0s and 1s where 0 indicates the same cluster, 1 indicates a dif-ferent cluster and higher values indicate better fit to the data [65]. The optimal cluster number was validated using a bootstrapping technique, as implemented by the ‘clusterboot’ function in the fpc package, with 500 bootstrap replicates for each of 5, 6, 7, 8, 9 and 10 clusters. Once the optimal number of clusters was determined, taxonomic composition was compared to previ-ously published CST [18,27]. Relationships between cluster membership and the variables listed inTable 1were assessed using Fisher exact tests. All p-values were corrected for multiple testing using the Benjamini-Hochberg method with a false discovery rate of 0.05 [68]. Principal coordinates analysis from all the OTU in the dataset were calculated from Bray-Curtis dissimi-larity values as the mean value of 100 subsampling of 1000 reads (or all reads available when less than 1000) in QIIME with the jackknifed_beta_diversity.py command [69].
Variation in OTU abundance according to Nugent score and clinical/demographic variables was assessed using center log ratio transformations in ALDEx2 (v2.0.7.2), an algorithm for compositional analysis that uses a Dirichlet-multinomial model to infer relative abundances from counts [70]. Expected p-values for Kruskal-Wallis tests of differences among clinical data categories were determined using 128 Monte Carlo runs. A false discovery rate of 0.05 was applied using the Benjamini-Hochberg correction and adjusted p-values are reported [71]. Shannon diversity and Chao1 estimated species richness were calculated as the mean of 100 subsampling of 1000 reads (or all reads available when less than 1000) in QIIME with the mul-tiple_rarefactions.py, alpha_diversity.py and collate_alpha.py commands [69]. These were compared to CST and clinical/demographic variables using linear models for Shannon diver-sity and Poisson regressions for Chao1 richness estimates. Significance was assessed using like-lihood-ratio tests with p-values corrected for multiple testing using the Benjamini-Hochberg method as above.
Phylogenetic analysis
For abundance tree analysis, 164 full-length cpn60 UT sequences that are nearest neighbours for all OTU with abundance exceeding 1% of total reads in at least a single individual were aligned using ClustalW with gap opening/gap extension penalties of 10/0.2 and phylogenetic trees constructed by neighbour-joining with 100 bootstrap iterations in MEGA v6 (www. megasoftware.net) [72]. Proportions of total reads for subgroups of women were represented
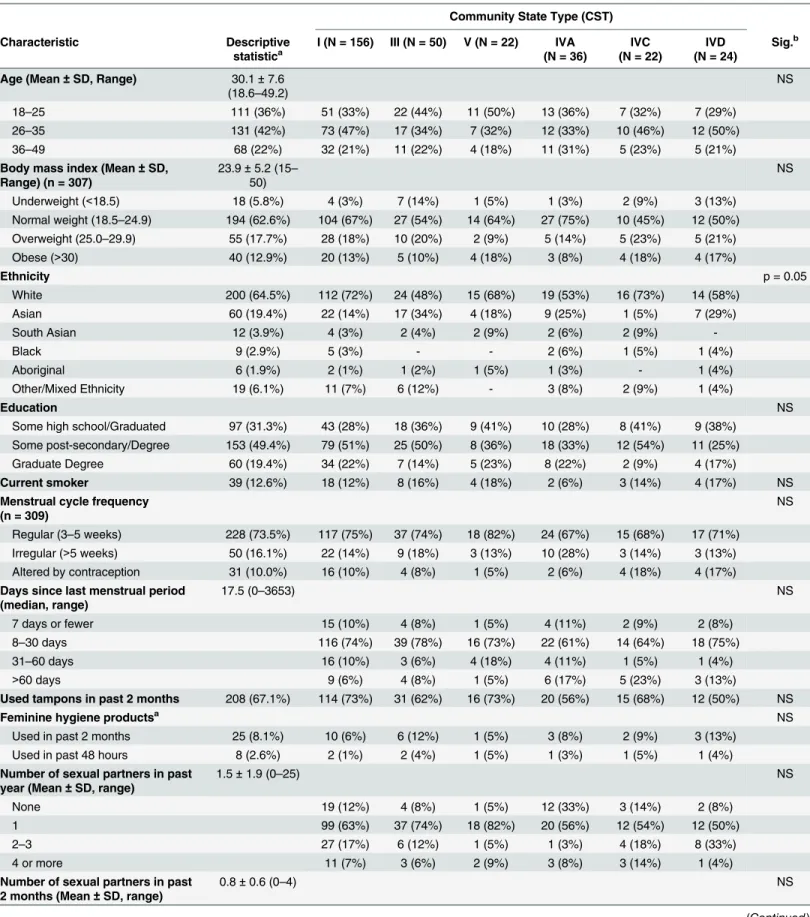
Table 1. Sociodemographic, clinical and microbiological characteristics in relation to community state type (CST). Community State Type (CST) Characteristic Descriptive statistica I (N = 156) III (N = 50) V (N = 22) IVA (N = 36) IVC (N = 22) IVD (N = 24) Sig.b
Age (Mean ± SD, Range) 30.1 ± 7.6 (18.6–49.2)
NS
18–25 111 (36%) 51 (33%) 22 (44%) 11 (50%) 13 (36%) 7 (32%) 7 (29%) 26–35 131 (42%) 73 (47%) 17 (34%) 7 (32%) 12 (33%) 10 (46%) 12 (50%) 36–49 68 (22%) 32 (21%) 11 (22%) 4 (18%) 11 (31%) 5 (23%) 5 (21%) Body mass index (Mean ± SD,
Range) (n = 307) 23.9 ± 5.2 (15– 50) NS Underweight (<18.5) 18 (5.8%) 4 (3%) 7 (14%) 1 (5%) 1 (3%) 2 (9%) 3 (13%) Normal weight (18.5–24.9) 194 (62.6%) 104 (67%) 27 (54%) 14 (64%) 27 (75%) 10 (45%) 12 (50%) Overweight (25.0–29.9) 55 (17.7%) 28 (18%) 10 (20%) 2 (9%) 5 (14%) 5 (23%) 5 (21%) Obese (>30) 40 (12.9%) 20 (13%) 5 (10%) 4 (18%) 3 (8%) 4 (18%) 4 (17%) Ethnicity p = 0.05 White 200 (64.5%) 112 (72%) 24 (48%) 15 (68%) 19 (53%) 16 (73%) 14 (58%) Asian 60 (19.4%) 22 (14%) 17 (34%) 4 (18%) 9 (25%) 1 (5%) 7 (29%) South Asian 12 (3.9%) 4 (3%) 2 (4%) 2 (9%) 2 (6%) 2 (9%) -Black 9 (2.9%) 5 (3%) - - 2 (6%) 1 (5%) 1 (4%) Aboriginal 6 (1.9%) 2 (1%) 1 (2%) 1 (5%) 1 (3%) - 1 (4%) Other/Mixed Ethnicity 19 (6.1%) 11 (7%) 6 (12%) - 3 (8%) 2 (9%) 1 (4%) Education NS
Some high school/Graduated 97 (31.3%) 43 (28%) 18 (36%) 9 (41%) 10 (28%) 8 (41%) 9 (38%) Some post-secondary/Degree 153 (49.4%) 79 (51%) 25 (50%) 8 (36%) 18 (33%) 12 (54%) 11 (25%) Graduate Degree 60 (19.4%) 34 (22%) 7 (14%) 5 (23%) 8 (22%) 2 (9%) 4 (17%)
Current smoker 39 (12.6%) 18 (12%) 8 (16%) 4 (18%) 2 (6%) 3 (14%) 4 (17%) NS Menstrual cycle frequency
(n = 309)
NS
Regular (3–5 weeks) 228 (73.5%) 117 (75%) 37 (74%) 18 (82%) 24 (67%) 15 (68%) 17 (71%) Irregular (>5 weeks) 50 (16.1%) 22 (14%) 9 (18%) 3 (13%) 10 (28%) 3 (14%) 3 (13%) Altered by contraception 31 (10.0%) 16 (10%) 4 (8%) 1 (5%) 2 (6%) 4 (18%) 4 (17%) Days since last menstrual period
(median, range) 17.5 (0–3653) NS 7 days or fewer 15 (10%) 4 (8%) 1 (5%) 4 (11%) 2 (9%) 2 (8%) 8–30 days 116 (74%) 39 (78%) 16 (73%) 22 (61%) 14 (64%) 18 (75%) 31–60 days 16 (10%) 3 (6%) 4 (18%) 4 (11%) 1 (5%) 1 (4%) >60 days 9 (6%) 4 (8%) 1 (5%) 6 (17%) 5 (23%) 3 (13%)
Used tampons in past 2 months 208 (67.1%) 114 (73%) 31 (62%) 16 (73%) 20 (56%) 15 (68%) 12 (50%) NS
Feminine hygiene productsa NS
Used in past 2 months 25 (8.1%) 10 (6%) 6 (12%) 1 (5%) 3 (8%) 2 (9%) 3 (13%) Used in past 48 hours 8 (2.6%) 2 (1%) 2 (4%) 1 (5%) 1 (3%) 1 (5%) 1 (4%) Number of sexual partners in past
year (Mean ± SD, range)
1.5 ± 1.9 (0–25) NS
None 19 (12%) 4 (8%) 1 (5%) 12 (33%) 3 (14%) 2 (8%) 1 99 (63%) 37 (74%) 18 (82%) 20 (56%) 12 (54%) 12 (50%) 2–3 27 (17%) 6 (12%) 1 (5%) 1 (3%) 4 (18%) 8 (33%) 4 or more 11 (7%) 3 (6%) 2 (9%) 3 (8%) 3 (14%) 1 (4%) Number of sexual partners in past
2 months (Mean ± SD, range)
0.8 ± 0.6 (0–4) NS
Table 1. (Continued)
Community State Type (CST) Characteristic Descriptive statistica I (N = 156) III (N = 50) V (N = 22) IVA (N = 36) IVC (N = 22) IVD (N = 24) Sig.b None 37 (23%) 10 (20%) 2 (9%) 15 (42%) 8 (41%) 6 (25%) 1 114 (73%) 38 (76%) 19 (86%) 21 (58%) 12 (50%) 17 (71%) 2 or more 5 (3%) 2 (4%) 1 (5%) - 2 (9%)
-Vaginal intercourse in past month 222 (71.6%) 113 (72%) 39 (78%) 20 (91%) 21 (58%) 13 (59%) 16 (67%) NS Used condoms 122 (39.4%) 63 (40%) 22 (44%) 9 (46%) 15 (42%) 7 (32%) 6 (25%)
Vaginal intercourse in past 48 h 44 (14.2%) 17 (11%) 10 (20%) 5 (23%) 5 (14%) 3 (14%) 4 (17%) NS Used condoms 21 (6.8%) 8 (5%) 5 (10%) 2 (9%) 4 (11%) 1 (5%) 1 (4%)
Contraceptive use NS
Combined Estrogen/Progestinb 89 (28.7%) 44 (28%) 16 (32%) 10 (45%) 6 (17%) 4 (18%) 9 (38%)
Progestin-basedc 37 (11.9%) 18 (12%) 4 (8%) 2 (9%) 4 (11%) 5 (23%) 4 (17%) Copper IUD 21 (6.8%) 9 (6%) 6 (12%) 2 (9%) - 3 (14%) 1 (4%) Lifetime history of sexually
transmitted infection(s) 52 (16.8%) 29 (19%) 8 (16%) 3 (13%) 3 (8%) 2 (9%) 7 (29%) NS Chlamydia 22 (7.1%) 11 (7%) 2 (4%) 2 (9%) 2 (6%) 1 (5%) 4 (17%) Gonorrhoea 4 (1.3%) 1 (1%) - - 1 (3%) 1 (5%) 1 (4%) Genital Herpes (HSV) 12 (3.9%) 7 (4%) 3 (6%) - 1 (3%) - 1 (4%) Genital Warts (HPV) 21 (6.8) 12 (8%) 3 (6%) 2 (9%) 1 (3%) 1 (5%) 2 (8%) Self-reported vaginal symptomsd
(n = 305)
NS
In past two weeks 41 (13.2%) 20 (13%) 3 (6%) 5 (23%) 6 (17%) 3 (14%) 4 (17%) In past 48 hours 24 (7.7%) 9 (6%) 3 (6%) 3 (13%) 4 (11%) 2 (9%) 3 (13%)
Nugent category (n = 307) p<0.0001
Not consistent with BV (0–3) 250 (80.6%) 151 (97%) 45 (90%) 21 (42%) 22 (61%) 7 (32%) 4 (17%) Intermediate BV (4–6) 25 (8.1%) 4 (3%) 3 (6%) 1 (5%) 10 (28%) 3 (14%) 4 (17%) Consistent with BV (7–10) 32 (10.3%) - - - 4 (11%) 12 (50%) 16 (67%) Estimated bacterial load (total
copies of 16S rRNA gene)
NS 104or less 24 (15%) 7 (14%) 3 (13%) 8 (22%) 2 (9%) 4 (17%) 105 −106 50 (32%) 19 (38%) 5 (23%) 9 (25%) 5 (23%) 9 (38%) 107 −108 78 (50%) 23 (46%) 14 (64%) 16 (44%) 11 (50%) 4 (17%) 109or more 4 (3%) 1 (2%) - 3 (8%) 4 (18%) 7 (29%) Presence of Mollicutes 217 (70%) 106 (68%) 35 (70%) 13 (59%) 27 (75%) 19 (86%) 17 (71%) NS Presence of Ureaplasma 149 (48%) NS U. parvum 64 (41%) 21 (42%) 8 (36%) 13 (36%) 10 (45%) 11 (25%) U. urealyticum 7 (4%) 4 (8%) - 3 (8%) 3 (14%) 4 (17%) Both - - - 1 (3%) -
-Shannon diversity (Mean ± SD) 1.68 ± 1.14 1.32 ± 1.00 1.65 ± 0.95 1.76 ± 0.91 2.49 ± 1.62 2.15 ± 0.74 2.31 ± 0.91 p<0.0001 Chao1 richness (Mean ± SD) 48 ± 26 45 ± 29 50 ± 21 44 ± 19 58 ± 33 45 ± 15 49 ± 16 NS
aContinuous variables are reported as means ± 95% CI (range). Categoric variables are reported as N (%). bp value is shown for significant relationships. NS = not significant.
as circles whose combined area is equal to 100% of all reads for that subgroup, as previously described [22]. Each subgroup of women is represented as a different colour based on Nugent score or CST, with all individual libraries normalized to the same total read count.
Results
Cohort description
Five hundred and thirty-four women were initially recruited, referred, or contacted the study coordinating centre to participate in the study. Potential participants were provided with detailed information about the study and screened to ensure they met eligibility criteria, result-ing in 320 women who attended study visits and consented to participate. Ten women were excluded post-enrollment due to erroneous assessment of exclusion criteria, inability to pro-vide vaginal samples, or laboratory errors (e.g. lost/missing samples, improper storage of sam-ples), resulting in total sample size of 310 women.
The average age of participants was 30 (Table 1). The majority of women had been sexually active and reported a history of predominantly heterosexual relationships, but some had bisex-ual and same sex partnerships. Of those who had been sexbisex-ually active, most had been sexbisex-ually active during the past year, with the number of partners ranging from 1–25. The ethnicity dis-tribution of our study population was diverse and representative of Canadian populations from the White, Asian, Black, Aboriginal and Hispanic communities according to 2006 census data [73]. A subgroup of women (n = 24 or 7.7%) who self-identified as not having specific vag-inal health issues reported vagvag-inal symptoms (odour, abnormal discharge, and/or irritation) within 48 hours prior to of sample collection (Table 1). The majority of women had Nugent scores not consistent with BV (BV-, i.e. Lactobacillus morphotype-dominant); however, many women (57/310 or 18.4%) had Nugent scores categorized as BV-intermediate (BVI) or consis-tent with BV (BV+).
Vaginal microbiome profiling
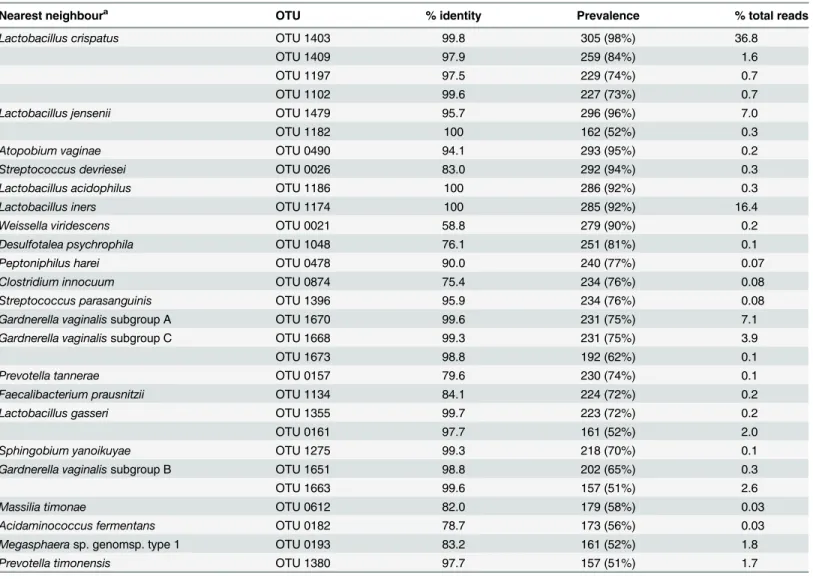
A total of 3,114,714 cpn60 reads were included in the analysis, and were mapped on to 1,437 unique OTU in the reference assembly (S1 Table). The average sequence read count was 10,047 per sample, with a median of 6,167 (range 195–120,487). Only 30 OTU were detected in at least 50% of women sampled (Table 2). The most prevalent and abundant OTU was OTU 1403: L. crispatus (99.8% identity), which was detected in 305/310 (98.4%) women and made up 36.75% of all reads. Interestingly, of the six additional OTU prevalent in over 90% of women, only OTU 1174: L. iners (100% identity) and OTU 1479: L. jensenii (95.7% identity) made up a significant proportion of the total reads (16.33% and 6.93%, respectively). The other four prevalent OTU, OTU 0490: Atopobium vaginae (94.1% identity), OTU 0026: Streptococcus devriesei (83.0% identity), OTU 1186: L. acidophilus (100% identity) and OTU 0021: Weissella viridescens (58.8% identity), all represented less than 0.3% of the overall reads mapped (0.20%, 0.29%, 0.32% and 0.17%, respectively) (Table 2). OTU 0026 and OTU 0021 had low percent identities to their nearest reference database matches (Streptococcus devriesei and Weissella vir-idescens, respectively) (Table 2), suggesting that these OTU represent as yet uncharacterized Firmicutes.
Total bacterial abundance per sample was estimated using qPCR of total 16S rRNA gene targets, while presence of Mollicutes in general and Ureaplasma species specifically were assessed by conventional PCR (Table 1). Estimates of total bacterial load ranged over more than five orders, from <104to >10916S rRNA copies per sample. Mollicutes were detected in vaginal samples of 217/310 (70%) women, with 149/310 (48%) testing positive for
Ureaplasma spp. U. parvum was detected more frequently (127/310 = 41%) than U. urealyti-cum (21/310 = 7%).
Hierarchical clustering and principal components analysis of community
state types (CST)
Hierarchical clustering of vaginal microbiome profiles resulted in six clusters with good sup-port (S1 Fig). All Jaccard indices from bootstrapping for six clusters were greater than 0.6, with two clusters greater than 0.65, one cluster greater than 0.8 and two clusters greater than 0.9. When the number of clusters was reduced or increased, the Jaccard indices fell below 0.6, and in some cases, below 0.5. Average silhouette width and the Pearson gamma index were also highest for six clusters, and the Dunn index at five and six clusters, indicating the most overall support for six clusters (S1 Fig).
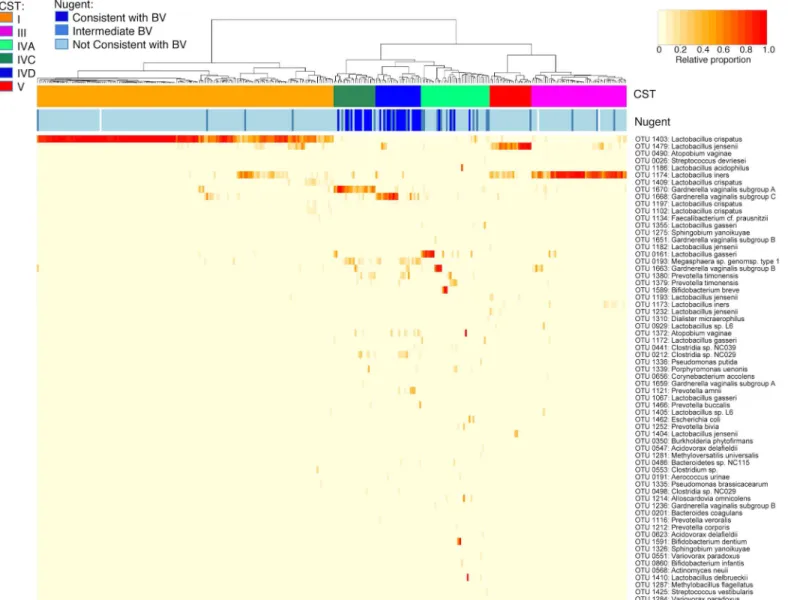
Lactobacillus-dominated CST identified correspond to those previously described in 16S rRNA deep sequencing studies (Fig 1). Consistent with previous studies of healthy
Table 2. Prevalence and proportion of total reads for OTU detected in at least half of study group.
Nearest neighboura OTU % identity Prevalence % total reads Lactobacillus crispatus OTU 1403 99.8 305 (98%) 36.8
OTU 1409 97.9 259 (84%) 1.6
OTU 1197 97.5 229 (74%) 0.7
OTU 1102 99.6 227 (73%) 0.7
Lactobacillus jensenii OTU 1479 95.7 296 (96%) 7.0
OTU 1182 100 162 (52%) 0.3
Atopobium vaginae OTU 0490 94.1 293 (95%) 0.2
Streptococcus devriesei OTU 0026 83.0 292 (94%) 0.3 Lactobacillus acidophilus OTU 1186 100 286 (92%) 0.3
Lactobacillus iners OTU 1174 100 285 (92%) 16.4
Weissella viridescens OTU 0021 58.8 279 (90%) 0.2
Desulfotalea psychrophila OTU 1048 76.1 251 (81%) 0.1
Peptoniphilus harei OTU 0478 90.0 240 (77%) 0.07
Clostridium innocuum OTU 0874 75.4 234 (76%) 0.08
Streptococcus parasanguinis OTU 1396 95.9 234 (76%) 0.08 Gardnerella vaginalissubgroup A OTU 1670 99.6 231 (75%) 7.1 Gardnerella vaginalissubgroup C OTU 1668 99.3 231 (75%) 3.9
OTU 1673 98.8 192 (62%) 0.1
Prevotella tannerae OTU 0157 79.6 230 (74%) 0.1
Faecalibacterium prausnitzii OTU 1134 84.1 224 (72%) 0.2
Lactobacillus gasseri OTU 1355 99.7 223 (72%) 0.2
OTU 0161 97.7 161 (52%) 2.0
Sphingobium yanoikuyae OTU 1275 99.3 218 (70%) 0.1
Gardnerella vaginalissubgroup B OTU 1651 98.8 202 (65%) 0.3
OTU 1663 99.6 157 (51%) 2.6
Massilia timonae OTU 0612 82.0 179 (58%) 0.03
Acidaminococcus fermentans OTU 0182 78.7 173 (56%) 0.03 Megasphaerasp. genomsp. type 1 OTU 0193 83.2 161 (52%) 1.8
Prevotella timonensis OTU 1380 97.7 157 (51%) 1.7
a
Closest match in the cpnDB reference database based on sequence identity. doi:10.1371/journal.pone.0135620.t002
reproductive-aged women, the profiles of most women (228/310 = 74%) belonged to CST dominated by one of three Lactobacillus species, including CST I (OTU 1403: L. crispatus (99.8% identity), n = 156), CST III (OTU 1174: L. iners (100% identity), n = 50) and CST V (OTU 1479: L. jensenii (95.7% identity), n = 22). Most individuals in CST I had very high pro-portions of L. crispatus OTU and very few OTU from other species, with a minority of individ-uals with co-dominant L. iners or L. jensenii (S2 Fig, panel A). Although profiles from most women in CST III were almost exclusively composed of L. iners, several also had co-dominant populations of L. jensenii, Gardnerella subgroup B or Gardnerella subgroup A (S2 Fig, panel B). In contrast, L. jensenii was highly dominant in only 7/22 women in CST V, with L. iners co-dominant in most profiles (S2 Fig, panel C). As expected, most women in CST I, III and V had BV- Nugent scores (217/228 or 95%), and none had BV+ Nugent scores.
Fig 1. Vaginal microbiome profiles of Canadian women.Heatmap representing hierarchical clustering of Jensen-Shannon distance matrices with Ward linkage on the relative proportions of reads for each OTU within individual vaginal samples collected from healthy, reproductive-aged Canadian women (n = 310). Each column represents a woman’s vaginal microbiome profile, and each row represents an OTU. For clarity, only the top 65 OTU by read abundance are shown. The proportion of the total microbiome comprised is indicated in the yellow to red colour scheme. Community state type (CST) and Nugent category (Nugent) for each woman are indicated by the top bars.
The L. gasseri-dominated CST II described by Ravel et al. [18] did not form its own sup-ported cluster in this study, but L. gasseri was dominant in 7/36 or 19% of women in CST IVA (S2 Fig, panel D). Two other women in this cluster had profiles dominated by Lactobacillus, including one with L. delbrueckii and another with L. acidophilus. As described previously, CST IVA is remarkably heterogeneous relative to other CST, with profiles dominated by organ-isms besides Lactobacillus, including Gardnerella subgroup B (n = 4), Bifidobacterium breve (n = 3), B. dentium (n = 2) or Atopobium vaginae (n = 1), or with no single dominant OTU but even mixtures of Stapylococcus, Streptococcus, Prevotella, Alloscardovia, Gardnerella and Lacto-bacillus (n = 17). Although most of the women in this CST had BV- Nugent scores, 25% (8/36) had BVI Nugent scores.
For the remaining CST, IVC (S2 Fig, panel E) and IVD (panel F), both have dominant Gardnerella and sub-populations of Clostridiales and Bacteroidales. However, two distinct clusters based on OTU from different cpn60-defined G. vaginalis subgroups [47] were observed: one characterized by Gardnerella subgroup A (OTU 1670, 99.6% identity, n = 22) and the other by Gardnerella subgroup C (OTU 1668, 99.3% identity, n = 24). For women in CST IVC, Gardnerella subgroup A was dominant in most profiles, with sub-dominant popula-tions of Megasphaera sp. and Prevotella timonensis in several women. Only about half of the women in CST IVD were dominated by Gardnerella subgroup C, while the other half had lower levels of this organism and co-dominant mixtures of Megasphaera sp., Prevotella timo-nensis, P. amnii and Atopobium vaginae. As expected, most of the women in CST IVC and IVD had BV+ Nugent scores (10/22 or 45% for IVC, 16/24 or 67% for IVD).
Abundance of reads for each CST in phylogenetic context
In order to better visualize sub-dominant populations in relation to CST, microbiome sequence data was viewed in phylogenetic context (Fig 2). CST I, III and V are clearly nated by L. crispatus, L. iners and L. jensenii respectively. CST IVC and IVD are clearly domi-nated by Gardnerella subgroup A and C respectively. However these organisms represent a smaller proportion of total reads for these CST compared to the Lactobacillus-dominated CST. The most commonly observed organisms are found in all CST, confirming that fluctua-tions in relative abundance rather than presence or absence of specific organisms characterize CST.
Several sub-dominant populations are virtually absent in Lactobacillus-dominated CST (I, III, V), including Gardnerella subgroup D and Prevotella bivia, while Lactobacillus sp. L6 is vir-tually absent in Gardnerella-dominant CST (IVC, IVD). Prevotella timonensis and Atopobium vaginae are present at similar high levels in CST IVA, IVC and IVD and similar low levels in CST I, III and V, while Clostridium sp. NC029 and Megasphaera sp. are similarly abundant in CST IVC and IVD and lower in CST I, III, V and IVA. A few sub-dominant taxa are evenly dis-tributed across all CST.
Many organisms were observed in relatively high proportions in CST IVA, reflecting the mixed dominant phenotype. L. gasseri, Gardnerella subgroup B, Bifidobacterium sp., Atopo-bium vaginae, and E. coli sequences were all most abundant in IVA, which was expected since all individuals with profiles dominated by these organisms are included in this CST. Interest-ingly, abundance of several sub-dominant organisms from the phyla Firmicutes, Actinobac-teria and ProteobacActinobac-teria was associated with CST IVA, to a lesser extent with other,
Lactobacillus-dominated CST, and virtually absent in CST IVC and IVD. These observations indicate that broad phylogenetic groups of organisms are more likely to be present at low-abundance in women with Lactobacillus-dominated CST or CST IVA compared to IVC or IVD.
CST in relation to socio-behavioural variables
Despite extensive investigation of factors previously reported to influence the vaginal micro-biota profile, ethnicity was the only variable significantly related to CST when considering White and Asian women only, perhaps due to low numbers of women representing other eth-nic groups (Table 1,S3 Fig). CST membership was associated with Asian vs. White ethnicity (Benjamini-Hochberg adjusted p = 0.049) with greater than expected numbers of CST III in Asian women (S3 Fig). There were no other significant relationships between CST membership and clinical or demographic variables (Table 1).
CST and specific OTU in relation to Nugent score
The relationship between CST and Nugent score, noted in the analysis of heatmaps above, was determined to be statistically significant (Fisher exact test, Benjamini-Hochberg adjusted
Fig 2. Abundance and phylogenetic relationships of cpn60 defined species detected in samples from each CST.Neighbour-joining phylogeny of 164 unique cpn60 universal target using MEGA v6 for Mac, that are nearest neighbours for OTU detected at an abundance of at least 1% of at least one woman's sample. Branches proceeding from nodes with less than 50% bootstrap percent (100 replicates) are shown in grey. Circle area represents the proportion of each taxon (branch) in total normalized reads from women in different CST. Therefore, the combined area of all circles of the same colour equals the area of the central grey circle that represents 100% of reads attributed to that CST. Only the most abundant taxa are labelled. L. = Lactobacillus, P. = Prevotella, E. = Escherichia
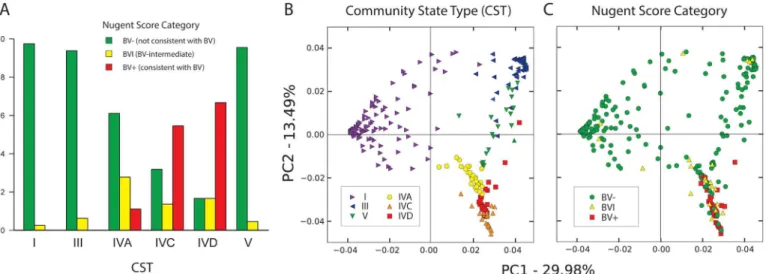
p < 0.0001;Table 1), with greater than expected numbers of profiles in CST IVC and IVD hav-ing BV+ Nugent scores, and greater than expected numbers of profiles in CST IVA havhav-ing BVI scores (Fig 3A). Principal component analysis of all samples according to CST (Fig 3B) and Nugent score (Fig 3C) revealed extensive overlap between the two categories, with BV- Nugent scores and BVI Nugent scores observed in all CST, while BV+ Nugent scores were observed only in CST IVA, IVC and IVD. Of the 24 women who self-identified as having vaginal symp-toms within 48 hours prior to sample collection (Table 1), only three had Nugent scores consis-tent with BV and each belonged to a different CST group (IVA, IVC and IVD, respectively) (S4 Fig).
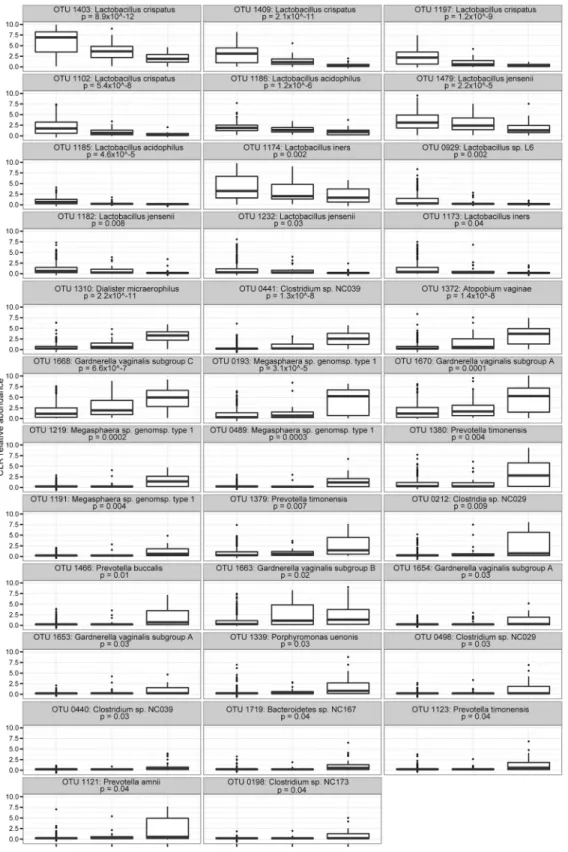
A total of 35 OTU were significantly different across Nugent categories by Kruskal-Wallis test. Not surprisingly, all OTU with a lower abundance in BVI or BV+ Nugent categories were Lactobacillus spp., while the remainder were all present at a higher abundance in those with BVI and/or BV+ Nugent scores (Fig 4). OTU 1663: G. vaginalis subgroup B was somewhat higher in the BVI category, although this was not statistically significant. No significant rela-tionship between Mollicutes detection (by targeted PCR) and Nugent score was observed. A phylogenetic tree illustrating relative abundance of organisms in relation to Nugent score cate-gory was constructed (S5 Fig), reinforcing previous observations regarding CST IVA in the CST abundance tree (Fig 2). Several sub-dominant organisms in the phyla Actinobacteria and Proteobacteria were observed almost exclusively in BV- and BVI samples, and several Strepto-coccus sp. were observed almost exclusively in BVI samples.
Discussion
The vaginal microbiota of 310 non-pregnant women aged 18 to 49 years was consistent with previous studies from Canada and other countries that sampled as few as 32 and as many as 494 adolescent girls and/or women [15–19,27]. The ethnic diversity in our study cohort reflects the Canadian population, with relatively large proportions of White and Asian women and smaller proportions of Black, Aboriginal and Hispanic subjects. Microbiota profiles in this cohort were largely characterized by the dominance of a single OTU most closely related to
Fig 3. Correspondence between CST and Nugent score.(A) Significant (Fisher exact test, Benjamini-Hochberg adjusted p < 0.0001) relationship between CST and Nugent score, including predominance of CST I, III and V in BV- samples, and CST IVC and IVD in BV+ samples. BVI samples were observed most frequently in CST IVA. (B) Principal components of microbiome for all members of study group, with individuals coloured by CST, and C) Nugent score.
Fig 4. OTU associated with BV-, BVI and BV+ categories.Boxplots showing differences in relative abundance (as center log transformed counts) among Nugent categories across 35 OTU that were significantly different among Nugent categories from the ALDeX analysis. These plots show all reads +1 so that zero values could be included in the log transformation. All p-values shown are corrected by the Benjamini-Hochberg method as indicated in the text. doi:10.1371/journal.pone.0135620.g004
Lactobacillus species including L. crispatus, L. iners, L. jensenii, and L. gasseri. However, we also observed CST dominated by two of the four known Gardnerella subgroups [47,48]. Individuals with dominant Gardnerella subgroups A and C separated into CST IVC and IVD, respectively, while those with dominant Gardnerella subgroup B clustered within the heterogeneous CST IVA category. Overall, this cpn60-based study confirms CST defined in earlier studies using the 16S rRNA target, while expanding the range of CST that can be defined due to increased resolution of cpn60. The ability to target Gardnerella subgroups in the context of microbial community profiles may help improve our clinical understanding of the role played by these organisms in the vaginal microbiome.
Similar to findings in our study, the majority of vaginal bacterial CST in other studies have been found to be dominated by lactobacilli, although the particular pattern of dominance of any one species varies among reports. This is perhaps not surprising given the variety of cohorts studied and the techniques used (S2 Table). In our study, CST groups I, III and V were dominated by L. crispatus, L. iners and L. jensenii respectively, but L. gasseri did not define any of the CST, although it was dominant in 7/36 (19%) of women in CST IVA. This species has been reported to define CST in previous T-RFLP [15] or 16S rRNA amplicon sequencing stud-ies [17,18,27], but has also been found using the same methods as dominant or co-dominant in a subset of profiles within larger CST [16], or as a low abundance organism [19]. In this study, CST IVA was similar to other described groups, including a wide range of anaerobic spe-cies. Equivalent CST from other studies include “group IV” (Atopobium vaginae, Gardnerella vaginalis and Prevotella) [16], “group IV” (Prevotella, Dialister, Atopobium and others) [18], “group IVB” (Atopobium, Prevotella and others) [27], and “group IV” (Atopobium and others) [17]. Further groups have been defined containing Streptococcus spp. (“group VII”) and high numbers of clones from a single clade of the family Lachnospiraceae (“group VIII”) [15]. Ato-pobium is common to all of these previous descriptions, and was equally represented in CST IVA, IVB and IVC in this study (Fig 2).
A noteworthy difference between our results and those of other reports is the identification of two distinct CST dominated by Gardnerella: IVC and IVD, dominated by Gardnerella sub-groups A and C respectively. Drell et al. [19] identified a Gardnerella dominated CST (CST IV) in their recent study of Estonian women, but in other studies Gardnerella occurs as a sub-dominant constituent of one or more CST, e.g. CST IV in [18] or CST IVB in [27]. The varia-tion in reports of abundance and prevalence of Gardnerella in the vaginal microbiome of healthy reproductive aged women can be explained by differences in the detection of these sequences with various “universal” PCR primers for a variety of gene targets. However, the evi-dence from real-time quantitative PCR validation of cpn60 pyrosequencing read abundance for Gardnerella performed previously by our group suggests that the higher estimates provided by cpn60-based microbiome profiles are realistic [28]. Regardless of abundance, the discrimina-tion of two distinct community types containing either Gardnerella cpn60-defined subgroups A or C, and the association of Gardnerella subgroup B with the BVI communities in our study is intriguing since these subgroups have been shown to be phenotypically and genomically dis-tinct [47,48] and differentially associated with BV status [49]. Further studies of the biological and clinical significance of this diverse taxon are currently underway.
Analysis of CST composition in a phylogenetic context (Fig 2) offers several additional insights, including the ability to visualize group-level differences as well as low- and medium-abundance sequences that correspond to the lightest colours in heatmaps. Several low-abundance genera were observed most frequently in CST IVA (e.g. Streptococcus spp.) and/or in Lactobacillus-dominated CST (several Proteobacteria and Actinobacteria). These findings confirm previous observations in a cpn60-based study of women in Nairobi, Kenya, where Pro-teobacteria genera nearest Acidovorax and Sphingobium were associated with
Lactobacillus-dominated profiles [22]. These organisms may be less likely to be detected using 16S rRNA gene sequencing [21], which would account for these components of the vaginal microbiota not being widely reported previously.
Reports of the prevalence of Mollicutes in reproductive aged women vary widely, and these reports are invariably based on culture and/or screening of samples with targeted PCR assays such as those used in the current study. Mollicutes are frequently undetected in 16S rRNA based studies due to bias in “universal” PCR primers [74] and they have not been detected pre-viously in the vaginal microbiota using the cpn60 UT, due to the absence of the target sequence in almost all Mollicutes species [20–22,28]. Our observation that 70% of women in our study cohort were PCR positive for Mollicutes is consistent with the high end of reported values [75].
The range of total 16S rRNA copies per sample was remarkable, including samples with fewer than 104to more than 109copies. However, no significant relationship between bacterial population size and CST was detected (Table 1). While variations in 16S rRNA copy number per genome among different taxa and variations in the amount of sample material collected with the swabs may have contributed to this finding, it also reflects the enormous variation in microbial population density that is possible. Bacterial overgrowth, as evidenced on clue cells, is certainly associated with clinical BV, but our results suggest that even among healthy, asymp-tomatic women, there is large variation in density of the vaginal microbiota. Similar observa-tions have been made using flow cytometry [76].
Our ability to associate OTU sequences assembled from cpn60 UT amplicon libraries with those of known bacterial species depends upon the availability of representative reference sequences. In the particular case of BVAB1 and BVAB2, this is problematic since these organ-isms have not been cultured to date and are known only by their 16S rRNA sequences [77]. We detected several clostridia-like OTU, such as OTU 0441: Clostridium sp. NC039 (79.8% iden-tity), OTU 0440: Clostridium sp. NC039 (80% ideniden-tity), OTU 0402: Clostridium sp. NC039 (80.4% identity) or OTU 0553: Clostridium sp. (64.6% identity), OTU 0207: Clostridium sp. (81.6% identity) that could possibly correspond to BVAB1 and BVAB2. However, identifica-tion of the cpn60 sequences of BVAB1 and BVAB2 awaits either culture or whole genome sequencing of these fastidious organisms.
Our results confirm a previously reported difference between the vaginal microbiota of Asian and White women in North America [18]. No obvious explanation can be given for this differ-ence. No other socio-demographic, hygiene or behavioural practices showed any significant cor-relation with CST. This is perhaps affected by minimal variations in behavioural and hygiene practices in a healthy Canadian cohort, as well as the cross-sectional design of the study. Future comparisons with different cohorts of women are needed to address this question further.
At the CST level, the only significant factors besides ethnicity were Nugent score category and Shannon’s diversity (highest in CST IVA), while at the OTU level, Nugent score was the only significant factor. Although the associations between Lactobacillus-dominated CST I, III and V with BV- Nugent scores and Gardnerella-dominated CST IVC and IVD with BV+ Nugent scores are straightforward, the link between the mixed dominant CST IVA and BVI Nugent scores is more difficult to draw. In the PCA plots, BVI samples and CST IVA clearly overlap with each other (Fig 3), however BVI samples are also observed in all other CST. In the abun-dance tree analysis, Streptococcus, Staphylococcus, Corynebacterium and Gardnerella subgroup B among others were more abundant in both CST IVA and BVI samples (Fig 2and S6 Fig). Since CST IVA is significantly associated with BVI Nugent scores, these observations may provide insight into the ambiguous clinical significance of the intermediate BV Nugent score category.
In conclusion, this large study of Canadian women has provided a solid foundation for expanded investigation of the vaginal microbiota into clinically significant cohorts. Compari-sons of this cohort with HIV-positive non-pregnant women, non-pregnant women with
recurrent vulvovaginitis, pregnant women at high and low risks of complications are currently in progress. The overall agreement of CST composition in healthy Canadian women to women from other parts of the world reaffirms that vaginal microbiota research is converging on a broad understanding of microbial community membership in this body site. This makes it eas-ier for research groups to share their investigative findings and collectively seek to improve the diagnosis of aberrant conditions and more appropriately treat them with existing and novel therapeutics. The challenge for future work will be to tease apart the details of this community structure, in concert with social and behavioural information, to understand and effect positive clinical outcomes for women’s health.
Supporting Information
S1 Fig. Validation of CST.Cluster validation scores generated by average silhouette width, Pearson gamma and Dunn index results. The highest value for each method (six clusters) indi-cates the strongest support for that number of clusters in the data.
(PDF)
S2 Fig. Detailed CST profiles.Hierarchical clustering of Jensen-Shannon distances with Ward linkage on the relative proportions of reads for each OTU within women from each CST clus-ter. Each column represents a woman’s vaginal microbiome profile, and each row represents an OTU. For clarity, only the top 65 OTU by read abundance are shown on the heatmap. The proportion of total sequence for each OTU is indicated in the yellow to red colour scheme. Nugent category for each woman is indicated by the top bar (light blue = BV-, medium blue = BVI, dark blue = BV+). A: Cluster I, B: Cluster III, C: Cluster IVA, D: Cluster IVC, E: Cluster IVD, F: Cluster V
(PDF)
S3 Fig. Ethnicity and CST.Distribution of CST among Asian and White women in this study. CST membership was associated with Asian vs. White ethnicity (Benjamini-Hochberg adjusted p = 0.049) with greater than expected numbers of CST III in Asian women.
(PDF)
S4 Fig. BV+ microbiome profiles.Hierarchical clustering of Jensen-Shannon distance matri-ces with Ward linkage on the relative proportions of reads for each OTU within women with Nugent scores consistent with BV (scores 7–10) (n = 32). Each column represents a woman’s vaginal microbiome profile, and each row represents an OTU. For clarity, only the top 65 OTU by read abundance are shown on the heatmap. The proportion of the total microbiome com-prised of each OTU is indicated in the yellow to red colour scheme. Community state type (CST) and whether vaginal symptoms (odor, abnormal discharge, and/or irritation) were self-reported within 48 hours of sample collection (Symptoms 48 hr) for each woman is indicated by the top bars.
(PDF)
S5 Fig. Nugent score abundance tree.Abundance and phylogenetic relationships of cpn60 defined species detected in samples from each Nugent score category. Neighbour-joining phy-logeny of 164 unique cpn60 universal target using MEGA v6 for Mac, that are nearest neigh-bours for OTU detected at an abundance of at least 1% of at least one woman's sample. Branches proceeding from nodes with less than 50% bootstrap percent (100 replicates) are shown in grey. Circle area represents the proportion of each taxon (branch) in total normalized reads from women in different Nugent categories. Most abundant taxa are labeled. L. = Lacto-bacillus, P. = Prevotella, E. = Escherichia
S1 Table. Summary of OTU analyzed in this study.Best database match, taxonomic lineage of the best database match and abundance in each library are shown.
(XLSX)
S2 Table. Previous culture-independent studies reporting Community State Types. (DOCX)
Acknowledgments
The authors thank the women who took the time and effort to participate in this study. The VOGUE Research Group is Deborah Money, Alan Bocking, Sean Hemmingsen, Janet Hill, Gregor Reid, Tim Dumonceaux, Gregory Gloor, Matthew Links, Kieran O'Doherty, Patrick Tang, Julianne Van Schalkwyk and Mark Yudin.
Author Contributions
Conceived and designed the experiments: DM BC AYKA SMH GR JEH JvS. Performed the experiments: BC JEH MGL. Analyzed the data: AYKA BC JEH JJS MGL EW. Wrote the paper: AYKA BC EW JEH DM.
References
1. Hillier SL, Krohn MA, Klebanoff SJ, Eschenbach DA. The relationship of hydrogen peroxide-producing lactobacilli to bacterial vaginosis and genital microflora in pregnant women. Obstet Gynecol. 1992; 79(3):369–73. PMID:1738516
2. Sobel JD. Is there a protective role for vaginal flora? Curr Infect Dis Rep. 1999; 1(4):379–83. PMID:
11095812
3. Hillier SL. The vaginal microbial ecosystem and resistance to HIV. AIDS Res Hum Retroviruses. 1998; 14 (Suppl 1):S17–21. PMID:9581879
4. Gupta K, Stapleton AE, Hooton TM, Roberts PL, Fennell CL, Stamm WE. Inverse association of H2O2
-producing lactobacilli and vaginal Escherichia coli colonization in women with recurrent urinary tract infections. J Infect Dis. 1998; 178(2):446–50. PMID:9697725
5. Wiesenfeld HC, Hillier SL, Krohn MA, Landers DV, Sweet RL. Bacterial vaginosis is a strong predictor of Neisseria gonorrhoeae and Chlamydia trachomatis infection. Clin Infect Dis. 2003; 36(5):663–8. PMID:12594649
6. Cadieux PA, Burton J, Devillard E, Reid G. Lactobacillus by-products inhibit the growth and virulence of uropathogenic Escherichia coli. J Physiol Pharmacol. 2009; 60:13–8.
7. Matu MN, Orinda GO, Njagi EN, Cohen CR, Bukusi EA. In vitro inhibitory activity of human vaginal lac-tobacilli against pathogenic bacteria associated with bacterial vaginosis in Kenyan women. Anaerobe. 2010; 16(3):210–5. doi:10.1016/j.anaerobe.2009.11.002PMID:19925874
8. Strus M, Brzychczy-Wloch M, Gosiewski T, Kochan P, Heczko PB. The in vitro effect of hydrogen per-oxide on vaginal microbial communities. FEMS Immunol Med Microbiol. 2006; 48(1):56–63. PMID:
16965352
9. O'Hanlon DE, Moench TR, Cone RA. In vaginal fluid, bacteria associated with bacterial vaginosis can be suppressed with lactic acid but not hydrogen peroxide. BMC Infect Dis. 2011; 11:200. doi:10.1186/ 1471-2334-11-200PMID:21771337
10. Reid G, McGroarty JA, Tomeczek L, Bruce AW. Identification and plasmid profiles of Lactobacillus spe-cies from the vagina of 100 healthy women. FEMS Immunol Med Microbiol. 1996; 15(1):23–6. PMID:
8871112
11. Velraeds MMC, vanderMei HC, Reid G, Busscher HJ. Physicochemical and biochemical characteriza-tion of biosurfactants released by Lactobacillus strains. Colloids and Surfaces B-Biointerfaces. 1996; 8(1–2):51–61.
12. Ma B, Forney LJ, Ravel J. Vaginal microbiome: rethinking health and disease. Annu Rev Microbiol. 2012; 66:371–89. doi:10.1146/annurev-micro-092611-150157PMID:22746335
13. Hickey RJ, Zhou X, Pierson JD, Ravel J, Forney LJ. Understanding vaginal microbiome complexity from an ecological perspective. Transl Res. 2012; 160(4):267–82. doi:10.1016/j.trsl.2012.02.008
14. Macklaim JM, Cohen CR, Donders G, Gloor GB, Hill JE, Parham GP, et al. Exploring a road map to counter misconceptions about the cervicovaginal microbiome and disease. Reprod Sci. 2012; 19(11): 1154–62. doi:10.1177/1933719112446075PMID:22614624
15. Zhou X, Brown CJ, Abdo Z, Davis CC, Hansmann MA, Joyce P, et al. Differences in the composition of vaginal microbial communities found in healthy Caucasian and black women. ISME J. 2007; 1(2): 121–33. PMID:18043622
16. Yamamoto T, Zhou X, Williams CJ, Hochwalt A, Forney LJ. Bacterial populations in the vaginas of healthy adolescent women. J Pediatr Adolesc Gynecol. 2009; 22(1):11–8. doi:10.1016/j.jpag.2008.01. 073PMID:19232297
17. Zhou X, Hansmann MA, Davis CC, Suzuki H, Brown CJ, Schutte U, et al. The vaginal bacterial commu-nities of Japanese women resemble those of women in other racial groups. FEMS Immunol Med Micro-biol. 2010; 58(2):169–81. doi:10.1111/j.1574-695X.2009.00618.xPMID:19912342
18. Ravel J, Gajer P, Abdo Z, Schneider GM, Koenig SS, McCulle SL, et al. Vaginal microbiome of repro-ductive-age women. Proc Nat Acad Sci USA. 2011; 108 Suppl 1:4680–7. doi:10.1073/pnas. 1002611107PMID:20534435
19. Drell T, Lillsaar T, Tummeleht L, Simm J, Aaspollu A, Vain E, et al. Characterization of the vaginal micro- and mycobiome in asymptomatic reproductive-age Estonian women. PLoS ONE. 2013; 8(1): e54379. doi:10.1371/journal.pone.0054379PMID:23372716
20. Hill JE, Goh SH, Money DM, Doyle M, Li A, Crosby WL, et al. Characterization of vaginal microflora of healthy, nonpregnant women by chaperonin-60 sequence-based methods. Am J Obstet Gynecol. 2005; 193(3 Pt 1):682–92. PMID:16150261
21. Schellenberg J, Links MG, Hill JE, Dumonceaux TJ, Peters GA, Tyler S, et al. Pyrosequencing of the chaperonin-60 universal target as a tool for determining microbial community composition. Appl Envi-ron Microbiol. 2009; 75(9):2889–98. doi:10.1128/AEM.01640-08PMID:19270139
22. Schellenberg JJ, Links MG, Hill JE, Dumonceaux TJ, Kimani J, Jaoko W, et al. Molecular definition of vaginal microbiota in East African commercial sex workers. Appl Environ Microbiol. 2011; 77(12): 4066–74. doi:10.1128/AEM.02943-10PMID:21531840
23. Verhelst R, Verstraelen H, Claeys G, Verschraegen G, Delanghe J, Van Simaey L, et al. Cloning of 16S rRNA genes amplified from normal and disturbed vaginal microflora suggests a strong association between Atopobium vaginae, Gardnerella vaginalis and bacterial vaginosis. BMC Microbiol. 2004; 4:16. PMID:15102329
24. Sundquist A, Bigdeli S, Jalili R, Druzin ML, Waller S, Pullen KM, et al. Bacterial flora-typing with tar-geted, chip-based Pyrosequencing. BMC Microbiol. 2007; 7:108. PMID:18047683
25. Hyman RW, Fukushima M, Diamond L, Kumm J, Giudice LC, Davis RW. Microbes on the human vagi-nal epithelium. Proc Nat Acad Sci USA. 2005; 102(22):7952–7. PMID:15911771
26. Zhou X, Bent SJ, Schneider MG, Davis CC, Islam MR, Forney LJ. Characterization of vaginal microbial communities in adult healthy women using cultivation-independent methods. Microbiology. 2004; 150(Pt 8):2565–73. PMID:15289553
27. Gajer P, Brotman RM, Bai G, Sakamoto J, Schutte UM, Zhong X, et al. Temporal dynamics of the human vaginal microbiota. Sci Trans Med. 2012; 4(132):132ra52.
28. Chaban B, Links MG, Paramel Jayaprakash T, Wagner EC, Bourque DK, Lohn Z, et al. Characteriza-tion of the vaginal microbiota of healthy Canadian women through the menstrual cycle. Microbiome. 2014; 2:23. doi:10.1186/2049-2618-2-23PMID:25053998
29. Keane FE, Ison CA, Taylor-Robinson D. A longitudinal study of the vaginal flora over a menstrual cycle. Int J STD AIDS. 1997; 8(8):489–94. PMID:9259496
30. Eschenbach DA, Thwin SS, Patton DL, Hooton TM, Stapleton AE, Agnew K, et al. Influence of the nor-mal menstrual cycle on vaginal tissue, discharge, and microflora. Clin Infect Dis. 2000; 30(6):901–7. PMID:10852812
31. Srinivasan S, Liu C, Mitchell CM, Fiedler TL, Thomas KK, Agnew KJ, et al. Temporal variability of human vaginal bacteria and relationship with bacterial vaginosis. PLoS ONE. 2010; 5(4):e10197. doi:
10.1371/journal.pone.0010197PMID:20419168
32. Hickey RJ, Abdo Z, Zhou X, Nemeth K, Hansmann M, Osborn TW 3rd, et al. Effects of tampons and menses on the composition and diversity of vaginal microbial communities over time. Br J Obstet Gynaecol. 2013; 120(6):695–704.
33. Santiago GL, Cools P, Verstraelen H, Trog M, Missine G, El Aila N, et al. Longitudinal study of the dynamics of vaginal microflora during two consecutive menstrual cycles. PLoS ONE. 2011; 6(11): e28180. doi:10.1371/journal.pone.0028180PMID:22140538
34. Ding T, Schloss PD. Dynamics and associations of microbial community types across the human body. Nature. 2014; 509(7500):357–60. doi:10.1038/nature13178PMID:24739969
35. Bradshaw CS, Vodstrcil LA, Hocking JS, Law M, Pirotta M, Garland SM, et al. Recurrence of bacterial vaginosis is significantly associated with posttreatment sexual activities and hormonal contraceptive use. Clin Infect Dis. 2013; 56(6):777–86. doi:10.1093/cid/cis1030PMID:23243173
36. Riggs M, Klebanoff M, Nansel T, Zhang J, Schwebke J, Andrews W. Longitudinal association between hormonal contraceptives and bacterial vaginosis in women of reproductive age. Sex Transm Dis. 2007; 34(12):954–9. PMID:18077845
37. Fashemi B, Delaney ML, Onderdonk AB, Fichorova RN. Effects of feminine hygiene products on the vaginal mucosal biome. Microb Ecol Health Dis. 2013; 24:19703.
38. Bradshaw CS, Walker SM, Vodstrcil LA, Bilardi JE, Law M, Hocking JS, et al. The influence of behav-iors and relationships on the vaginal microbiota of women and their female partners: the WOW Health Study. J Infect Dis. 2014; 209(10):1562–72. doi:10.1093/infdis/jit664PMID:24285846
39. Schwebke JR, Richey CM, Weiss HL. Correlation of behaviors with microbiological changes in vaginal flora. J Infect Dis. 1999; 180(5):1632–6. PMID:10515826
40. Links MG, Dumonceaux TJ, Hemmingsen SM, Hill JE. The chaperonin-60 universal target is a barcode for bacteria that enables de novo assembly of metagenomic sequence data. PLoS ONE. 2012; 7(11): e49755. doi:10.1371/journal.pone.0049755PMID:23189159
41. Vermette CJ, Russell AH, Desai AR, Hill JE. Resolution of phenotypically distinct strains of Enterococ-cusspp. in a complex microbial community using cpn60 universal target sequencing. Microbial Ecol. 2009; 59(1):14–24.
42. Brousseau R, Hill JE, Prefontaine G, Goh SH, Harel J, Hemmingsen SM. Streptococcus suis serotypes characterized by analysis of chaperonin 60 gene sequences. Appl Environ Microbiol. 2001; 67(10): 4828–33. PMID:11571190
43. Hill JE, Paccagnella A, Law K, Melito PL, Woodward DL, Price DL, et al. Identification of Campylobacter spp. and discrimination from Helicobacter and Arcobacter spp. by direct sequencing of PCR-amplified cpn60 sequences and comparison to cpnDB, a chaperonin reference sequence database. J Med Microbiol. 2006; 55:393–9. PMID:16533986
44. Hill JE, Town JR, Hemmingsen SM. Improved template representation in cpn60 PCR product libraries generated from complex templates by application of a specific mixture of PCR primers. Environ Micro-biol. 2006; 8(4):741–6. PMID:16584485
45. Hill JE, Fernando WMU, Zello GA, Tyler RT, Dahl WJ, Van Kessel AG. Improvement of the representa-tion of bifidobacteria in fecal microbiota metagenomic libraries by applicarepresenta-tion of the cpn60 universal primer cocktail. Appl Environ Microbiol. 2010; 76(13):4550–2. doi:10.1128/AEM.01510-09PMID:
20435766
46. Links MG, Demeke T, Gräfenhan T, Hill JE, Hemmingsen SM, Dumonceaux TJ. Simultaneous profiling of seed-associated bacteria and fungi reveals antagonistic interactions between microorganisms within a shared epiphytic microbiome on Triticum and Brassica seeds. New Phytologist. 2014; 202(2): 542–53. doi:10.1111/nph.12693PMID:24444052
47. Paramel Jayaprakash T, Schellenberg JJ, Hill JE. Resolution and characterization of distinct cpn60-based subgroups of Gardnerella vaginalis in the vaginal microbiota. PLoS ONE. 2012; 7(8):e43009. doi:
10.1371/journal.pone.0043009PMID:22900080
48. Ahmed A, Earl J, Retchless A, Hillier SL, Rabe LK, Cherpes TL, et al. Comparative genomic analyses of 17 clinical isolates of Gardnerella vaginalis provide evidence of multiple genetically isolated clades consistent with subspeciation into genovars. J Bacteriol. 2012; 194(15):3922–37. doi:10.1128/JB. 00056-12PMID:22609915
49. Balashov SV, Mordechai E, Adelson ME, Gygax SE. Identification, quantification and subtyping of Gardnerella vaginalisin noncultured clinical vaginal samples by quantitative PCR. J Med Microbiol. 2014; 63(Pt 2):162–75. doi:10.1099/jmm.0.066407-0PMID:24200640
50. Nugent RP, Krohn MA, Hillier SL. Reliability of diagnosing bacterial vaginosis is improved by a stan-dardized method of gram stain interpretation. J Clin Microbiol. 1991; 29(2):297–301. PMID:1706728
51. Chaban B, Albert A, Links MG, Gardy J, Tang P, Hill JE. Characterization of the upper respiratory tract microbiomes of patients with pandemic H1N1 influenza. PLoS ONE. 2013; 8(7):e69559. doi:10.1371/ journal.pone.0069559PMID:23844261
52. van Kuppeveld FJ, van der Logt JT, Angulo AF, van Zoest MJ, Quint WG, Niesters HG, et al. Genus-and species-specific identification of mycoplasmas by 16S rRNA amplification. Appl Environ Microbiol. 1993; 59(2):655. PMID:8434934
53. Yoshida T, Maeda S, Deguchi T, Ishiko H. Phylogeny-based rapid identification of mycoplasmas and ureaplasmas from urethritis patients. J Clin Microbiol. 2002; 40(1):105–10. PMID:11773101
54. Teng LJ, Zheng X, Glass JI, Watson HL, Tsai J, Cassell GH. Ureaplasma urealyticum biovar specificity and diversity are encoded in multiple-banded antigen gene. J Clin Microbiol. 1994; 32(6):1464–9. PMID:8077390
55. Teng LJ, Ho SW, Ho HN, Liaw SJ, Lai HC, Luh KT. Rapid detection and biovar differentiation of Urea-plasma urealyticumin clinical specimens by PCR. J Formos Med Assoc. 1995; 94(7):396–400. PMID:
7549563
56. Schellenberg J, Links MG, Hill JE, Hemmingsen SM, Peters GA, Dumonceaux TJ. Pyrosequencing of chaperonin-60 (cpn60) amplicons as a means of determining microbial community composition. Meth-ods Mol Biol. 2011; 733:143–58. doi:10.1007/978-1-61779-089-8_10PMID:21431768
57. Links MG, Chaban B, Hemmingsen SM, Muirhead K, Hill JE. mPUMA: a computational approach to microbiota analysis by de novo assembly of OTUs based on protein-coding barcode sequences. Micro-biome. 2013; 1:23. doi:10.1186/2049-2618-1-23PMID:24451012
58. Grabherr MG, Haas BJ, Yassour M, Levin JZ, Thompson DA, Amit I, et al. Full-length transcriptome assembly from RNA-Seq data without a reference genome. Nat Biotechnol. 2011; 29(7):644–52. doi:
10.1038/nbt.1883PMID:21572440
59. Hill JE, Penny SL, Crowell KG, Goh SH, Hemmingsen SM. cpnDB: a chaperonin sequence database. Genome Res. 2004; 14(8):1669–75. PMID:15289485
60. Johnson LA, Chaban B, Harding JC, Hill JE. Optimizing a PCR protocol for cpn60-based microbiome profiling of samples variously contaminated with host genomic DNA. BMC Research Notes. 2015; 8:253. doi:10.1186/s13104-015-1170-4PMID:26092180
61. Oksanen J, Blanchet FG, Kindt R, Legendre P, Minchin PR, O'Hara RB, et al. vegan: Community Ecol-ogy Package. R package version 2.0–10. Available:http://CRAN.R-project.org/package = vegan. 2012.
62. Endres DM, Schindelin JE. A new metric for probability distributions. IEEE Trans Inf Theory. 2003; 49(7):1858–60.
63. Handl J, Knowles J, Kell DB. Computational cluster validation in post-genomic data analysis. Bioinfor-matics. 2005; 21(15):3201–12. PMID:15914541
64. Rousseeuw PJ. Silhouettes: a graphical aid to the interpretation and validation of cluster analysis. J Comput Appl Math. 1987; 20:53–65.
65. Halkidi M, Batistakis Y, Vazirgiannis M. On clustering validation techniques. J Intell Inf Syst. 2001; 17:107–45.
66. Dunn JC. Well separated clusters and fuzzy partitions. J Cybernetics. 1974; 4:95–104.
67. Hennig C. fpc: Flexible procedures for clustering. R package version 2.1–7. Available: http://CRAN.R-project.org/package = fpc.
68. Hochberg Y. A sharper Bonferroni procedure for multiple tests of significance. Biometrika. 1988; 75(4): 800–2.
69. Caporaso JG, Kuczynski J, Stombaugh J, Bittinger K, Bushman FD, Costello EK, et al. QIIME allows analysis of high-throughput community sequencing data. Nature Meth. 2010; 7(5):335–6.
70. Fernandes AD, Macklaim JM, Linn TG, Reid G, Gloor GB. ANOVA-like differential expression (ALDEx) analysis for mixed population RNA-Seq. PLoS ONE. 2013; 8(7):e67019. doi:10.1371/journal.pone. 0067019PMID:23843979
71. Benjamini Y, Hochberg Y. Controlling the false discovery rate: a practical and powerful approach to multiple testing. J R Stat Soc Series B Stat Methodol. 1995; 57:289–300.
72. Tamura K, Stecher G, Peterson D, Filipski A, Kumar S. MEGA6: Molecular Evolutionary Genetics Anal-ysis version 6.0. Mol Biol Evol. 2013; 30(12):2725–9. doi:10.1093/molbev/mst197PMID:24132122
73. Statistics Canada. Profile of ethnic origin and visible minorities, 2006 Census—Profile of ethnic origin and visible minorities for census metropolitan areas. 2006.
74. Hummelen R, Fernandes AD, Macklaim JM, Dickson RJ, Changalucha J, Gloor GB, et al. Deep sequencing of the vaginal microbiota of women with HIV. PLoS ONE. 2010; 5(8):e12078. doi:10.1371/ journal.pone.0012078PMID:20711427
75. Patel MA, Nyirjesy P. Role of Mycoplasma and Ureaplasma species in female lower genital tract infec-tions. Curr Infect Dis Rep. 2010; 12(6):417–22. doi:10.1007/s11908-010-0136-xPMID:21308549
76. Schellenberg J, Blake Ball T, Lane M, Cheang M, Plummer F. Flow cytometric quantification of bacteria in vaginal swab samples self-collected by adolescents attending a gynecology clinic. J Microbiol Meth. 2008; 73(3):216–26.
77. Fredricks DN, Fiedler TL, Marrazzo JM. Molecular identification of bacteria associated with bacterial vaginosis. New Engl J Med. 2005; 353(18):1899–911. PMID:16267321