Publisher’s version / Version de l'éditeur:
Biomarkers, 15, 8, pp. 693-706, 2010-08-01
READ THESE TERMS AND CONDITIONS CAREFULLY BEFORE USING THIS WEBSITE. https://nrc-publications.canada.ca/eng/copyright
Vous avez des questions? Nous pouvons vous aider. Pour communiquer directement avec un auteur, consultez la première page de la revue dans laquelle son article a été publié afin de trouver ses coordonnées. Si vous n’arrivez pas à les repérer, communiquez avec nous à [email protected].
Questions? Contact the NRC Publications Archive team at
[email protected]. If you wish to email the authors directly, please see the first page of the publication for their contact information.
Archives des publications du CNRC
This publication could be one of several versions: author’s original, accepted manuscript or the publisher’s version. / La version de cette publication peut être l’une des suivantes : la version prépublication de l’auteur, la version acceptée du manuscrit ou la version de l’éditeur.
For the publisher’s version, please access the DOI link below./ Pour consulter la version de l’éditeur, utilisez le lien DOI ci-dessous.
https://doi.org/10.3109/1354750X.2010.511268
Access and use of this website and the material on it are subject to the Terms and Conditions set forth at
Multi-gene biomarker panel for reference free prostate cancer
diagnosis : determination and independent validation
Cuperlovic-Culf, Miroslava; Belacel, Nabil; Davey, Michelle; Ouellette,
Rodney J.
https://publications-cnrc.canada.ca/fra/droits
L’accès à ce site Web et l’utilisation de son contenu sont assujettis aux conditions présentées dans le site LISEZ CES CONDITIONS ATTENTIVEMENT AVANT D’UTILISER CE SITE WEB.
NRC Publications Record / Notice d'Archives des publications de CNRC:
https://nrc-publications.canada.ca/eng/view/object/?id=da00e035-3ed2-41d3-b334-2cc1aee233d0 https://publications-cnrc.canada.ca/fra/voir/objet/?id=da00e035-3ed2-41d3-b334-2cc1aee233d0
Introduction
Prostate cancer has evolved as a major health problem in the male population of the Western world. It is cur-rently the most commonly diagnosed malignancy and the second leading cause of cancer death, represent-ing nearly 29% of all male cancer deaths (Li et al. 2006, Karan et al. 2003, Peehl 2005, Berger et al. 2004, Rose et al. 2005, Dhanasekaran et al. 2001, Lapointe et al. 2004, Luo et al. 2001, Singh et al. 2002,Varambally et al. 2002, Welsh et al. 2001, Rhodes et al. 2002, Tanguay 2000, Yu et al. 2004, Tomlins et al. 2007, LaTulippe et al. 2002, Mhawech-Fauceglia et al. 2007, Hessels et al. 2010, Graif et al. 2007, Esserman et al. 2009). he current methods for detecting prostate cancer include the prostate-speciic antigen (PSA) blood test, a dig-ital rectal examination (DRE), transrectal ultrasound (TRUS) and biopsy. However each of these tests suf-fers from signiicant limitations in sensitivity and
speciicity. New biomarkers are needed for prostate cancer diagnosis and treatment planning (Li et al. 2006, Graif et al. 2007, Esserman et al. 2009). Newly devel-oped single gene biomarkers, such as initially highly promising prostate cancer antigen 3 (PCA3), are still under investigation. he utility of such single marker tests is often questionable as the expression level of any one gene probably depends on a number of tumour and non-tumour related factors and can, thus, lead to high number of false-positive diagnosis (Hessels et al. 2010). Furthermore, prostate cancer metastasis that may occur via lymphatic and haematogenous path-ways can target almost any distant organ. When the diagnosis of metastatic prostate cancer is suspected immunohistochemistry is routinely used, usually analysing PSA and prostate-speciic acid phosphatase (PAP). Even though the use of these two markers can improve diagnosis, there are many reports showing that the accuracy of this test depends on the tumour grade
Address for Correspondence: MiroslavaCuperlovic-Culf,Institute for Information Technology, National Research Council of Canada, Moncton, 55 Crowley Farm Road, Suite 1100, Moncton, NB E1A 7R1, Canada. Tel: 506-861-0952. Fax: 506-851-3630. E-mail: [email protected]
O R I G I N A L A R T I C L E
Multi-gene biomarker panel for reference free prostate
cancer diagnosis: determination and independent
validation
Miroslava Cuperlovic-Culf
1,2, Nabil Belacel
2, Michelle Davey
1, and Rodney J. Ouellette
1,31Atlantic Cancer Research Institute, Moncton, NB, Canada, 2Institute for Information Technology, National Research Council of Canada, Moncton, NB, Canada, and 3Dr. Georges Dumont Hospital, Moncton, NB, Canada
Abstract
Identification of biomarkers that can accurately and reliably diagnose prostate cancer is clinically highly desirable. A novel classification method, K-closest resemblance was applied to several high-quality tran-scriptomic datasets of prostate cancer leading to the discovery of a panel of eight gene biomarkers that can detect prostate cancer with over 96% specificity and sensitivity in leave-one-out cross-validation. Independent validation on clinical samples confirmed the discriminatory power of this gene panel, yield-ing over 95% accuracy of diagnosis based on receiver-operatyield-ing characteristic curve analyses. Different levels of validation of the proposed biomarker panel have shown that it allows extremely accurate diagnosis of prostate cancer. Application of this panel can possibly add a fast and objective tool to the pathologist’s arsenal following further clinical testing.
Keywords: Prostate cancer; molecular diagnostic; gene expression microarray analysis; data analysis; biomarker discovery
(Received 04 June 2010; revised 16 July 2010; accepted 25 July 2010) ISSN 1354-750X print/ISSN 1366-5804 online © 2010 Informa UK, Ltd.
DOI: 10.3109/1354750X.2010.511268 http://www.informahealthcare.com/bmk
Biomarkers Downloaded from informahealthcare.com by 198.164.42.45 on 10/01/10
and treatment. herefore, additional markers would be highly beneicial (Tanguay 2000).
DNA microarrays are able to provide an unbiased screen of expression levels for thousands of genes in a range of samples. he application of DNA microarrays in cancer research over a decade has resulted in the avail-ability of an abundance of literature on gene expression measurements for many diferent applications. Several recent studies have systematically assessed gene expres-sion proiles in prostate normal and cancer tissues (Dhanasekaran et al. 2001, Lapoine et al. 2004, Luo et al. 2001, Singh et al. 2002, Varambally et al. 2002, Welsh et al. 2001), providing a wealth of relevant and openly acces-sible information on changes in mRNA levels relating to this disease. herefore it can be argued that suicient experimental gene expression information is already available for the extraction of an optimal biomarker set. he challenge lies in applying the best data analysis tools for the extraction of useful information.
Combined analysis of published microarray data and the available information about genes, proteins, metabo-lites and cellular pathways in the prostate gland provides a signiicant base for computational determination of clinically relevant biomarkers and their in silico valida-tion. Optimization as well as development of methods for supervised and unsupervised analysis of microarray data is expected to bring useful clinical information, including determination of diagnostic and prognostic biomarkers. Detailed analyses of the properties of these biomarkers can then lead to the determination of signiicant path-ways, providing a novel approach for their validation and also possibly leading to non-invasive diagnostics and improved treatment options.
Recent statistical analysis of clinical data suggests increasing the number of biopsies in patients (Graif et al. 2007). Subsequently, fast and accurate diagnosis from biopsy samples will be needed and this requires the identiication of optimal sets of diagnostic mark-ers. Several genes and proteins have been individually proposed as diagnostic markers for prostate cancer. However, expression levels of a single gene or a single protein can be altered by non-cancer-related factors leading to false-positive or false-negative diagnoses. Furthermore, reliance on changes in expression levels of a single biomarker for diagnosis requires measure-ment of the absolute concentration and the determi-nation of scale which is often problematic. Conversely,
the use of a biomarker panel reduces the likelihood of false-positive or false-negative results. Furthermore, the inclusion of genes that have both higher and lower expression levels in the malignant tissue provides an internal reference for the diagnostic test. Here, we present the discovery of a highly accurate gene panel for prostate cancer diagnosis as well as an independent
in silico and experimental validation on a number of independent patient samples.
Materials and methodology
Microarray datasets
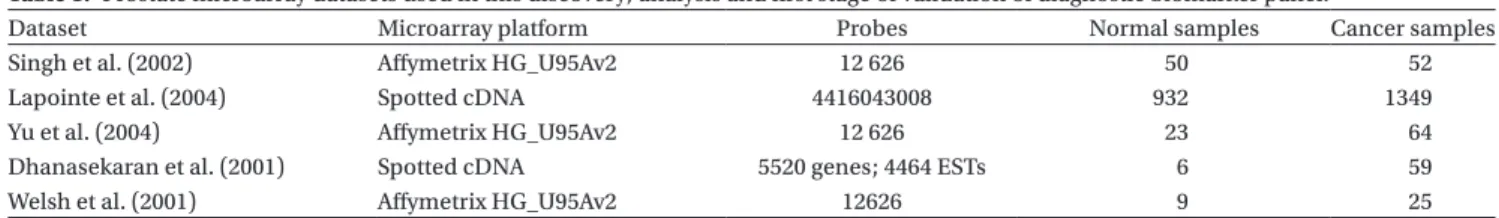
All datasets used for the biomarker discovery in this work were previously validated for accuracy in RNA expression measurements (references in Table 1). he primary set used for gene biomarker determination was published by Singh et al. (2002) as this was the largest dataset avail-able. he other listed datasets were used for the initial validation. References to the original datasets as well as the number of tumour and normal samples and microar-ray platform used are given in Table 1. he descriptions of methods used for sample processing, microarray experimentation, and validation are given in the original publications.
Data preprocessing
Several standard methods for microarray data normaliza-tion as well as combinanormaliza-tion of measurement replicates are utilized here. he original Afymetrix data from Singh et al. (2002) was normalized using the quantile normali-zation method. he RMA (robust multi-array average) method proposed by Irizarry et al. (2003) was used for probe summarization. In this method, summarization is performed using the median polish and the mismatch probes’ luorescence values are used only for background adjustment. Finally, log2-transformed data was scaled to a median value of zero and a standard deviation of 1 over all samples and genes. Data preprocessing was prima-rily performed using microarray analysis tools provided as part of Partek Genomics Suite (Partek Inc., St Louis, MO, USA) and TMeV (http://www.tm4.org/mev/). Other methods and tools such as Gene Pattern (Reich 2006), Bioconductor (www.bioconductor.org) and Matlab Table 1. Prostate microarray datasets used in this discovery, analysis and irst stage of validation of diagnostic biomarker panel.
Dataset Microarray platform Probes Normal samples Cancer samples
Singh et al. (2002) Afymetrix HG_U95Av2 12 626 50 52
Lapointe et al. (2004) Spotted cDNA 4416043008 932 1349
Yu et al. (2004) Afymetrix HG_U95Av2 12 626 23 64
Dhanasekaran et al. (2001) Spotted cDNA 5520 genes; 4464 ESTs 6 59
Welsh et al. (2001) Afymetrix HG_U95Av2 12626 9 25
Biomarkers Downloaded from informahealthcare.com by 198.164.42.45 on 10/01/10
(Matworks Inc, Natcik, MA, USA) were also utilized for method optimization.
Feature analysis and selection
he existence of several microarray studies of prostate cancer ofers possibilities for biomarker discovery. Combined meta-analysis of diferent datasets has previ-ously been suggested as an interesting way to increase the sample size (Grutzmann et al. 2005). However, direct combination of datasets is not possible because of the diferences in sample processing and experimental pro-cedures as well as probe diferences. Although several methods for data transformation and meta-analysis have been proposed, there is still no consensus or clear guidance on the best meta-analysis procedure. hus, meta-analysis, although leading to increased sample size, can lead to erroneous results. herefore, we used an alternative approach that still takes advantage of the many diferent datasets available. he largest dataset pro-vided by Singh et al. (2002) was used for biomarker panel determination. his high-quality dataset has matched normal (50) to cancer (52) samples. he other published datasets were used for irst round of independent valida-tion of gene panels.
Determination of the most significantly differentially expressed genes from publically available microarray dataset provided by Singh et al. (2002) was performed in two steps. Initial determination of a large subset of all significantly differently expressed genes was per-formed using significant analysis of microarrays (SAM) (Tusher et al.2001), Wilcox (Mann–Whitney) rank sum test and ANOVA. The gene subset selected by SAM was chosen for further analysis because all the genes determined as significant using the SAM method were also selected by either ANOVA or Mann–Whitney pro-cedures. The selection of a small, diagnostic biomarker panel was performed using a method developed in our group called Kclosest resemblance (K-CR) (Belacel 2004, Belacel 2000). K-CR is a type of multiple criteria decision analysis (Belacel 2000) where the determina-tion of a subset of K prototypes representing the clos-est resemblance to an object, or in this case a tissue sample, is based on the scoring function. In K-CR, final assignment of the tissue samples to different classes or to different types of tumours is performed using the majority-voting rule as used in the k nearest neighbour procedure (Dasarathy 1991). The method generates gene weights that can be used to select a subset of genes that results in the highest classification specifi-city and sensitivity for the dataset. In order to avoid over-fitting, the performance of the method for each gene subset was evaluated using the ‘leave-one-out’ technique (reviewed in Cuperlovic-Culf et al.2005). In order to avoid suboptimal selection, results from
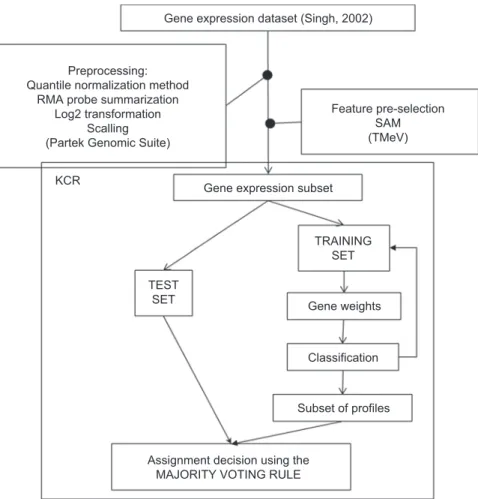
several consecutive runs of K-CR were evaluated based on the accuracy of classification, validation against other datasets and biological knowledge. The method is schematically represented in Figure 1.
Gene analysis
he analysis of properties and characteristics of biomar-ker genes in terms of their expression, function, sequence properties, interactions, gene ontologies and chromo-somal localization as well as gene correlation networks was performed using various methods for gene cluster-ing, sequence and pathway analysis. he methods used for gene and sample clustering included Fuzzy J-Means (Belacel 2004) as well as principal components analysis (PCA) and hierarchical clustering as applied in Partek Genomics Suite (Partek Inc.). Gene properties and expression levels in other microarray experiments were investigated using Oncomine (Rhodes et al.2007). Gene network analysis was performed using Pathway Studio (Ariadne Genomics, Rockville, MD, USA). Pathway Studio develops networks of related genes for a given list of genes based on literature search.
Experimental validation
he panel of genes was experimentally validated using quantitative real-time polymerase chain reaction (qPCR) gene expression measurements in an independent set of 19 tumour, 13 adjacent-to-tumour and 14 normal prostate RNA samples extracted from patient tissue biopsies pur-chased from a commercial source (Asterandplc, Detroit, MI, USA). Each RNA sample was assessed for 28S and 18S ribosomal degradation using the Experion™ Automated
Electrophoresis System (Bio-Rad Laboratories, Hercules, CA, USA). All samples demonstrated 28S/18S ratios of 1.6 or higher. Total RNA (500ng) was synthesized into cDNA using oligo(dT)20 primers and SuperScript III reverse transcriptase (Invitrogen, San Diego, CA, USA) according to the manufacturer’s suggested protocol. Each sample was reverse transcribed in triplicate. Real-time primers for the eight target genes were designed using Primer3 v0.3.0 (primer3.sourceforge.net) and the appropriate mRNA consensus sequences from the NCBI Entrez nucleotide database (ncbi.nlm.nih. gov). PCR product sizes were limited to a maximum of 150 bases in length. Primers were designed to amplify intron-spanning regions and were supplied by Integrated DNA Technologies (Coralville, IO, USA). qPCR reactions were done on a Mastercyclerep realplex2 (Eppendorf,
Westbury, NY, USA) instrument using B-R SYBR® Green
SuperMix for iQ™ (Quanta BioSciences, Gaithersburg,
MD, USA) reagent, optimized primer amounts for each primer set and cDNA input amounts of 10ng per 20μl reaction. Each gene measurement for each sample was
Biomarkers Downloaded from informahealthcare.com by 198.164.42.45 on 10/01/10
performed in triplicate.Melting curves were checked to ensure speciicity.
qPCR efficiencies (E) for each gene were calcu-lated using the formula E=10[-1/slope]. The relative
expression ratio (R) for each target gene was calcu-lated based on E and the quantification cycle (Cq) deviation of each test sample versus a control sam-ple (normal prostate RNA pool) using the following equation:
R = Etarget ∆Cq target (control sample)−
( ) (Pfaffl, 2001) (1)
Results and discussion
Feature analysis:biomarker discovery
he microarray dataset made publically available by Singh et al. (2002) was used for biomarker panel determi-nation. his high-quality dataset includes expression data for over 12,000 genes measured in matched normal (50) and prostate cancer (52) biopsy samples. Several statisti-cal methods were tested for their ability to exclude from the dataset genes which show no signiicant expression
level change between cancer and normal samples. hese statistical methods include ANOVA, Wilcox rank sum test and SAM. he subsets of signiicantly diferentially expressed genes obtained using these three statistical methods difered and is shown as a Venn diagram in Figure 2.
However, all the genes determined as signiicant using the SAM method were also selected by either ANOVA or Mann–Whitney procedures, with in fact a large majority of these genes selected by all three methods. Following this observation, further analysis was performed on the SAM-selected gene subset (557 genes). his set was used in the second step of the feature selection. In this step we have used the K-CR method developed in our group (Graif et al. 2007). Rather than selecting signiicant genes from the set, the K-CR method deletes the genes which are insigniicant in the classiication. his type of analy-sis allows the cross-interaction of signiicant genes to contribute to the accuracy of classiication. As K-CR is a heuristic method, several computational analyses were performed and several possible biomarker subsets were determined. he most optimal biomarker set was chosen based on the highest sensitivity, validation against other published microarray datasets and literature analysis
Gene expression dataset (Singh, 2002)
Gene expression subset KCR
Gene weights
Classification
Subset of profiles
Assignment decision using the MAJORITY VOTING RULE
Feature pre-selection SAM (TMeV) Preprocessing:
Quantile normalization method RMA probe summarization
Log2 transformation Scalling (Partek Genomic Suite)
TEST SET
TRAINING SET
Figure 1. Schematic description of the data analysis procedure including steps in data preprocessing, feature preselection and inal feature selec-tion using K-closest resemblance procedure (K-CR).
Biomarkers Downloaded from informahealthcare.com by 198.164.42.45 on 10/01/10
of genes in these panels. he selected biomarker panel (Table 2) showed 96% sensitivity and 98% speciicity of classiication in the test set using the ‘leave-one-out’ cross-validation technique.
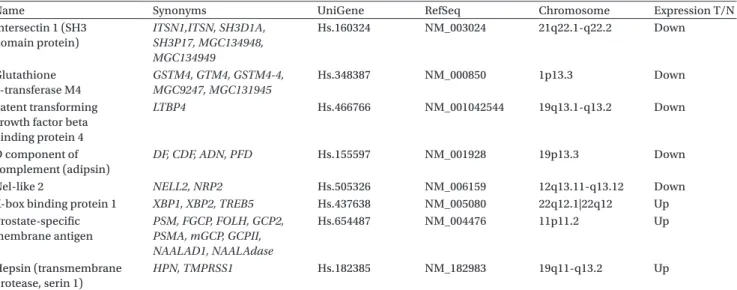
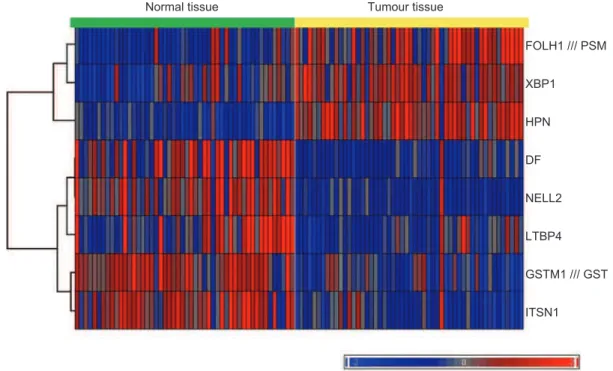
he selected diagnostic biomarker panel consists of eight genes - three genes that are overexpressed and ive that are underexpressed in prostate tumours relative to normal prostate tissue. Presented in the Table are names, synonyms and NCBI gene IDs. Also included is the chro-mosome location for each gene. he possible signiicance of the gene chromosomal location is outlined below. he expression levels of the biomarker gene panel based on the microarray measurements (Singhet al. 2002), follow-ing normalization and scalfollow-ing as described in Methods, are shown in Figure 3 as a heat map.
For optimal sample diagnosis, values for all eight genes should be utilized and the inal sample classiication
should be performed using the majority voting method or the ratio method described below. From the expression level heat map presented in Figure 3 it can be seen that when majority voting from the results of all eight genes is used for diagnosis only one normal and one tumour sample are misclassiied, resulting in 96% sensitivity and 98% speciicity in detecting the presence of prostate can-cer in tissue samples.
Independent microarray set validation
he independent analysis of the classiication power of the selected biomarker panel was performed using the microarray dataset published by Lapointe et al. (2004) as well as on several other datasets available in the Oncomine database (Rhodes et al. 2007) (Tables 1 and 3). he dataset provided by Lapointe and co-workers consists of gene expressions measured using spotted cDNA microarrays rather than the Afymetrix short oligonucleotide chips used by Singh and co-workers. herefore, exploration of gene expressions based on the Lapointe dataset (Lapointe et al. 2004) could dem-onstrate whether highly signiicant and diagnostic gene expression changes observed on Singh et al. dataset (Singh et al. 2002) come from phenotypical changes rather than technological biases of the Afymetrix plat-form. he microarray platforms used by Lapointe and colleagues included only ive out of the eight marker genes in our list (GSTM4, HPN, ITSN1, LTBP4 and
XBP1). However, the hierarchical clustering (Figure 4) and the PCA (Figure 5) of the expression level values for these ive biomarkers still showed good separation between tumour and normal samples. Figure 4 presents the comparison of the result of hierarchical clustering of samples based on the ive gene set (Figure 4A), all genes in the iltered set (Figure 4B), and a subset of ive
SAM (557) ANOVA (791) Mann-Whitney (744) 0 541 135 0 16 99 68
Figure 2. Venn diagram comparing gene subsets selected using ANOVA, Mann–Whitney (Wilcox rank sum) and signiicant analysis of microarrays (SAM) tests. he ANOVA and Mann–Whitney gene subset is selected to have p<0.0005; SAM subset is selected with D=1.287 and 0 false-discovery rate.
Table 2. Biomarker gene set determination using K-CR analysis on published prostate cancer datasets (Belacel 2007).
Name Synonyms UniGene RefSeq Chromosome Expression T/N
Intersectin 1 (SH3 domain protein) ITSN1,ITSN, SH3D1A, SH3P17, MGC134948, MGC134949 Hs.160324 NM_003024 21q22.1-q22.2 Down Glutathione S-transferase M4 GSTM4, GTM4, GSTM4-4, MGC9247, MGC131945 Hs.348387 NM_000850 1p13.3 Down Latent transforming growth factor beta binding protein 4
LTBP4 Hs.466766 NM_001042544 19q13.1-q13.2 Down
D component of complement (adipsin)
DF, CDF, ADN, PFD Hs.155597 NM_001928 19p13.3 Down
Nel-like 2 NELL2, NRP2 Hs.505326 NM_006159 12q13.11-q13.12 Down X-box binding protein 1 XBP1, XBP2, TREB5 Hs.437638 NM_005080 22q12.1|22q12 Up Prostate-speciic membrane antigen PSM, FGCP, FOLH, GCP2, PSMA, mGCP, GCPII, NAALAD1, NAALAdase Hs.654487 NM_004476 11p11.2 Up Hepsin (transmembrane protease, serin 1) HPN, TMPRSS1 Hs.182385 NM_182983 19q11-q13.2 Up
Biomarkers Downloaded from informahealthcare.com by 198.164.42.45 on 10/01/10
randomly selected genes (Figure 4C). From the results of hierarchical clustering it can be seen that when using the ive proposed diagnostic genes, only 7 out of 41 normal samples and 3 out of 62 cancer samples were misclassiied resulting in sensitivity and speciicity of 95% and 81%, respectively, in this completely independ-ent dataset. On the other hand, sample clustering based on the complete gene dataset as well as the randomly selected ive gene subset did not lead to visible grouping of samples by their type.
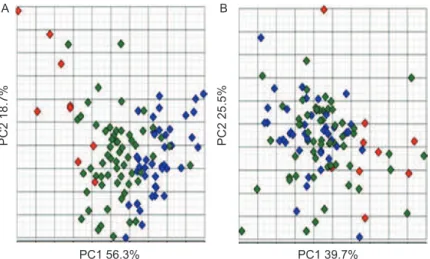
A similar observation was made from PCA analy-sis (Figure 5). Once again, good separation of samples based on PCA using the proposed ive-gene diagnostic set was obtained (Figure 5A), while poor separation was observed using ive randomly selected genes (Figure 5B). As in hierarchical clustering, classiication based on the data for the ive proposed marker genes appears to be
wrong for only three to four cancer and seven to eight normal samples.
he lower sensitivity and speciicity obtained in this independent set relative to the original dataset can be easily understood considering that here it was only pos-sible to use ive genes from the panel and that spotted cDNA technology introduces larger noise in measure-ments. However, it should still be noted that the subset of ive genes from our biomarker panel allows clear distinction between lymph node metastasis, tumours and, even more clearly, normal samples. hus it can be inferred that in the metastatic cells expression levels of the marker genes change even further from their normal cell levels. his observation will be further investigated in the future.
he Oncomine analysis of the biomarker genes showed consistent expression levels diference between
Normal tissue Tumour tissue
FOLH1 /// PSM XBP1 HPN DF NELL2 LTBP4 GSTM1 /// GST ITSN1
Figure 3. Heat map showing the gene expression values for the biomarker gene panel set as determined in the work by Singh et al. (2002).
Table 3. p-Values for diference between expression levels for marker genes between cancer and normal prostate samples in several diferent studies available in the Oncomine database (Rhodes et al. 2007).
Gene Rhodes 2002 Lapointe 2004 Luo 2001 Dhanasekaran 2001 Tomlins 2007 Welsh 2001 LaTilippe 2001 Vanaja 2003 Yu 2004 Holzbeierlein 2004
ITSN1 3.5E-10 9.7E-9
GSTM4 3.7E-19 1.7E-7 4.6E-6
LTBP4 3.7E-5 6.4E-6
DF 6.4E-10
NELL2 1.2E-12 4.1E-6 8.8E-5
XBP1a 7.4E-5 1E-4 9.5E-6
FOLH1 1.6E-8 1.6E-6 7.2E-6
HPN 6.1E-25 1.8E-7 2.5E-9 2.1E-8 3.8E-8 5.2E-19
aOnly comparison metastatic prostate cancer/prostate carcinoma is available in Oncomine; XBP1 overexpressed in prostate carcinomas.
Biomarkers Downloaded from informahealthcare.com by 198.164.42.45 on 10/01/10
cancer and normal tissues across many diferent prostate tissue datasets for all eight genes in the panel (Table 3). he ten prostate cancer studies included in Oncomine difered highly in the number of samples, the experimen-tal protocol and the platform. hus, the observed large variation in the actual p-values for biomarker genes was to be expected (Table 3). However, for all eight marker genes in all available datasets p-values showed a signii-cant diference between gene expression in tumours and normal samples.
Experimental validation and application method
To validate further the diagnostic utility of the eight-gene panel derived from microarray dataset analyses, the expression levels of these biomarkers were tested using an independent measurement technique, real-time PCR and an independent set of commercially obtained patient prostate samples. he relative expression levels for each of the eight genes were determined for each of
19 tumour, 14 normal and 13 normal/adjacent-to-tumour samples (the measurements are available from authors upon request).
In addition to independent, experimental, validation the goal of real-time PCR analysis was to devise a diag-nostic method that would be robust to individual gene changes and that could take full advantage of the pres-ence of both overexpressed and underexpressed genes in the proposed diagnostic panel. Using the average value of the relative expression results for XBP1, PSMA and HPN (overexpressed genes) divided by the aver-age value of the relative expression results for GSTM4,
LTBP4, ADIPSIN, NELL2 and ITSN1 (underexpressed genes) allowed for a direct and simple diagnostic index calculation. Furthermore, such application of the panel allowed determination of the index without utilization of reference genes, i.e.’house-keeping’ genes, which are necessary for absolute calculation of gene expres-sion. Finally, averaging over several genes in the panel has the potential to reduce errors caused by individual
A L N T Type L N T Type C B
Figure 4. he result of hierarchical agglomerative clustering with Ward’s linkage method for Lapointeet al.data(Lapointeet al.2004).Ward’s linkage method combines the two clusters which minimizethe increase in total error sum of squares (ESS). he ESS ofa cluster is the sum of squares of the deviations from the meanvalue. (A) Sample clustering using ive of eight biomarker genes. Genes available in Lapointe dataset after iltering were: GSTM4, HPN, ITSN1, LTBP4 and XBP1. (B) Sample clustering using all genes in the iltered Lapointe dataset. (C) Sample clustering based on data for ive randomly selected genes using the iltered Lapointe dataset.
Biomarkers Downloaded from informahealthcare.com by 198.164.42.45 on 10/01/10
variations in gene expression due to factors other than the cancer.
herefore, we would like to propose that real-time PCR expression results for the eight-gene panel are employed for prostate cancer diagnosis using the following index:
d RHPN,RFOLH1,RXBP1 RITSN1,RGTM4,RLTBP4, RNELL2 =
where R is the relative expression ratio calculated using Equation 1.
From the obtained results it is possible to deine an index for diagnosis as:
d> − 1 cancer tissue; d< − 1 normal tissue
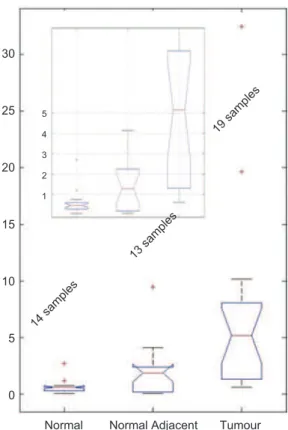
he boxplots of values obtained for index d, as deter-mined using the equation above, for tumour, adjacent-to-tumour and normal sample groups within the independent sample set are presented in Figure 6.
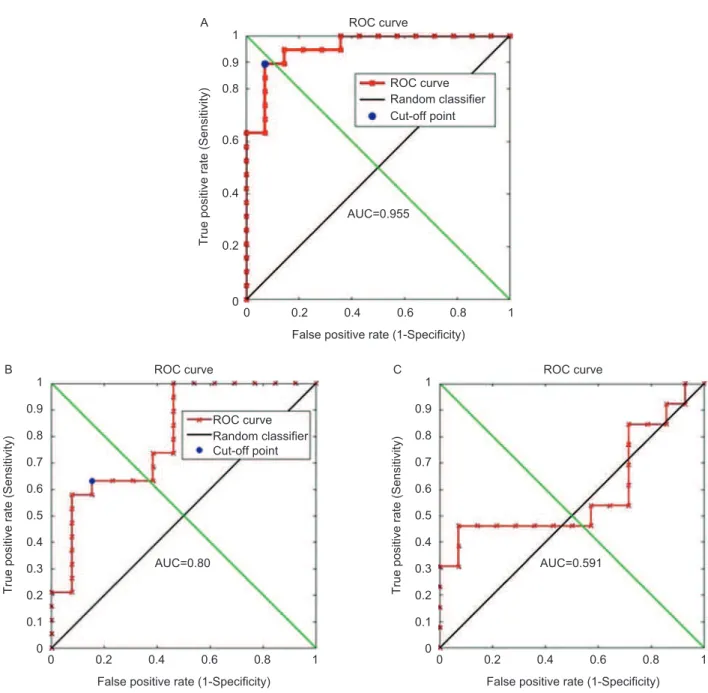
From these measurements it can be observed that in tumours the ratio was always signiicantly over 1 with an average value for all tumour samples of about 5. For nor-mal samples all ratios were below 1 with average value of approximately 0.5. For adjacent-to-tumour samples ratios were all over 1 with an average value of around 2. he receiver-operator curve (ROC) analyses for clas-siication accuracy from ratios for normal versus tumour (Figure 7A), adjacent-to-tumour versustumour (Figure 7B) and normal versus adjacent-to-tumour (Figure 7C) are presented in Figure 7.
ROC analysis showed that the sensitivity and specii-city for classiication of tumour from normal was over 90% in these independent samples. he area under the curve (AUC) for the classiication of tumour versus normal was 0.955. he ROC curves for classiication of normal versus adjacent-to-tumour and adjacent-to-tumour vs. tumour demonstrated that although adjacent-to-tumour samples
could still be distinguished from tumour samples with an AUC of 0.80, these samples still displayed very diferent gene expression from non-cancer normal samples.
he validity of this index will be further established in the ongoing preclinical trials (Dr Georges Dumont Hospital, Moncton, Canada); however its diagnostic power is quite indicative in these 46 samples tested thus far. he possibility for application of novel ROC analysis methods (Li & Fine 2008, Ogdie et al. 2010) including ROC surface analysis will be explored in the future once a larger number of samples becomes available.
Properties of genes in the biomarker panel
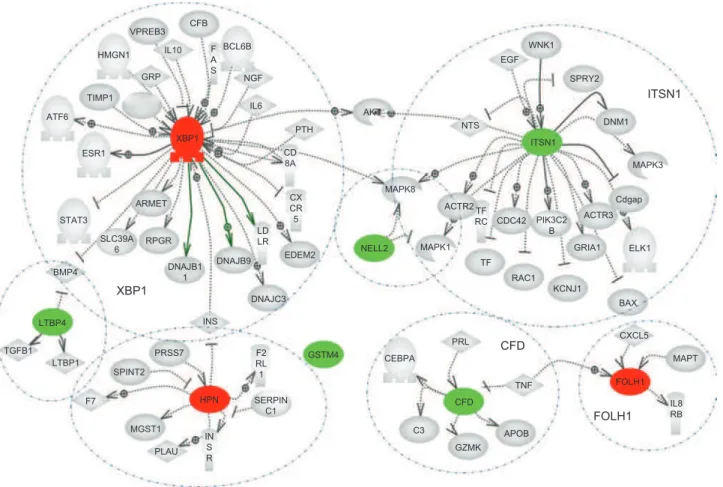
he network analysis of marker genes presented in Figure 8 shows a very general overview of all proteins/ genes con-nected to the marker set either as regulators or as being regulated by the genes in the panel obtained from a detailed literature search. It is clear from this analysis that the marker genes have only a small number of co-regu-lators. herefore, the expression levels of the proposed marker genes are unlikely to be afected by the same processes. Although biological variations in the samples can afect individual gene expression levels, they will not have a common efect on all marker genes. herefore, when the selected group of genes is used as a panel for diagnosis with the method described above, it should be highly resistant to variations in individual genes.
he majority of the determined genes have already been independently analysed for their signiicance in cancer development and for their diagnostic power in prostate cancers. his provides further validation of the selected marker set. All of the genes in the panel that were found to be overexpressed in tumours are known to be highly diagnostic for prostate (hepsin, prostate-speciic membrane antigen and XBP1) as well as breast cancers (XBP1). General analysis of literature search (Pathway
A PC1 56.3% PC2 18.7% B PC1 39.7% PC2 25.5%
Figure 5. Principle component analysis of (A)ive marker genes available in Lapointe experiments (Lapointeet al.2004) and (B) randomly selected ive genes from the same set. Red symbols, lymph node metastasis; green, tumour; blue, normal prostate tissue.
Biomarkers Downloaded from informahealthcare.com by 198.164.42.45 on 10/01/10
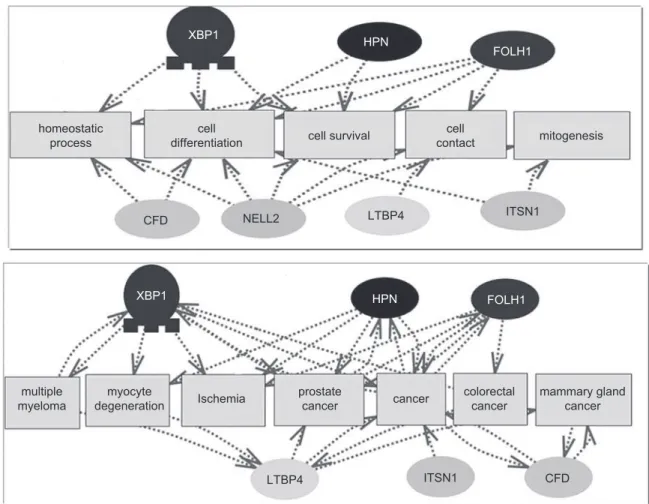
Studio 5.0) looking for published connections between genes in the panel with cancer related processes is shown in Figure 9.
Hepsin (HPN) is a transmembrane protease which plays an essential role in cell growth and maintenance of cell morphology and is proposed as a stimulant of prostate cancer cell proliferation. here is overwhelming evidence in the literature of overexpression of hepsin in prostate cancer. Hepsin has been identiied as a major sig-niicantly diferentially expressed gene in all microarray studies (Nelson 2004) and this result has been independ-ently observed in several hepsin gene analysis publica-tions (Pal et al.2006, Magee et al.2001, Landers et al.2005, Chenet al.2003, Stephen et al.2004). In addition, HPN protein was determined by Northern blot as well as tissue microarray analysis to be a signiicant marker of prostate cancer, with overexpression in about 90% of the cancer samples studied (Dhanasekaran et al.2001). Furthermore, the analyses of single-nucleotide polymorphisms (SNPs) have shown the association of prostate cancer suscepti-bility with the 19q locus, with several SNPs at the location of HPN (Pal et al.2006).
Prostate-speciic membrane antigen (PSMA, PSM or FOLH1), both gene and protein, has also been indi-cated as prostate cancer marker (Mhawech-Fauceglia
et al.2007, Landers et al.2005). PSMA is a membrane-bound glycoprotein that functions as a folate hydrolase with high expression in benign and malignant prostate tissues. he PSMA gene is mapped on the short arm of chromosome 11. Recently published results from the PROGRESS study (Johanneson et al.2007) demonstrated a linkage between hereditary prostate cancers and chro-mosome 11p11.2-q12.2, the location which includes
PSMA. his 750-amino acid protein is expressed in both normal and neoplastic prostate cells, however during the progression of cancer from androgen-sensitivity to androgen-independence, the overall expression of PSMA increases with its appearance in the plasma membrane. In addition, PSMA expression is known to be inversely correlated with the degree of prostatic cancer diferentia-tion. A recent tissue microarray analysis on normal tis-sues and 3161 benign and malignant tumours (Tanguay 2000) has shown that sensitivity and speciicity of PSMA in distinguishing prostate adenocarcinoma from any other type of malignancy is 65.9% and 94.5%, respectively. Furthermore, the sensitivity and speciicity of PSMA in diferentiating prostate cancers from urothelial cancer is 65.9% and 82.9%, respectively.
he inal gene determined as a highly overexpressed marker in prostate tumours is X-box binding protein 1 (XBP1). XBP1 is a basic leucine zipper (bZIP)-containing transcription factor capable of speciic binding to the endoplasmic reticulum stress response element I. XBP-1 is known to be associated to the so-called ‘unfolded protein response’ (UPR) (www.ihop-net.org/UniPub/ iHOP). Changes in the endoplasmic reticulum and UPR can result in changes to secretory and extracellular pro-teins as well as steroids and lipid production and the upregulation of chaperones. mRNA levels of XBP1 were highly elevated in estrogen receptor (ER)-α-positive breast tumours (Lacroix & Leclerc 2004). Furthermore, Oncomine investigation (Rhodes et al.2007) of the XBP1 sequence resulted in several corresponding sequences including known oncogenes Jun, ATF6, Fos, JunB, JunD and Maf. he XBP1 gene is located on chromosome 22q12.1, close to the location of D22S689 that has been indicated as a potentially signiicant genetic marker for hereditary prostate cancers together with many other regions of chromosome 22q12.2 and 22q12.3 (Camp et al.2007). Furthermore, the XBP1 gene and corre-sponding protein have been shown to have an increased expression in organ-conined prostate cancers relative to normal prostate tissues; however XBP1 expression in refractory cancers has been shown to drop relative to both normal and cancer prostate tissues (Takahashi et al.2002). Work of Takahashi et al. (2002) concluded that the expression of XBP1 has an intimate connection with the diferentiation of prostate adenocarcinomas.
In the proposed diagnostic panel, most of the genes that are underexpressed in prostate tumours have also
Normal 14 samples 13 samples 19 samples 0 5 10 15 1 2 3 4 5 20 25 30
Normal Adjacent Tumour
Figure 6. Boxplot of the real-time polymerase chain reaction meas-urements for normal, adjacent-to-tumour and tumour samples. he measurements are presented using the d index – ratio of the average value of all overexpressed relative to average value of all underex-pressed genes ratio measurements.
Biomarkers Downloaded from informahealthcare.com by 198.164.42.45 on 10/01/10
been observed as part of larger groups of signiicantly underexpressed genes in other studies. LTBP4 is one of the isoforms of latent transforming growth factor-beta binding protein (TGF-β). LTBP proteins are believed to be structural components of connective tissue microi-brils and local regulators of TGF-β tissue deposition and signalling. In mouse experiments it has been shown that disrupted expression of LTBP4 results in severe pulmo-nary emphysema, cardiomyopathy and colorectal cancer. hese highly tissue-speciic abnormalities are associated
with profound defects in the elastic ibre structure and with a reduced deposition of TGF-β in the extracellular space. As a consequence, epithelial cells have reduced levels of phosphorylated Smad2 proteins, overexpress c-myc, and undergo uncontrolled proliferation. his phenotype supports the predicted dual role of LTBP4 as a structural component of the extracellular matrix and as a local regulator of TGF-β tissue deposition and signalling (Sterner-Kock et al.2002), suggesting its possible role in prostate cancer. 0 0 0.2 0.4 0.6 0.8 1 0.9 0.2 0.4
False positive rate (1-Specificity) AUC=0.955
ROC curve
True positive rate (Sensitivity)
0.6 ROC curve A Random classifier Cut-off point 0.8 1 0 0 0.2 0.1 0.3 0.4 0.5 0.6 0.7 0.8 1 0.9 0.2 0.4
False positive rate (1-Specificity) AUC=0.80
ROC curve
True positive rate (Sensitivity)
0.6 ROC curve B Random classifier Cut-off point 0.8 1 00 0.2 0.1 0.3 0.4 0.5 0.6 0.7 0.8 1 0.9 0.2 0.4
False positive rate (1-Specificity) AUC=0.591
ROC curve
True positive rate (Sensitivity)
0.6 C
0.8 1
Figure 7. Receiver-operating characteristic (ROC) plots for the classiication accuracy calculation for experimental samples. ROCs were calculated using the d index values. (A) Classiication between normal and tumour samples. he cut-of point represents the classiication sensitivity and speciicity of 90%. (B) Classiication between adjacent-to-tumour and tumour samples. he cut-of point represents the classiication sensitivity and speciicity of 60%. his result shows that adjacent-to-tumour samples are more closely related to normal than tumour samples. (C) Classiication between adjacent-to-tumour and normal samples. Adjacent-to-tumour samples, although altered from completely normal tissues, cannot be used for diagnosing prostate tumours.
Biomarkers Downloaded from informahealthcare.com by 198.164.42.45 on 10/01/10
Although there are limited data about the function and possible signiicance of adipsin, GSTM4, NELL2 and
ITSN1 genes in cancers, once again they are consistently and signiicantly underexpressed in several diferent microarray experiments comparing prostate tumours and normal tissues (Rhodes et al.2002). Similarly to the
HPN gene, both LTBP4 and adipsin are located on chro-mosome 19, with LTBP4 being in the region of known SNPs important for prostate cancer progression (Pal et al.2006).
Neural epidermal growth factor-like 2 gene (NELL2) encodes a cytoplasmic protein that contains epidermal growth factor (EGF)-like repeats. he encoded heterot-rimeric protein may be involved in cell growth regula-tion and diferentiaregula-tion. Although no further analysis has been performed in terms of signiicance in prostate cancer development, the gene expression data for NELL2 consistently shows underexpression in prostate cancers (Rhodes et al.2002).
Finally, glutathione S-transferase M4 is an enzyme involved in the detoxiication of electrophilic compounds, including carcinogens, therapeutic drugs, environmental toxins and products of oxidative stress, by conjugation with glutathione (www.ihop-net.org/UniPub/iHOP/).
he genes encoding the GSTM4 class of gluthathioneS-transferase are organized in a gene cluster on chromo-some 1p13.3 and are known to be highly polymorphic. hese genetic variations can change an individual’s sus-ceptibility to carcinogens and toxins as well as afect the toxicity and eicacy of certain drugs. Diversiication of these genes has occurred in regions encoding substrate-binding domains, as well as in tissue expression patterns, to accommodate an increasing number of foreign com-pounds. Although very little work has been published on the signiicance of GSTM4 in cancers its function in detoxiication might be indicative of its importance in carcinogenesis. We hope that the discovery of GSTM4 as one of the members of the diagnostic panel will initiate further analysis of its involvement in cancer.
In conclusion, high-throughput, i.e. omics meas-urements, provide a treasure trove of data that can be explored, among other applications, for biomarker dis-covery. he selection of a biomarker panel from such a large number of features can lead to a discovery of diferent panels that give a similar level of classiication accuracy in a given data set. It is therefore necessary to validate, i.e. test, the quality of obtained biomarker panels against literature information, published gene expression
XBP1 HPN GSTM4 NELL2 CFD FOLH1 ITSN1 FOLH1 CFD ITSN1 C3 CEBPA GZMK APOB TNF CXCL5 MAPT IL8 RB PRL PLAU MGST1 F7 SPINT2 PRSS7 CFB VPREB3 IL10 GRP HMGN1 TIMP1 ATF6 ESR1 STAT3 BMP4 LTBP4 TGFB1 LTBP1 INS XBP1 ARMET RPGR BCL6B NGF IL6 PTH AKT MAPK8 ACTR2 MAPK1 TF RAC1 KCNJ1 BAX ELK1 GRIA1 ACTR3 Cdgap MAPK3 DNM1 SPRY2 WNK1 EGF NTS CDC42 TF RC PIK3C2 B EDEM2 DNAJB9 DNAJB1 1 DNAJC3 SERPIN C1 CD 8A CX CR 5 LD LR F2 RL 1 IN S R F A S SLC39A 6
Figure 8. Regulators of the analysed genes determined from Pathway Studio literature search (Pathway Studio 7.0). Biomarkers overexpressed in cancer are shown in red and biomarkers underexpressed in cancer are shown in green. Individual regulatory partners are encircled.
Biomarkers Downloaded from informahealthcare.com by 198.164.42.45 on 10/01/10
data and independent experimental measurements. In this study we discovered and validated a panel of eight genes that provides highly sensitive and speciic diagno-sis of prostate tumours. he most accurate diagnodiagno-sis can be made by using all eight genes in the panel, although a smaller subset of the selected genes also provides valid diagnostic information. he inclusion of both over- and under expressed genes provides an internal reference – the diagnosis can be made based on the relative change of expression of over- and underexpressed genes rather than from the absolute expression values based on some predetermined standard. he consistency of expression change across a large number of samples from ten dif-ferent microarray gene expression studies was shown and the sample classiication accuracy validated in two diferent data subsets consisting in total of 91 normal and 114 cancer samples. Experimental validation of this biomarker panel was performed on approximately 50 independent samples using a diferent method, qPCR, for measurement of gene expression. Once again the gene panel showed extremely high speciicity and sensitivity for tumour diagnosis. In the future we will further validate our biomarker panel in ongoing preclinical trials and in
prostate cells obtained from urine samples. We believe that this biomarker panel can provide an objective, fast and inexpensive addition to the pathologists tools for prostate cancer diagnosis.
Declaration of interest
Funding for this project was provided to ACRI by the Atlantic Innovation Fund (ACOA) and the Dr George L. Dumont Hospital Foundation and to the Institute for Information Technology by the National Research Council, Atlantic Initiative.
References
Belacel N, Cuperlovic-Culf M, Lalamme M, Ouellette R. (2004). Fuzzy J-Means and VNS methods for clustering genes from microarray data. Bioinformatics20: 1690–701.
Belacel N, Cuperlovic-Culf M, Ouellette R. (2007). Molecular meth-ods for diagnosis of prostate cancer. US Patent WO2007030919 - 2007-03-22.
Belacel N. (2004). he k-closest resemblance approach for mul-tiple criteria classiication problems. In: HoaiLT, Tao PD,
XBP1 XBP1 HPN HPN FOLH1 FOLH1 homeostatic process multiple myeloma prostate cancer colorectal cancer mammary gland cancer myocyte
degeneration Ischemia cancer
cell differentiation cell contact cell survival CFD CFD NELL2 LTBP4 LTBP4 ITSN1 ITSN1 mitogenesis
Figure 9. Pathway Studio 5.0 analysis of the literature connections between genes from the presented biomarker panel and cancer-related proc-esses and terms.
Biomarkers Downloaded from informahealthcare.com by 198.164.42.45 on 10/01/10
eds.Modelling Computation and Optimization in Information
Systems and Management Sciences. London: Hermes Science Publishing. p. 525.
Belacel N. (2000).Multicriteria assignment method PROAFTN: methodology and medical applications. Eur J Operational Res 125:175–83.
Berger R, Feboo PG, Majumder PK et al. (2004). Androgen-induced diferentiation and tumorigenicity of human prostate epithelial cells. Cancer Res 64:8867–75.
Camp NJ, Cannon-Albright LA, Farnham JM, Bafoe-Bonnie AB, George A et al. (2007). Compelling evidence for a prostate can-cer gene at 22q12.3 by the International Consortium for Prostate Cancer Genetics. Human Mol Genet 16:1271–8.
Chen Z, Fan Z, McNeal JE, Nolley R et al. (2003).Hepsin and mapsin are inversly expressed in laser capture microdisectioned prostate cancer. J Urol 169:1316–19.
Cuperlovic-Culf M, Belacel N, Ouellette R. (2005).Determination of tumour marker genes from gene expression data. Drug Discovery
Today 10:42.
Dasarathy BV. (1991).Nearest Neighbour (NN). Norms: NN Pattern
Classiication Technique. Los Alamitos, CA:IEEE Computer Society Press.
Dhanasekaran SM, Barrette TR, Ghosh D et al. (2001). Delineation of prognostic biomarkers in prostate cancer. Nature 1412:2169–80. Esserman L, Shieh Y, hompson I. (2009). Rethinking screening for
breast cancer and prostate cancer. JAMA 302:1685–92.
Gentleman R, Carey V, Huber W , Irizarry R , Dudoit S (2005).Bioinformatics and Computatonal Biology Solutions Using Bioconductor. Springer.
Graif T, Loeb S, Roehl KA et al. (2007).Under diagnosis and over diag-nosis of prostate cancer. J Urol 178:88–92.
Grutzmann R, Boriss H, Ammerpohl O, et al. (2005). Meta-analysis of microarray data on pancreatic cancer deines a set of commonly dysregulated genes. Oncogene 24:5079–88.
Hessels D, van Gils MPMQ, van Hooij O, Jannink SA, Witjes JA, Verhaegh GW, Schalken JA. (2010).Predicitive value of PCA3 in urinary sediments in determining clinico-pathological charac-teristics of prostate cancer. Prostate 70:10–16.
Holzbeierlein J, Lal P, La Tulippe E, Smith A, Satagopan J, et al. (2004). Gene expression analysis of human prostate carcinoma during hormonal therapy identiies androgen-responsive genes and mechanisms of therapy resistance. Am J Pathol 164:217–27. Irizarry RA, Boltstad BM, Collin F, Cope LM, Hobbs B, Speed TP.
(2003). Summaries of AfymetrixGeneChip Probe Level Data.
Nucl Acids Res 31:e15.
Johanneson B, Deutsch K, McIntosh L, Friedrichsen-Karyadi DM, Janer M,Kwon EM, Iwasaki L, Hood L, Ostrander EA, Stanford JL. (2007). Suggestive genetic linkage to chromosome 11p11.2-q12.2 in hereditary prostate cancer families with primary kidney cancer. Prostate 67:732–42.
Karan D, Lin M, Johansson SL, Batra SK. (2003). Current status of the molecular genetics of human prostateic adenocarcinomas. Int J
Cancer 103:285–93.
Lacroix M, Leclercq G. (2004). About GATA3, HNF3A and XBP1,three genes co-expressed with the oestrogen receptor-a gene (ESR1). in breast cancer. Mol Cell Endocrinology 219:1–7.
Landers KA, Burger MJ, Tebay MA, Purdie DM, Scells B, Samaratunga H, Lavin MF, Gardiner RA. (2005). Use of multi-ple biomarkers for a molecular diagnosis of prostate cancer. Int
J Cancer 114:950–6.
Lapointe J, Li C, Higgins JP et al. (2004). Gene expression proil-ing identiies clinically relevant subtypes of prostate cancer.
ProcNatlAcadSci USA 101:811–16.
La Tulippe E, Satagopan J, Smith A, Scher H, Scardino P, Reuter V, Gerald WL. (2002). Comprehensive gene expression analysis of prostate cancer reveals distinct transcriptional programs associ-ated with metastatic disease. Cancer Res 62:4499–506.
Li S, Bhamre S, Lapointe J, Pollack JR, Brooks JD.(2006). Application of genomic technologies to human prostate cancer. Omics 10:261–75.
Li J, Fine JP. (2008). ROC analysis with multiple tests and multiple classes: methodology and applications in microarray studies.
Biostatistics 9:566–76.
Luo J, Duggan DJ, Chen Y, et al. (2001). Human prostate cancer and benign prostatic hyperplasia: molecular dissection by gene expression proiling. Cancer Res 60:858–63
Magee JA, Araki T, Patil S, Ehrig T et al. (2001). Expression proiling reveals hepsin overexpression in prostate cancer. Cancer Res 61:5692–6.
Mhawech-Fauceglia P, Zhang S, Terracciano L, Sauter G, Chadhuri A, Herrmann FR, Penetrante R. (2007). Prostate-speciic membrane antigen (PSMA).Protein expression in normal and neoplastic tissues and its sensitivity and speciicity in prostate adenocarci-noma. Histopathology 50:472–83.
Nelson PS. (2004). Predicting prostate cancer behavior using transcript proiles. J Urol 172:828–33.
Ogdie A, Li J, Dai L, YuX, Daiz-Torne C, Schumacher HR, Pessler F. (2010). Identiication of broadly applicable tissue biomarkers of synovitis with binary and multi-category receiver operating characteristic analysis. Biomarkers 15:183–90.
Pal P, Kaushal R, Sun G, Jin CH, et al. (2006). Variants in the HEPSIN gene are associated with prostate cancer in men of European ori-gin. Human Genet 120:187–92.
Peehl DM. (2005). Primary cell cultures as models of prostate cancer development. EndocrinolRel Cancer 12:19–47.
Pfal MW. (2001). A new mathematical model for relative quantiica-tion in real-time RT PCR. Nucl Acid Res 29:e45.
Rhodes DR, Barrette TR, Rubin MA et al. (2002). Meta-analysis of microarrays: interstudy validation of gene expression proiles reveals pathway dysregulation in prostate cancer. Cancer Res 62:4427–33.
Rhodes DR, Kalyana-Sundaram S, Mahavisno V, Varambally R, Yu J, Briggs BB, Barrette TR, Anstet MJ, Kincead-Beal C, Kulkarni P, Varambally S, Ghosh D, Chinnaiyan AM. (2007). Oncomine 3.0: genespathwaysand networks in a collection of 18 000 cancer gene expression proiles. Neoplasia 9:166–80.
Rose A, Xu Y, Chen Z, et al. (2005).Comparative gene and protein expression in primary cultures of epithelialcells from benign pro-static hyperplasia and prostate cancer.Cancer Lett 227:213–22. Singh D, Febbo PG, Ross K, et al. (2002). Gene expression correlates of
clinical prostate cancer behaviour. Cancer Cell 2:203–9. Stephen C, Yousef GM, Scorilas A, Jung K, et al. (2004).Hepsin is highly
over expressed in and a new candidate for a prognostic indicator in prostate cancer. J Urol 171:187–91.
Sterner-Kock A, horey IS, Koli K, Wempe F,Otte J, Bangsow T, Kuhlmeier K, Kirchner T, Jin S, Keski-Oja J, von Melchner H. (2002).Disruption of the gene encoding the latent transforming growth factor-beta binding protein 4 (LTBP4). causes abnormal lung development, cardiomyopathy, and colorectal cancer. Genes
Dev 16:2264–73.
Takahashi S, Suzuki S, Inaguma S, Ikeda Y, et al. (2002). Down-regulation of human X-box binding protein I expression corre-lates with tumor progression in human prostate cancers. Prostate 50:154–61.
Tanguay S. (2000).he role of complexed PSA and percent free PSA in prostate cancer detectionprostate update.he Canadian Prostate
Health Council 5.
Tomlins SA, Mehra R, Rhodes DR, Cao X et al. (2007). Integrative molecular concept modeling of prostate cancer progression.
Nat Genet 39:41–51.
Tusher VG, Tibishirani R, Chu G. (2001). Signiicance analysis of micro-arrays applied to the ionizing radiation response. ProcNatlAcadSci
USA 98:5116–21.
Vanaja DK, Cheville JC, Iturria SJ, Young CY. (2003). Transcriptional silencing of zinc inger protein 185 identiied by expression pro-iling is associated with prostate cancer progression. Cancer Res 63:3877–82.
Varambally S, Dhanasekharan S, Zhou M, et al. (2002). he polycomb group protein EZH2 is involved in progression of prostate cancer.
Nature 419:624–9.
Welsh JB, Sapinosos LM, Su AI, et al. (2001). Analysis of gene expres-sion identiies candidate markers and pharmacological targets in prostate cancer. Cancer Res 61:5974–8.
Yu YP, Landsittel D, Jing L, et al. (2004). Gene expression alterations in prostate cancer predicting tumor aggression and preceding development of malignancy. J ClinOncol 22:2790–9.
Biomarkers Downloaded from informahealthcare.com by 198.164.42.45 on 10/01/10