HAL Id: hal-00806063
https://hal.archives-ouvertes.fr/hal-00806063
Submitted on 29 Mar 2013
HAL is a multi-disciplinary open access
archive for the deposit and dissemination of
sci-entific research documents, whether they are
pub-lished or not. The documents may come from
teaching and research institutions in France or
abroad, or from public or private research centers.
L’archive ouverte pluridisciplinaire HAL, est
destinée au dépôt et à la diffusion de documents
scientifiques de niveau recherche, publiés ou non,
émanant des établissements d’enseignement et de
recherche français ou étrangers, des laboratoires
publics ou privés.
Intergranular Corrosion of 2024 Alloy in Chloride
Solutions
Christel Augustin, Eric Andrieu, Christine Blanc, Georges Mankowski, Jérôme
Delfosse
To cite this version:
Christel Augustin, Eric Andrieu, Christine Blanc, Georges Mankowski, Jérôme Delfosse. Intergranular
Corrosion of 2024 Alloy in Chloride Solutions. Journal of The Electrochemical Society, Electrochemical
Society, 2007, vol. 154, pp.C637-C644. �10.1149/1.2778224�. �hal-00806063�
O
pen
A
rchive
T
oulouse
A
rchive
O
uverte (
OATAO
)
OATAO is an open access repository that collects the work of Toulouse researchers and
makes it freely available over the web where possible.
This is an author-deposited version published in:
http://oatao.univ-toulouse.fr/
Eprints ID : 2427
To link to this article :
URL :
http://dx.doi.org/10.1149/1.2778224
To cite this version :
Augustin, Christel and Andrieu, Eric and Blanc, Christine
and Mankowski, Georges and Delfosse, Jérôme ( 2007)
Intergranular Corrosion
of 2024 Alloy in Chloride Solutions.
Journal of The Electrochemical Society
(JES), vol. 154 (n° 11). C637-C644. ISSN 0013-4651
Any correspondence concerning this service should be sent to the repository
administrator:
staff-oatao@inp-toulouse.fr
Intergranular Corrosion of 2024 Alloy in Chloride Solutions
Christel Augustin,aEric Andrieu,a Christine Blanc,a,
*
,zGeorges Mankowski,a and Jérôme Delfosseb
a
CIRIMAT, UMR CNRS 5085, ENSIACET, 31077 Toulouse Cedex 04, France b
EADS Innovation Works–IW/MS/MM, 92152 Suresnes Cedex, France
Experiments were performed to determine the propagation kinetics of intergranular corrosion on 2024 aluminum alloy immersed in 1 and 3 M chloride solutions. Tests consisting of immersion in a corrosive solution followed by optical observations on sectioned samples were carried out. This method was found to be time consuming and led to a lack of reproducibility due to the random nature of the corrosion attacks. Another method proved to be more efficient; it consisted of measuring the load to failure on precorroded tensile specimens vs preimmersion time in an aggressive environment. This method was found to allow the mean depth of the corrosion defects to be determined. Further, in 1 and 3 M chloride solution, intergranular corrosion led to the formation of a nonbearing zone, the thickness of which was equal to the mean depth of the corrosion defects. This corroded zone explained the premature failure of the specimens when a uniaxial tensile stress was applied.
关DOI: 10.1149/1.2778224兴
High strength aluminum alloys such as those of the 2xxx series are widely used in the aeronautical industry because of their low density and high specific strength. But, these alloys are susceptible to localized corrosion in chloride media such as pitting corrosion,1,2 intergranular corrosion,3,4 exfoliation,5 and stress corrosion cracking.6,7
The localized corrosion sites are found in different locations on aircraft共fuselage skin, for example兲. Currently, zero damage is de-manded; it means that all the corrosion damage detected is repaired, which implies high maintenance costs. To reduce these costs, alter-native solutions are under study; one is to determine the growth kinetics of the corrosion damage so as to optimize the maintenance procedure of the aircraft structures affected.
Pitting and intergranular corrosion共IGC兲 susceptibility of 2xxx series Al alloys have been studied for decades.3,8-10IGC starts with the dissolution of the S phase particles共Al2CuMg兲 on grain bound-aries caused by the galvanic couples solute-depleted zone/ surrounding matrix and solute-depleted zone/S phase particles.11 Subsequently, IGC propagates by the dissolution of the copper-depleted zone along the grain boundaries.12
Many authors have determined the kinetics of IGC damage growth using different methods. Zhang and Frankel used the foil penetration technique to measure the time for the fastest-growing localized corrosion site to penetrate foils of various thicknesses.13,14 They highlighted different kinetics of damage, considering the di-rection of growth, as a consequence of the microstructural aniso-tropy共slower kinetics in the short transverse direction兲. Moreover, they enriched this study with the development of a statistical model to predict the anisotropy of IGC kinetics and the effects of microstructure.15
In situ X-ray radiography was used by Zhao et al. to characterize IGC and exfoliation in high-strength Al alloys.4 They found that growth kinetics for IGC sites are slower than those determined by the foil penetration technique. In situ X-ray radiography not only considers the fastest growing site but also takes a wide range of growth kinetics into account. Microfocal X-ray radiography was also used to characterize the transition from intergranular corrosion to intergranular stress corrosion cracking.16
To determine the kinetics of sharp IGC cracks in AA7178,17 Huang and Frankel developed an approach based on sectioning and visual observations. Their method provides the growth rate of long sharp IGC cracks and not only the rates of the fastest growing sites. The above methods do have their limitations. For example, sec-tioning does not take into account the three-dimensional共3D兲
mor-phology of the damage. Furthermore, there is no information about which parameter is the most damaging, the fastest growing defect or the average depth of all the growing defects.
This article presents an approach to characterize the IGC suscep-tibility of alloy 2024 T351 in chloride media. The method used, based on the decrease of the mechanical properties of precorroded specimens, has been successfully used by Garat et al. to study the intergranular oxidation damage on a nickel-based superalloy.18 In the present study, this method provides results on the role of the nonbearing zone. Results are compared to those obtained with clas-sical immersion and sectioning tests.
Experimental
Materials.— A 2024 T351 rolled plate 共wt %: Cu 4.50%, Mg
1.44%, Mn 0.60%, Si 0.06%, Fe 0.13%, Zn 0.02%, and Ti 0.03%兲 50 mm thick was provided by EADS. The T351 temper is obtained by solid-solution heat-treatment at 495°C共±5°C兲, water quenching, straining and tempering at room temperature for four days. To reveal the microstructure, electrochemical etching was performed followed by observations with an optical microscope. The specimen was me-chanically polished with up to 4000 grit SiC papers and to 1m with diamond paste on the three principal faces共Fig. 1兲. Electro-chemical etching was then conducted with HBF4 共3.5 vol %兲 in distilled water共96.5 vol %兲 for 80 s 共twice 40 s兲 under 20 V at room temperature. Examination was performed with an optical mi-croscope under polarized light. The three main directions are re-ferred to as L 共longitudinal兲, LT 共long transverse兲 and ST 共short transverse兲. Figure 1 illustrates the elongated grain structure of the
*Electrochemical Society Active Member.
z
E-mail: christine.blanc@ensiacet.fr
Figure 1. 共Color online兲 Optical observation of a 2024 T351 rolled plate
2024 T351 rolled plate. The average grain sizes in the L, LT, and ST directions are, respectively, 700, 300, and 100m. In addition, second-phase particles such as Al2CuMg 共S phase particles兲 and Al–Cu–Mn–Fe particles, can be distinguished. Complementary transmission electron microscopy examinations revealed the pres-ence of dispersoids共Al20Mn3Cu兲 in the matrix and Al2CuMg par-ticles on grain boundaries in good agreement with the literature.11
Intergranular corrosion tests.— In this study, two types of
sample were used. First, cubic samples共10 ⫻ 10 ⫻ 10 mm兲 ma-chined in the 2024 T351 plate were degreased in ethanol; then the faces perpendicular to the corrosion damage growing direction共L,
LT, and ST directions兲 were mechanically polished with up to 4000
grit SiC paper in water, followed by ultrasonic cleaning in ethanol and air drying. Second, tensile specimens were machined from the plate thickness using conventional methods. Figure 2 presents the dimensions and the characteristic directions of the tensile speci-mens. Previous to any exposure to an aggressive solution, the sample surfaces were prepared following the same procedure as for the cubic samples.
Both types of sample共cubic and tensile specimens兲 were then exposed to NaCl solutions at two different concentrations共1 and 3 M兲. The first chloride solution 共1 M兲 corresponds to a classic chloride content for intergranular corrosion tests. A higher chloride content was also used to reproduce what happens during alternate immersion and emersion periods共or drying effects兲 which lead to highly concentrated chloride solutions. The solution temperature was maintained at 25 ± 2°C assisted by a thermostated water bath. Exposure time varied from 12 h to seven days. After immersion, the samples were ultrasonically cleaned in ethanol, air dried, and stored in a desiccator.
Cubic samples were then sectioned with a diamond disk cutter perpendicularly to the corroded faces as explained in Fig. 3. The cross sections were examined by optical microscopy after being me-chanically polished with up to 4000 grit SiC papers and with dia-mond paste up to 1m.
Tensile tests.— For the tensile tests, a 30 kN Instron 3367 testing
machine was used. Displacement rate was imposed so that the strain rate was close to 10−3s−1. The mechanical properties which were considered during the test are the load and the strain to failure. In the present case, the load is more relevant than the stress since the tensile specimens were not considered as volume elements of con-tinuum mechanics but as damaged structural elements. The tests led
up to the failure of the tensile specimens stressed along the ST direction. Ten uncorroded tensile samples were tested to establish the reference curve.
Current-potential curves.— The tests consisted of the
potentio-kinetic polarization of the samples from the cathodic potential of −900 mV/saturated calomel electrode共SCE兲 to the highest potential of −400 mV/SCE. The potential sweep rate was 500 mV h−1. All potentials quoted are relative to the saturated calomel electrode. The counter electrode was platinum. Before polarization, the specimen was mechanically polished with up to 4000 grit SiC papers and to 1m with diamond paste.
Results and Discussion
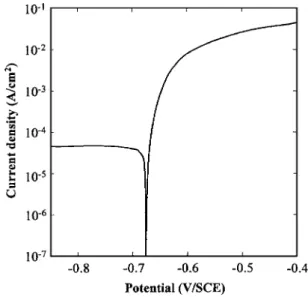
Preliminary tests.— Figure 4 shows a current-potential curve
plotted for 2024 aluminum alloy in 1 M NaCl solution. The exposed surface corresponded to the LT-ST plane. The curve only exhibited one breakdown potential corresponding to the corrosion potential at −0.68 V/SCE. Optical observations of the electrode after the experi-ments showed that this breakdown potential was related to localized corrosion on 2024 aluminum alloy, i.e., pitting corrosion and inter-granular corrosion. In the cathodic part, the curve presented a well-defined plateau for a current density of 5.10−5A cm−2 correspond-ing to cathodic oxygen reduction.
These results thus proved that the 2024 alloy used in this study, immersed at the corrosion potential in 1 M NaCl solution, was sus-ceptible to intergranular corrosion. Additional experiments were per-formed to compare the current-potential curves obtained for the two other planes of the plate with that obtained for the LT-ST plane. Figure 2. Tensile specimens for immersion test共all dimensions in mm兲.
Figure 3. Notation and configuration for an immersion sample. The shaded
area corresponds to the polished and corroded face.
Figure 4. Current-potential curve for a 2024 T351 alloy sample 共LT-ST
Reproducibility of the different curves was checked and the results did not show any differences between the three planes. Thus, for these experimental conditions, plotting the current-potential curves did not allow the susceptibility to intergranular corrosion of the three characteristic planes of the rolled plate to be distinguished. Furthermore, the results were compared to those obtained by Guil-laumin and Mankowski.11For the same experimental conditions, but for another batch, they showed that the current-potential curves re-vealed two breakdown potentials, one related to dissolution of
S-phase particles and the other one to pitting and intergranular
cor-rosion. Zhang and Frankel also observed two breakdown potentials on the current-potential curves plotted for 2024 alloy in chloride solutions: the first breakdown potential was related to S-phase dis-solution as reported by Guillaumin and Mankowski but the second one was only related to intergranular corrosion.12Guillaumin and Mankowski also showed that the shape of the current-potential curves, i.e., the number of breakdown potentials, was related to the surface area of the sample.11 With a very small area, they only observed one breakdown potential. Indeed, they showed that, on a given sample, not all the particles reacted at the same time. With a small area, due to the low number of particles, the anodic current related to S-phase dissolution was very low and thus only one break-down potential was observed. Hence, it can be assumed that the differences between the results presented here and those obtained by Guillaumin and Mankowski were related to the volumic fraction of
S-phase particles in the material.
Intergranular immersion tests.— Immersion tests were per-formed on cubic samples to study the propagation kinetics of inter-granular corrosion in 2024 alloy. After immersion, the samples were sectioned and observed by means of an optical microscope. Figures 5a-c show optical micrographs obtained on 2024 alloy after different immersion times, i.e. 24, 72, and 168 h in 1 M NaCl solution. In-tergranular corrosion was observed on all samples. Comparison be-tween these micrographs shows that propagation of intergranular corrosion corresponded not only to an increase of the depth of the corrosion attacks but also to an increase of the width of the attacks which was confirmed by scanning electron microscopy observations 共Fig. 5d兲. After 168 h, the size of the defect observed on the micro-graph was 300m in depth and more than 50 m in width. For a given experimental condition, such observations were performed on at least four sections to take into account problems related to the random nature of the corrosion process共Fig. 3兲. All the corrosion attacks were counted and their depths measured. Consequently, this allowed a statistical approach to be performed: for each experimen-tal condition, the distribution of the depths of the corrosion defects was plotted. Two types of representation were studied: the first rep-resented the cumulative probability vs the depth of the corrosion defects and the second the cumulative probability vs the logarithm of the depth of the corrosion defects. Figure 6 shows an example of such distributions obtained for samples immersed for seven days in 1 M NaCl. Figure 6a showed that the cumulative probability did not vary linearly with the depth of the corrosion defects while a linear variation was observed in the second case共Fig. 6b兲. Whatever the experimental conditions, the same observations were made. As a consequence, the average depth of the corrosion defects had to be calculated by considering the logarithm of the depth for all defects. Furthermore, extrapolation of the straight line observed in Fig. 6b for a probability of 100% allowed the maximum depth of the cor-rosion defects to be estimated. Figures 7-9 show the average depth, the maximum depth and the average density, respectively, of inter-granular corrosion defects vs immersion time in 1 and 3 M NaCl solutions. The average depth of the corrosion defects was calculated as explained previously. For the maximum depth of the corrosion defects, estimated values from the distributions were compared to values resulting from the observations of the different sections, the depth of all defects observed on the different sections being mea-sured. The defect density was related to the number of grain bound-aries involved; it was expressed as the ratio between the number of
grain boundaries actually corroded and the number of grain bound-aries present. Figure 7 shows that the average depth of the corrosion defects increased as the immersion time in chloride solution in-creased for both chloride concentrations. No significant difference was observed between the values obtained in a 1 M chloride solu-tion and those in 3 M chloride solusolu-tion. In both cases, the average depth of the corrosion defects seemed to stabilize after 168 h of immersion, close to a value of 140m. For both concentrations, the values obtained after 72 h of immersion seemed to be too high by comparison to the others. This was related to the random nature of the corrosion attacks and probably to the random nature of their initiation time. Similarly, Fig. 8 shows that the maximum depth of the corrosion defects observed increased strongly in 3 M chloride solution as the immersion time increased, from a value of 275m after 12 h of immersion to a value of 750m after 168 h. In 1 M chloride solution, the maximum depth of the corrosion defects also increased as the immersion time increased but did not exceed a value of 500m. Comparison of measured values of the maximum depth with the values estimated from the distributions showed that there was a good agreement between the two sets of values共only the estimated value in 1 M NaCl solution after 72 h of immersion seemed to be incorrect兲. Problems related to the random nature of Figure 5. Intergranular corrosion defects observed on 2024 T351 alloy after
immersion in 1 M NaCl solutions for共a兲 24, 共b兲 72, and 共c兲 168 h at 25°C using an optical microscope.共d兲 SEM observations of intergranular corrosion defects observed after immersion for 168 h.
the corrosion attack are also observed in Fig. 9 for a 1 M chloride concentration: the density of damage sites increased irregularly as the immersion time increased in 1 M chloride solution while, for a 3 M chloride solution, the average density of corrosion defects in-creased more regularly as the immersion time inin-creased. The results thus show that determining the propagation kinetics of intergranular corrosion by sectioning and observing precorroded specimens needs a statistical approach due to the random nature of the corrosion attacks and thus the lack of reproducibility of the results. This is highly time consuming. Here, at least four sections were systemati-cally analyzed which corresponded to extensive experimental work but even this was not enough. Further, Fig. 10 shows an optical micrograph of an AA2024 LT-ST plane after 24 h of immersion in 1 M NaCl. Numerous intergranular corrosion sites were observed over the whole surface. Particular attention was paid to three of them in order to study the geometry of the corrosion defects. Optical observations of these attacks were performed after different steps of polishing to accurately determine their depth: a 15m step and even sometimes less was selected. Figure 11 shows optical observa-tions of one corrosion defect after polishing periods corresponding to different amounts of material removed, i.e., a removed thickness from 2 to 600m. Comparison of micrographs e and f shows that
the maximum depth of this corrosion defect was around 600m since on micrograph f, some attacked grain boundaries are still vis-ible. In Fig. 8, the maximum corrosion depth for a one-day immer-sion in 1 M NaCl was only 150m. This result confirms that de-termining the propagation kinetics of intergranular defects by sectioning and observing precorroded samples requires a very large number of samples to be observed. Such a method is thus highly time consuming and, with a reasonable number of samples, it allows only descriptive results to be obtained. In addition, it does not allow the 3D structure of the corrosion defects to be considered.
Tensile tests.— Tensile specimens were dimensioned, taking into
account the previous results, in order for intergranular corrosion to lead to a significant effect on the mechanical properties of the speci-mens. Figure 12 shows the maximum load and the strain to failure of specimens precorroded during different immersion times in 1 or 3 M chloride solution. For each experimental condition, three ten-Figure 6. Cumulative probability vs共a兲 the depth and 共b兲 the logarithm of
the depth of intergranular corrosion defects in 2024 T351 alloy after seven days of immersion in 1 M NaCl solutions at 25°C共L direction兲.
Figure 7. Average depth of intergranular damage in 2024 T351 alloy共L
direction兲 after different immersion times in 1 and 3 M NaCl solutions at 25°C.
Figure 8. Maximal depth of intergranular corrosion damage in 2024 T351
alloy共L direction兲 after different immersion times in 1 M NaCl and 3 M NaCl solutions at 25°C.
sile specimens were precorroded and then submitted to a tensile test. Figure 12a shows that, for both chloride concentrations, the load to failure significantly decreased as the immersion time increased. The choice for the dimensions of the tensile specimens proved to be suitable since immersion for 24 h in 1 M chloride solution led to a load to failure decrease from 6.5 kN for a noncorroded specimen to 5.4 kN for this corroded sample. For both concentrations, the load to failure decreased significantly during the first 24 h and then more slowly which was well correlated with the variation of the mean depth or the maximum depth of the corrosion defects vs immersion time shown in Fig. 7 and 8. Comparison of the results obtained for the two chloride concentrations shows also that, whatever the im-mersion time, the load to failure for a specimen immersed in 3 M chloride solution was lower than that for a specimen immersed in 1 M chloride solution. This strongly suggested that, for a given im-mersion time, intergranular corrosion, seen as the mean depth of the corrosion affected zone, propagated faster in 3 M chloride solution than in 1 M solution even though similar observations had not been made with sectioned samples. In parallel, Fig. 12b shows that im-mersion in chloride solution also rapidly led to a decrease in the strain to failure from 14.5% for a noncorroded specimen to 4.5%
after immersion for 168 h in 3 M chloride solution. The influence of the chloride content on the susceptibility to intergranular corrosion was again shown with strain to failure values lower for 3 M chloride than for 1 M chloride whatever the immersion time.
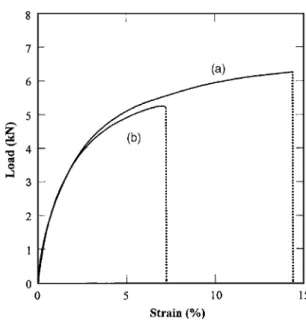
The present results thus showed that immersion in chloride solu-tion induced a significant decrease of the mechanical properties of the 2024 alloy. Comparison of Fig. 12a and b showed that the strain to failure decreased more rapidly as the immersion time increased than the maximum load. This suggests the existence of a critical length for the intergranular corrosion defects corresponding to a reduced ductility for AA2024 alloy. Other authors obtained similar results. Pantelakis et al. showed that, after immersion in different aggressive solutions such as ASTM G110-92, a decrease of the ul-timate stress and of the strain to failure was observed for various aluminum alloys such as 2024 alloy by comparison to results ob-tained on reference samples.19They also showed that the mechani-cal properties decreased as the immersion time increased following a nonlinear law. Furthermore, Petroyiannis et al. showed that the decrease of the ductility of 2024 alloy was attributed not only to the depth of the corroded zone, but also to the embrittlement induced by the hydrogen penetration.20But, the question now was to determine how homogeneously the corrosion damage was distributed in the tensile specimens. It was seen in Fig. 10 that corrosion defects seemed to be homogeneously distributed over the whole surface of the cubic sample. Furthermore, comparison of the load/strain curves obtained for an uncorroded specimen and for a specimen immersed for 72 h in a 1 M chloride solution showed that, even though the load and the strain were lower for the corroded specimens, the gen-eral shape of the curves was similar with no necking observed in either case共Fig. 13兲. The same results were obtained whatever the immersion test conditions. Observations of the tensile specimens after failure confirmed that there was no localization of deformation during the tensile tests共Fig. 14兲. Further, Fig. 14 showed that the corrosion damage was homogeneously distributed over the whole surface of the tensile specimen which is in good agreement with the very homogeneous distribution of corrosion damage observed in Fig. 10. It was thus assumed that, from a mechanical point of view, intergranular corrosion led to the presence in the material of a non-bearing zone. As the effective non-bearing area is decreased, the load to failure for a corroded specimen will decrease too. Following this assumption, the propagation of intergranular corrosion can be con-Figure 9. Ratio of damaged sites to potential sites for 2024 T351 alloy共L
direction兲 after different immersion times in 1 M NaCl and 3 M NaCl solu-tions at 25°C.
Figure 10. A corroded LT-ST face on 2024 T351 alloy after 24 h of
immer-sion in a 1 M NaCl solution at 25°C.
Figure 11. Three-dimensional description of an intergranular corrosion
de-fect in 2024 T351 alloy共LT-ST face兲 after 24 h of immersion in a 1 M NaCl solution at 25°C. The sample was mechanically polished to progressively remove共a兲 2, 共b兲 70, 共c兲 120, 共d兲 240, 共e兲 460, 共f兲 600 m.
sidered as the growth of the thickness of the nonbearing zone along the whole length of the tensile specimens. Figure 15 gives a descrip-tion of this approach: due to specimen geometry, the decrease of the bearing area was assumed to be essentially related to the propaga-tion of intergranular corrosion on the large sides of the secpropaga-tion. From this description of the corrosion damage and the results given in Fig. 12, it was then possible to calculate the thickness of the corroded zone, called x共t兲, vs the time of immersion in chloride solution. As a consequence of this type of approach, it was assumed that the stress to failurefail共ultimate stress兲 was a constant char-acteristic of the material. Thus, for an uncorroded specimen, this constant is given by the following equation
fail= Lfail/共ba兲 = constant 关1兴 where Lfailwas the maximum load to failure and a and b were the dimensions of the tensile specimen as given in Fig. 2.
For a corroded specimen, the equation became
fail= Lfail共t兲/关b共a − 2x共t兲兲兴 关2兴 where Lfail共t兲 was the maximum load to failure measured for a pre-corroded specimen 共t = immersion time兲. As x共t兲 was negligible compared to the dimensions of the tensile specimens, the following equation was obtained
x共t兲 = 关1 − 共Lfail共t兲/Lfail兲兴共a/2兲 关3兴
Figure 16 shows the depth of the corrosion defects, x共t兲, for samples immersed in 1 and 3 M chloride solutions, calculated from the load vs immersion time curve 共Fig. 12兲. For both concentrations, the depth of the corrosion defects increased as the immersion time
in-Figure 12. Evolution of共a兲 the maximum load and 共b兲 the strain to failure
for 2024 T351 tensile specimens corroded in 1 and 3 M NaCl solutions for different times at 25°C.
Figure 13. Load/strain curves for共a兲 an uncorroded 2024 T351 alloy sample
and共b兲 a 2024 T351 alloy sample after 72 h of immersion in a 1 M NaCl solution at 25°C.
Figure 14. Observation of a 2024 T351 tensile specimen after failure. The
specimen had been corroded in a 1 M NaCl solution for seven days at 25°C.
Figure 15. Section of a tensile specimen after immersion in a NaCl solution.
The shaded area corresponds to the corroded zones关thickness x共t兲 varying with immersion time兴.
creased. The fact that values obtained in 3 M chloride solution were slightly higher than those in 1 M chloride solution was attributed to the increased aggressiveness of the former solution. The curves showing the maximum measured depth and the average depth of the corrosion defects vs immersion time calculated with cubic samples 共Fig. 7 and 8兲 are also reported in Fig. 16. It was demonstrated that, for both concentrations, there was a good agreement between the depth of the corrosion defects calculated from the tensile experi-ments and the mean depth calculated by sectioning immersed samples. These results thus showed first that it was possible to de-termine the propagation kinetics of intergranular corrosion using a method which was less time consuming than the conventional ap-proach based on observations of sectioned samples after immersion tests. This method consisted of measuring the decrease of the me-chanical properties共maximum load to failure兲 of precorroded tensile specimens vs immersion time in the aggressive solution. In addition, these results also indicated that the corrosion defects which induced the mechanical failure of the specimens during a uniaxial tensile test corresponded to the mean damage. In service, when a corroded part is submitted to uniaxial mechanical loading共tensile兲, the mean depth of the intergranular corrosion defects previously propagated corre-sponds to a dead zone. This leads to a decrease of the bearing area of the structural part and thus to a premature failure. The results shown in Fig. 16 suggest that defects with a depth greater than the mean depth did not have a significant effect on the mechanical behavior of the damaged specimens with uniaxial mechanical loading. To
con-firm this assertion, additional experiments were performed using the same approach. Tensile specimens were precorroded in a 1 M chlo-ride solution for 24 h. They were then polished to remove a thick-ness equal to the corroded zone and finally submitted to a tensile test. Tensile tests were also performed on uncorroded specimens. Figure 17 presents the results obtained after the tensile tests on uncorroded and corroded specimens. Results obtained on specimens corroded for 24 h in 1 M chloride solution are superimposed for comparison. Figure 17 shows the measured ultimate stress for the three types of sample. This value was expressed using the apparent section and not the effective section of the specimen; for an uncor-roded specimen, the two values are the same but, for a coruncor-roded specimen for which the corroded zone was not removed, the effec-tive section was equal to the apparent section minus the nonbearing zone affected by intergranular corrosion. The ultimate stress was significantly reduced for a corroded specimen by comparison to an uncorroded one. When the corroded zone was removed, a complete recovery of the measured ultimate stress occurred, confirming the previous interpretation. These observations are in agreement with results obtained by Pantelakis et al.19Furthermore, a partial recov-ery of the strain to failure共only 51.9% of the value obtained for the noncorroded specimen兲 after the removal of the corroded zone was also observed. This reduced ductility was attributed, as said previ-ously and as shown by Petroyiannis et al., to the embrittlement induced by the hydrogen penetration.20The next step would be to determine, with more complex mechanical loading, the parameters relevant for damage 共mean depth, maximum depth, or density of defects兲 which have to be considered in failure analysis of structural elements.
Conclusion
Experiments were performed to determine the propagation kinet-ics of intergranular corrosion on 2024 aluminum alloy immersed in chloride solutions. The tests consisted of immersion in corrosive solution followed by sectioning and observation of the samples us-ing optical microscopy. The method was found to be time consum-ing and led to a lack of reproducibility due to the random nature of the corrosion attacks. Another method proved to be more efficient: it consisted of measuring the load to failure on precorroded tensile specimens vs immersion time in an aggressive environment. The results showed that this method allowed the mean depth of the cor-rosion defects to be determined. Moreover, in 1 and 3 M chloride solution, intergranular corrosion led to the growth of a nonbearing zone the thickness of which was equal to the mean depth of the Figure 16. Maximum depth, average depth and calculated damaged depth of
2024 T351 alloy samples immersed in共a兲 1 M and 共b兲 3 M NaCl solutions for different immersion times at 25°C.
Figure 17. Degradation of tensile properties after immersion in 1 M NaCl
solutions at 25°C,共a兲 uncorroded specimen as reference, 共b兲 specimen after 24 h of immersion and共c兲 specimen after 24 h of immersion and polishing off of the corroded zones.
corrosion defects. This corroded zone explained the premature fail-ure of the specimens when uniaxial tensile stress was applied.
Acknowledgments
This work was supported by EADS CCR France and DGA. Centre National de la Recherche Scientific assisted in meeting the pub-lication costs of this article.
References
1. Z. Szklarska-Smialowska, Corros. Sci., 41, 1743共1999兲.
2. J. W. J. Silva, A. G. Bustamante, E. N. Codaro, R. Z. Nakazato, and L. R. O. Hein,
Appl. Surf. Sci., 236, 356共2004兲.
3. A. Garner and D. Tromans, Corrosion (Houston), 35, 55共1979兲.
4. X. Zhao, G. S. Frankel, B. Zoofan, and S. Rokhlin, Corrosion (Houston), 59, 1012 共2003兲.
5. M. Posada, L. E. Murr, C. S. Niou, D. Roberson, D. Little, R. Arrowood, and D. George, Mater. Charact., 38, 259共1997兲.
6. M. R. Bayoumi, Eng. Fract. Mech., 54, 879共1996兲.
7. X. Liu, G. S. Frankel, B. Zoofan, and S. Rokhlin, Corros. Sci., 49, 139共2007兲. 8. I. L. Muller and J. R. Galvele, Corros. Sci., 17, 179共1977兲.
9. J. F. Li, Z. Ziqiao, J. Na, and T. Chengyu, Mater. Chem. Phys., 91, 325共2005兲. 10. J. Galvele and S. De Micheli, Corros. Sci., 10, 795共1970兲.
11. V. Guillaumin and G. Mankowski, Corros. Sci., 41, 421共1998兲. 12. W. Zhang and G. S. Frankel, Electrochim. Acta, 48, 1193共2003兲. 13. W. Zhang and G. S. Frankel, Electrochem. Solid-State Lett., 3, 268共2000兲. 14. W. Zhang and G. S. Frankel, J. Electrochem. Soc., 149, 510共2002兲.
15. W. Zhang, S. Ruan, D. A. Wolfe and G. S. Frankel, Corros. Sci., 45, 353共2003兲. 16. X. Liu, G. S. Frankel, B. Zoofan, and S. Rokhlin, J. Electrochem. Soc., 153, 42
共2006兲.
17. T. Huang and G. S. Frankel, Corros. Sci., 49, 858共2007兲.
18. V. Garat, O. Brucelle, J. M. Cloue, V. Rebeyrolle, D. Monceau, B. Viguier, and E. Andrieu, Mater. Sci. Forum, 461–464, 537共2004兲.
19. Sp. G. Pantelakis, P. G. Daglaras, and Ch. Alk. Apostolopoulos, Theor. Appl. Fract.
Mech., 33, 117共2000兲.
20. P. V. Petroyiannis, Al. Th. Kermanidis, P. Papanikos, and Sp. G. Pantelakis, Theor.