HAL Id: hal-01008933
https://hal.archives-ouvertes.fr/hal-01008933
Submitted on 12 Jun 2017
HAL is a multi-disciplinary open access archive for the deposit and dissemination of sci-entific research documents, whether they are pub-lished or not. The documents may come from teaching and research institutions in France or abroad, or from public or private research centers.
L’archive ouverte pluridisciplinaire HAL, est destinée au dépôt et à la diffusion de documents scientifiques de niveau recherche, publiés ou non, émanant des établissements d’enseignement et de recherche français ou étrangers, des laboratoires publics ou privés.
Distributed under a Creative Commons Attribution| 4.0 International License
Some constitutive and computational aspects of coupled
hydraulic-damage problems for leakage rate predictions
of concrete vessels
Gilles Pijaudier-Cabot, Frédéric Dufour, Marta Choinska, Abbas Krayani,
Ludovic Jason, Georges Chatzigeorgiou
To cite this version:
Gilles Pijaudier-Cabot, Frédéric Dufour, Marta Choinska, Abbas Krayani, Ludovic Jason, et al.. Some constitutive and computational aspects of coupled hydraulic-damage problems for leakage rate predictions of concrete vessels. Computational Modelling of Concrete Structures EURO-C, 2006, Mayrhofen, Austria. �hal-01008933�
Some constitutive and computational aspects of coupled
hydraulic-damage problems for leakage rate predictions of concrete vessels
G. Pijaudier-Cabot, F. Dufour, M. Choinska, A. Krayani
R&DO – Institut GeM, Ecole Centrale de Nantes, Nantes, France
L. Jason
CEA, Gif sur Yvette, France
G. Chatzigeorgiou
Aristotle University of Thessaloniki, Thessaloniki, Greece
ABSTRACT: This contribution presents a review of the works carried out at R&DO in Nantes, in collabora-tion with Electricité de France. The aim is the study of sensitive structures like containment vessels of nuclear power plants, and the evaluation of their gas tightness more specifically. The objective is the computation of the leakage rate of vessels subjected to internal pressure (typically during integrity tests). It requires the evaluation of the material permeability, as a function of the moisture content in concrete and of the amount of damage. We focus mainly on the relationship between gas permeability and material damage, starting from an elastic-plastic-damage constitutive relation and analyzing the relationship with the permeability with the help of a discrete (lattice) analysis. The global solution strategy relies on chained calculations, as for large size structures, fully coupled problems remains out of reach. An example on a representative structural element is provided. This review concludes on some size effect analysis of damaged specimens, which shows that both approaches to cracking – discrete and continuous – exhibit the same effect of size on transfer properties of structural elements.
1 INTRODUCTION
In high power French nuclear power plants (1300 and 1450 MWe), the internal containment vessel represents the third passive barrier for the environ-mental protection in case of accidents. Considering that there is no liner and that only concrete has to provide the air tightness, it is essential to know the relationship between the degradation of concrete and its permeability when the consequences of a me-chanical loading on the hydraulic behavior have to be evaluated. The variation of the permeability is in-deed closely related with the leakage rate through concrete. In order to estimate the durability of the structure (that is to say its ability to fulfill its con-tainment role) and to adapt reinforcements to pre-vent leakage, several issues need to be addressed. The first one is the evaluation of permeability with drying and micro-cracking. The second one is to ar-rive to a robust computational technique capable of being applied for very large scale structures. The third one being the validation of the above models and solution techniques compared to available ex-perimental data.
This contribution will be aimed at the first two is-sues essentially. This paper intend to review several results obtained over the past few years, following our cooperation with the French power company, EDF. We shall start by the presentation of the
gen-eral methodology for the analysis of transport through concrete and review the equations used for modeling the effect of drying on permeability. Then, we shall concentrate on the evaluation of mechanical damage, recall the elastic plastic damage formula-tion that is used and discuss its regularized version. The influence of damage on permeability is investi-gated theoretically, on the basis of the analysis of discrete lattices. Some existing experimental data will be discussed too.
Coupled techniques (Gens and Olivella, 2001, Gawin et al., 2003 or Mainguy et al., 2001 among others) are generally used to depict thermo – hydro – mechanical phenomena. The numerical model is based on the resolution of four balance equations (water mass, air mass, internal energy and momen-tum balances). Even if these theories provide inter-esting results which help at understanding the mate-rial behavior, they are generally inappropriate for large size structural applications. They require a large number of parameters, sometimes difficult to determine experimentally (dilatation coefficient of the porous medium or mass heat for solid grains (Chavant, 2001) for example) and need heavy com-putational resources to solve the matrix systems in-volved in the couplings. That is why a simplified method is an interesting alternative for large struc-tures such as containment vessels of nuclear power plants.
An uncoupled simulation is used here. It is based on the calculation of the gas permeability from two in-dependent preliminary computations (drying and mechanical effects). The resulting distribution of the transfer property is then included in an hydraulic simulation to represent gas pressure loading. The whole technique is applied on a FE Representative Structural Volume model of a typical 1300 MWe prestressed pressure containment vessel (PPCV) rep-resentative of French power plants. Finally, we look at the effect of size on the strength and transport properties in concrete.
2 HYDRAULIC PROBLEM
2.1 General principle
A gaseous phase without vapor is assumed in this contribution so as no change from liquid to vapor can occur. Moreover, gas transport is only consid-ered (context of the integrity test on containment vessels). The associated mass balance equation can be written as (Bear, 1991):
( g(1 Sl)) div( (1 S ) v )
t φρ φ ρ
∂ − = − −
∂ l g g (1)
with φ the total porosity, Sl the saturation degree, ρg
the gas volumetric mass and vg the gas velocity. The
gas velocity is expressed as a function of the gas pressure Pg using Darcy law:
(1 l) g g ( g) g K S v grad P φ η − = − (2)
where Kg is the gas permeability and ηg the
associ-ated dynamic viscosity. Darcy law assumes no inter-action between the liquid and gas phases during in-tegrity tests especially.
Considering the gas as “ideal”, the volumetric gas mass can be written as a function of the gas pres-sure: g g P RT M ρ = (3)
where M, R and T stand for the molar mass of gas, ideal gas constant and temperature respectively. Fi-nally, combining Equations 1, 2 and 3, the hydraulic problem is driven by the equation:
(1 Sl) Pg div( P(P gradg) ( )) t
φ∂ λ
− = − −
∂ Pg (4)
with λP(Pg) the “diffusive” coefficient:
( ) g P g g g K P P λ η = (5)
From this equation, it is clear that the study of the gas transfer is directly influenced by the evaluation of the gas permeability of the solid phase. One of the crucial point is thus to determine the key parameters that are involved in the changes of the hydraulic conductivity.
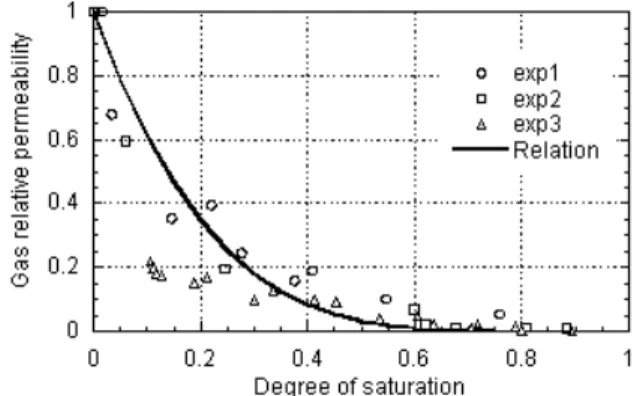
Figure 1. Evolution of the relative gas permeability as a func-tion of the degree of saturafunc-tion. Exp1 and exp2 from (Villain et al, 2001), exp3 from (Abbas et al, 1999).
2.2 Evolution of permeability due to the degree of saturation
The permeability ought to be a function of both the degree of saturation and the mechanical loads ap-plied on the material. To uncouple the two effects and to ease the calibration of evolution laws, a rela-tive permeability concept is introduced. It is based on the definition of a relative gas permeability krg,
which is function of the degree of saturation, and of an intrinsic hydraulic transfer property K(D), func-tion of the mechanical load.
( ). ( )
g rg l
K =k S K D (6)
For the drying effect, the theory initially devel-oped by Van Genuchten (1980) and used by Main-guy et al. (2001) or Monlouis – Bonnaire et al. (2003) among others is chosen. From statistical con-siderations, it writes the gas relative permeability as a function of the saturation degree using two pa-rameters m and q which have to be calibrated.
1 2
(1 ) (1q m)
rg l l
k = −S −S m (7)
From some experimental comparisons (fig. 1), the following relation has been chosen :
4.5 2
(1 ) (1 )
rg l l
k = −S −S (8)
In Picandet et al. (2001), an experimental law has been proposed relating damage to gas permeability. We shall follow the same approach latter on in this paper and thus discuss first the mechanical model implemented for concrete.
3 MECHANICAL MODELLING
For the mechanical part, elastic damage models or elastic plastic constitutive laws are not totally suffi-cient to describe the behavior of concrete. They in-deed fail to reproduce the unloading slopes during cyclic loads which define experimentally the value of the damage in the material. When coupled effects are considered, in hydro-mechanical problems espe-cially, the capability of the numerical model to re-produce the unloading behavior is thus essential, as an accurate value of the damage is required. A com-bined plastic – damage formulation is discussed here (for more details, see e.g. Jason et al., 2005, Jason 2004).
3.1 Constitutive relations
The chosen plastic yield surface depends on four main functions ρ (second effective stress invariant),
(hardening function),
ˆ
k ρc (deviatoric parameter) and r (deviatoric shape function) (Fig. 2):
2 ' 2 2 ˆ( ', ) ( ) ( ') ( ') h c k k F r σ ρ σ ρ σ σ = − (9)
where σ’ is the effective stress and kh the hardening
parameter. It is then combined with the isotropic damage model initially developed by Mazars (1984). The scalar variable D is computed from the elastic strain tensor εe: 1 ' e E ε = −σ (10) with E-1 the inverse of the elastic stiffness. The
dam-age loading surface g is defined by: ( e, ) ( e)
g ε D =d% ε −D
D=Max d%
q
(11) where D takes the maximum value reached by
during the history of loading / t . is computed from an evolution law that distinguishes between tensile and compressive behaviors through two couples of scalars (αt, Dt) for tension and (αc,
Dc) for compression.
d%
( , 0) d%
( e) t( e) t( eq) c( e) c( e )
d% ε =α ε D ε +α ε D ε (12) with εeq an equivalent scalar strain that characterizes
the material extension during loading. The definition of the different parameters can be found in (Mazars, 1984). The damage evolution conditions are finally given by the Kuhn – Tucker expressions. Once the damage has been computed, the “real” total stress σ is determined using the definition of the effective stress:
(1 D) '
σ = − σ (13)
Figure 2. Evolution of the plastic yield surface with the harden-ing parameter.
3.2 Some validation examples
For concrete, tension is the most relevant loading that a model has to predict as far as cracking is con-cerned. It is indeed when concrete is subjected to tensile loads that the first cracks usually appear.
Figure 3. Stress strain curve for simple tension test. Elastic plastic damage formulation.
That is why the numerical response (elastic plastic damage law) is first compared with an experimental tensile test (Gopalaratnam et al., 1985). Figure 3 gives the axial stress – strain curve. In order to evaluate the interest of including plasticity in the formulation, a pure damage model is also considered for which the plastic strains are supposed to keep a constant zero value so as the elastic strain equals ex-actly the total strain (ε = εe) (original damage model by Mazars, 1984). Figure 4 illustrates the simulation with the elastic damage model. As the development of damage is predominant during simple tension tests, the two models are capable of reproducing the experiment equally well. The elastic plastic damage constitutive law gives a correct value of the peak position and captures the post peak response.
Figure 4. Stress strain curve for simple tension test. Elastic damage constitutive law.
Figure 5 illustrates the model response for a cyclic compressive loading.
Figure 5. Axial response for a cyclic compressive test using the elastic plastic damage law.
The law is capable of capturing the monotonic be-havior (elasticity, hardening and softening) but also the development of irreversible strains.
Figure 6. Cyclic compression test. Volumetric behavior for
elastic-plastic-damage model.
The introduction of plasticity associated with the development of damage plays thus a key role in the numerical simulation of a cyclic compression test. The apparition of irreversible strains during loading is quantitatively reproduced and the softening be-havior fits well. Moreover, the volumetric response, that was totally misevaluated by the elastic damage
model (being contractant and never dilatant due to a constant Poisson’s ration), is correctly simulated by the full formulation (see Fig. 6). Finally, the damage variable D can be calibrated as the unloading slopes are similar to experiment.
In order to evaluate the ability of the constitutive law to reproduce triaxial tests after hydrostatic load-ing, the experimental results from Sfer et al. (2002) are reproduced. A vertical displacement is applied on the plane face of a concrete cylinder after an ini-tial hydrostatic loading. Numerical results are com-pared with experiments for different levels of con-finement pressures (P = 0, 1.5, 4.5, and 9 MPa). Figure 7 gives the axial response after the confine-ment phase (the application of the hydrostatic pres-sure is not represented) for the first four prespres-sures.
Simulations and experiment give similar results. The peak position is quantitatively well reproduced (except for 1.5 MPa ). The global evolution is also correct: the maximum of the axial stress increases with the pressure and the softening part is less and less significant. When the initial hydrostatic pressure takes higher values, the damage part of the model plays a minor role and plasticity effect becomes pre-dominant.
(2)
(1) (3)
(4)
Figure 7. Triaxial test with increasing confinement. Axial stress - strain curves for low hydrostatic pressures. Straight lines (black markers) correspond to simulation, dotted lines (white markers) to experiment: (1) 0 MPa, (2) 1.5 MPa, (3) 4.5 MPa, (4) 9 Mpa.
4 EVOLUTION OF PERMEABILITY DUE TO MECHANICAL LOADS
Coupling between the non linear response of con-crete and its permeability can be achieved in a very standard way with the help of the theory of porous materials initially due to Biot (see e.g. Biot 1941, Coussy 1995). This approach has become very popular in the literature for durability analyses in-volving mass transfer such as hydro-mechanical damage analysis (Bary et al. 2000), analysis of con-crete at an early age (Ulm and Coussy 1996), chemo-mechanical effects (Ulm et al. 1999), and more generally environmentally induced
degrada-tions (Bangert et al. 2003). In these approaches, however, the relationship between the material per-meability and the degradation induced in the mate-rial due to mechanical loads is phenomenological. Theoretical motivations of such relationships are relatively recent in the context of cement-based ma-terials. They rely on homogenisation techniques (Dormieux and Lemarchand 2001, Dormieux and Kondo 2004) where the distribution of micro-cracks needs to be characterised accurately (size, shape, opening, orientation). Such approaches provide a justification of the expected relationship between the crack density and the permeability. The applied ef-fective stress may also play a role as far as the propagation of these micro-cracks is concerned.
Another approach, which serves the same purpose as homogenisation techniques, is the scaling analysis of discrete lattices. Simple discrete models were used in the past in order to study the failure of het-erogeneous materials. Two dimensional lattices con-sisting of beams (Herrmann et al. 1989) or springs (Hansen et al. 1989) have been used, where the het-erogeneity is captured by a random distribution of the failure thresholds of each beam / bar. Although these lattices are very simple, and not capable of re-producing the exact features of the micro-cracking processes in brittle heterogeneous materials, the limit response of a lattice of infinite size is quite relevant as it is related to the response of a material point in the continuum sense. Hence, there is an in-terest at studying the scaling properties of such lat-tices, and in particular the characteristics that de-scribe the lattice in a size independent way. Such quantities are those that are expected to be found in a continuum model, as representatives of the mate-rial degradation. Following this technique, Delaplace et al. (1996) have shown that a proper way to cap-ture material damage due to micro-cracking, de-scribed as the failure of elastic brittle bonds in a dis-crete model, is to model the variation of the material stiffness in a continuum setting (which can then be indexed by a damage variable). A similar observa-tion has been also reported by Krajcinovic and Ba-sista (1991).
We have attempted the same type of approach with the aim of investigating the variation of mate-rial permeability due to mechanical damage and their relationship in Chatzigeorgiou et al. (2005) and we shall report herein the main results. We will be starting with the mechanical analysis.
4.1 Lattice analysis
The lattice which will be described in the following was used in the past for the study of the failure mechanism of quasi-brittle materials (see Krajcino-vic and Van Mier (2000) or Delaplace et al. (1996) for complete details). It is a stiffness controlled model, where the mechanical problem is substituted
by an electrical analogous, simplifying the analysis by transforming it from vector to scalar. As shown by De Arcangelis et al (1989), this simplification is able to capture the most important physical aspects of the problem with a simpler approach. The model, which is depicted in figure 8, is a regular two-dimensional lattice whose bonds are one dimen-sional. The lattice size is where L is related to the total number of bonds . Instead of solving the mechanical problem, we solve an electrical analogous substituting the strain
L L×
2
2L
n=
ε with the voltage difference , the stress v σ with the current i, and the Young's Modulus E with the conductance G. So, we substitute the constitutive equation:
ε σ =Ε⋅ (14) with v G i= ⋅ (15) The boundary conditions of the model are periodic in order to avoid boundary effects. They represent a homogeneous loading in the vertical direction: Pe-riodicity is imposed along the boundaries parallel to the vertical axis and a constant unit jump of voltage is applied between the horizontal boundaries.
Figure 8. Lattice model.
Every bond of the lattice behaves as an elastic -brittle material which has a conductance equal to 1. When it reaches a threshold current ic, it fails. ic
dif-fers from bond to bond following an uniform ran-dom distribution between 0 and 1.
We start the calculation by assigning a threshold current to every bond with the help of a random generator number (Press et al. 1992). At each step, the algorithm computes the voltage at each node from Kirchhoff’s law. The equations form a sym-metric band matrix which is solved using Cholesky factorisation. From Ohm’s law, the current of each bond is obtained. The bond which fails first is the one which has the minimum ratio of its strength ic to
its current. This bond is removed from the lattice by changing its conductance from 1 to 0. Because the analysis is linear, it is also possible to compute the overall load (intensity) at which this bond fails and the process continues with the next step of loading where we look at the next bond which fails. Figure 9 shows a typical current vs. voltage response (lattice
of size 64). The snapbacks in Fig. 9 are observed be-cause the load process is stiffness controlled. In a displacement controlled scheme, the envelope of the curve would be recovered only.
0 0.02 0.04 0.06 0.08 0.1 0.12 0.14 0.16 0.18 0.2 0 0.02 0.04 0.06 0.08 0.1 0.12 0.14 0.16 Voltage I
Figure 9. Typical intensity (load) versus voltage (relative dis-placement) response of a lattice of size 64.
The lattice does not represent a real material. In fact, we are interested in its scaling properties: as the lattice size tends to infinity, its response tends to a thermodynamic limit which is the response of a sin-gle point in a continuum approach. Hence, we shall look at the variables that are capable to describe the evolution of the lattice response with bond breakage, independently from its size. These are the variables that should characterise the continuum point re-sponse, those which should enter in a continuum formulation, whatever the phenomenological details or the continuum model chosen.
In the mechanical problem, we characterise the distribution of local currents with the evolution of the lattice degradation (bond failures). For this, we introduce the moments which are calculated accord-ing to the formula:
∫
= i N i di
Mm m () (16)
where i is the current of each bond, N(i) is the num-ber of bonds whose current is in the range of [i, i+di], and m is the order of moment. We limit the analysis to moments of order up to 4. This assump-tion is equivalent to a truncaassump-tion in a series. The zero order moment is the number of unbroken bonds, the first order moment is proportional to the average value of the current. The second order moment is proportional to the overall conductance Gof the
lat-tice (stiffness in the mechanical problem):
G v G di i N ri M2 =
∫
2 () =2 2 =2 (17) where r is the local resistance of the bond (unit re-sistance here) and the voltage difference applied to the lattice is equal to 1. Note that the fourth ordermoment is a measure of the dispersion of conduc-tance.
As each lattice has a unique distribution of bond thresholds, several computations with different ran-dom seeds must be performed in order to achieve a representative statistical treatment of the results for which useful conclusions about the average behav-iour of the lattice can be made.
Figure 10 represents the average moments of 300 different random seeds for different lattice sizes as a function of the moment of order 2 until the peak cur-rent. -0.1 -0.05 0 0.05 0.1 0.15 0.2 0.25 0 0.05 0.1 0.15 0.2 0.25 -log(M2/M20) -log(M 1/M 1 0), -log(M 2/M 2 0) -log(M0/M0 0 ) -log(M 4/M4 0 ) size 16 size 32 size 64 size 128
Figure 10. Opposite of the logarithm of the moments of order 0 to 4 as a function of the opposite of the logarithm of the mo-ment of order 2 in the mechanical problem for lattice sizes ranging from 16 to 128.
In these diagrams, every curve represents, in a logarithmic scale, the opposite of the moments di-vided by their value at the beginning of the calcula-tion (no damage). Hence, the zero order moment in-creases as the number of unbroken bonds dein-creases and the second order moment increases as the over-all conductance decreases. We can observe that until the peak, the curves of M0, M2 and M4 versus M2 are
independent from the size of the lattice approxi-mately. Hence, the average conductance is a parame-ter that describes the distribution of current and its evolution due to bond breakage, whatever the size of the lattice. It means also that the overall degradation of conductance (stiffness) is the parameter which represents local bond breakage in the continuum ap-proach.
In order to represent the influence of material damage on the permeability, it is reasonable to as-sume that when a bond fails in the mechanical lat-tice, it opens a larger path for fluid flow in the per-pendicular direction (we do not consider here mechanical damage due to hydraulic pressure). This basic scheme is depicted in figure 11. The hydraulic lattice is built following this principle, with bonds that are perpendicular to the mechanical lattice.
F lu id f lo w
Figure 11. Basic scheme for the coupled hydro-mechanical lat-tice analysis. When a mechanical bond fails, the permeability of a perpendicular bond increases suddenly.
The periodicity of the mechanical lattice yields the hydraulic dual lattice shown in figure 12. As men-tioned by Dormieux and Kondo (2004), the fluid flow at the micro-scale level (bond level) can be de-scribed by Darcy’s equation:
p K
q= .∇ (18) where q is the flow rate, is the drop of pressure p, and k is the local permeability. We are going to assume that when a bond fails, the local permeability in the perpendicular direction is increased by a mul-tiplicative amplification factor k which is typically of the order of 10-6.
p ∇
Figure 12. The mechanical and the hydraulic lattices.
Again, periodic boundary conditions are applied to the hydraulic lattice and we use an electrical anal-ogy. This means that the voltage represents the pres-sure p, the current represents the flow rate q and the conductance represents the permeability k. A con-stant drop of pressure equal to 1 is applied at the ver-tical boundaries of the lattice. At each step of dam-age in the mechanical lattice, the flow rate is computed in the dual lattice and the various mo-ments of its distribution are computed too.
It is worthwhile to point out that the hydro-mechanical coupled effect is introduced at the local scale, same as the degradation process in the me-chanical problem. Furthermore, we analyse here the permeability of the unloaded material. Same as in classical poro-mechanics, there is no effect of the applied stress on the permeability in the reversible
regime and it cannot be expected to be observed in the present computations. What we intend to see is on which parameter of the mechanical problem the variation of permeability depends, and by which moment of the mechanical problem the evolution of the fluid flow distribution in the lattice can be de-scribed in a size independent way. Following the same technique as in the mechanical problem, we look at the moments of the distribution of the hy-draulic flow rate, and we try to find for which mo-ment of the distribution of the local stress (current) the plots collapse on the same curve for different sizes.
The second order moment in the mechanical prob-lem is a natural candidate since it is this one which describes the evolution of mechanical damage. Fig-ure 13 shows the plot of the moments of order 1, 2 and 4 in the hydraulic lattice as a function of the moment of order 2 in the mechanical lattice.
-4 -3.5 -3 -2.5 -2 -1.5 -1 -0.5 0 0 0.05 0.1 0.15 0.2 0.25 -log(M2m/M2m0) -log(M 1h/M1h 0 ) -log(M 2h/M2h0) -log(M 4h/M 4h0) size 16 size 32 size 64 size 128
Figure 13. Opposite of the logarithm of the ratio of the mo-ments of order 1, 2 and 4 to their initial values at the beginning of the computation, in the hydraulic problem, as a function of the opposite of the logarithm of the moment of order 2 in the mechanical problem for lattice sizes ranging from 16 to 128.
We may conclude that the evolution of the distri-bution of the local flow rates due to mechanical bond failure is described by the variation of stiffness due to the mechanical degradation in the mechanical problem, whatever the lattice size when the amount of damage is moderate (moment of order 2 ranging from 0 to 0.1 or 0.15 approximately). In this regime and in the limit of a continuum model, for an infinite lattice size, the variation of material permeability due to bond breakage (micro-cracks) should be con-trolled by the degradation of stiffness in the me-chanical problem, and not by the number of broken bonds (local degradation), the overall strain or the average stress. Figure 14 shows the plots of the
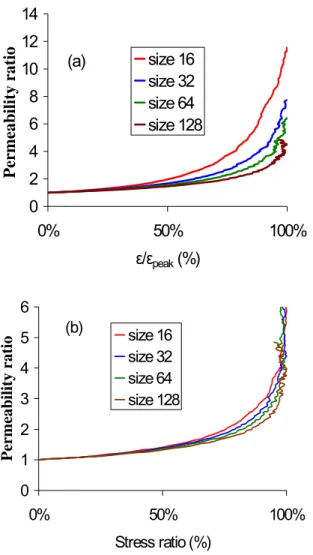
evo-lution of the average permeability divided by the ini-tial permeability (derived from the moment of order 2 in the hydraulic problem), as a function of the ap-plied strain or the apap-plied stress in the mechanical problem. These quantities should be seen here as history variables: the curves show the evolution of the average permeability as a function of the maxi-mum strain (stress) reached during the loading his-tory. We can see that for each size of lattice a differ-ent curve is obtained.
0 2 4 6 8 10 12 14 0% 50% 100% ε/εpeak (%) Permeability ratio size 16 size 32 size 64 size 128 (a) 0 1 2 3 4 5 6 0% 50% 100% Stress ratio (%) Permeability ratio size 16 size 32 size 64 size 128 (b)
Figure 14. Permeability divided by the initial permeability ver-sus strain (a) and stress (b) ratios to the peak for various lattice sizes.
By comparison, figure 15 shows the evolution of the permeability as a function of the evolution of stiffness in the mechanical lattice. For all the sizes considered, the plots collapse onto the same curve for stiffness variations ranging from 0 to 0.2 ap-proximately, before the peak load. For large varia-tions of the stiffness, lattices have entered far in the softening regime and the lattice size starts to play an important role because it controls the spacing be-tween the macro-cracks. Therefore, results cannot be interpreted properly in this regime.
1 10 0 0.1 0.2 0.3 0.4 0.5 (E0-E)/E0 K/ K 0 size 16size 32 size 64 size 128
Figure 15. Permeability versus Young Modulus reduction ac-cording to the lattice analysis.
4.2 Lattice analysis consistent phenomenological model
From the previous section, it seems theoretically sound to consider that in the regime of diffuse crack-ing permeability is a function of damage. This con-clusion ought to be restricted to low values of dam-age, but may be extended to higher ones in the absence of theoretical considerations.
Experimental results from Picandet et al (2001) and from Bary (1996) may serve then to calibrate phenomenological relations for the evolution of the permeability as a function of damage.
(b) (a)
Figure 16. Evolution of the intrinsic permeability with damage. (a) experimental results from Picandet et al. (2001) (BO, BHP, BHPF for ordinary, high performance and fibered high per-formance concrete) (b) experimental results from Bary (1996).
Figure 16 shows the evolution of the permeability in the ranges of moderate, up to high (close to 1) values
of damage, computed from the unloading stiffness in Bary and from the stiffness deduced from ultrasonic wave velocity in Picandet et al. From these data, a damage threshold D0 is defined from which a
sig-nificant increase in the permeability is observed:
0 0 0 0 0 if if ) ( log D D K K D D D D C K K ≤ = > − = ⎟⎟ ⎠ ⎞ ⎜⎜ ⎝ ⎛ (19)
with K0 the initial intrinsic permeability, C and D0
two parameters respectively equal to 8.67 and 0.035 from our calibration.
As a conclusion, let us mention that other phe-nomena should be considered to reach a physical meaning: pore size distribution (Dana and Skoczy-las, 1999) or fluid – solid contact angles (Dullien, 1979) but due to a lack in experimental data, they are not taken into account here.
5 REGULARISATION – GRADIENT APPROACH
The mechanical model developed in section 3 exhib-its strain-softening and all the inherent difficulties attached to this specific material behaviour. Mathe-matically (Benallal et al., 1993, Peerlings et al., 1996), when a material point enters the softening re-gime, the type of the governing equilibrium equa-tions changes from elliptic to hyperbolic. The mathematical description becomes ill-posed since the initial and boundary conditions that are meaning-ful for the elliptic problem are not relevant for the hyperbolic part. Numerically, the local formulation of the problem yields a response which is dependant on the smoothness and the orientation of the mesh.
We will first illustrate mesh dependency on the structural application extracted from a benchmark proposed by EDF (Jason et al. 2004). It is a 3D computation of a reinforced concrete three point bending beam (Fig. 17).
Figure 17. Three point-bending test on reinforced concrete beam.
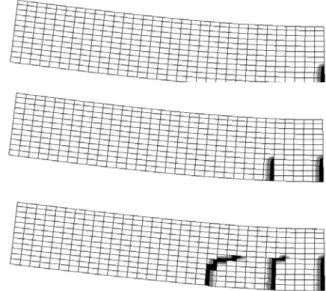
Figure 18 illustrates the damage distributions for different loading steps. A major damage band ap-pears in the middle of the beam, followed by some secondary bands that characterize the presence of steel in concrete. This “discrete” damage distribution illustrates well the formation of cracks in a
rein-forced concrete beam and is in qualitative agreement with experimental results. It should be stressed that such a results, although it might seem very realistic, is absolutely not mesh objective.
Figure 18. Development of damage in the beam.
Figure 19 shows the same calculation with two meshes of different sizes. As expected, the distribu-tion of damage is very much mesh sensitive. The comparison is presented at the same value of the de-flection.
(a)
(b)
Figure 19. Development of damage in the beam: (a) coarse mesh; (b) fine mesh.
A more consistent approach would require a regu-larized approach. Different techniques exist to limit strain localization (Pijaudier-Cabot and Bazant 1987, Peerlings et al., 1996, Lorentz et al., 2003). In every case, the principle is to include a spatial in-formation in the form of a characteristic length. Here a gradient approach is chosen. It is based on the cal-culation of a non local strain tensor that solves, for each component of the elastic strain tensor, the equa-tion : ij ij ij e c ε ε ε = − ∇2 (20)
where ∇2
denotes the second order gradient operator. The constant c is proportional to the square of a length and characterises the non local interaction. The following boundary conditions are adopted for the non local strains (Peerlings et al., 1996):
.n
ε
∇ r=0 (21) The global numerical problem is finally governed by the equilibrium equation coupled to Eq. (20) which defines the non local strains. This gradient approach can be applied to the elastic-plastic-damage model presented in section 3, or to any plas-tic damage model equivalently. We show here some results obtained with a plastic damage model where plasticity follows a simple von Mises model.
Figure 20. Development of damage in a tensile bar with a de-fect in the middle (the deformation of the mesh is amplified).
The test case is a 3D tension bar which contains a defect in the middle. The bar length is 1m and the cross section is 2x2 cm2. Figure 20 shows the distri-bution of damage over the bar at failure.
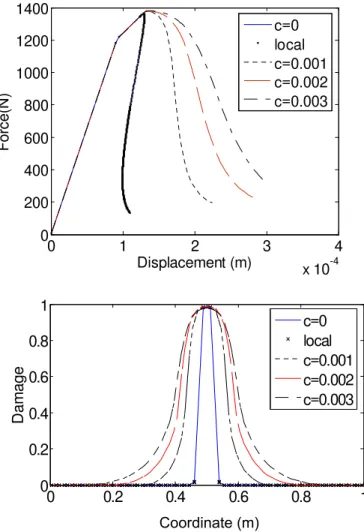
Figure 21 shows the profile of damage and the load displacement response for several values of the internal length parameter c. This is a classical result for computations with a gradient (or integral) model where the internal length scales the size of the dam-age band at failure.
6 MODELLING DRYING EFFECT
The gas relative permeability is a function of the de-gree of saturation. Therefore, the distribution of the moisture content needs to be calculated within the leakage computation. In the following relations, we shall consider the case where the saturation does not interact with damage. The method proposed by Mensi et al (1988) or Debruyne & Cirée (2001) is used in this contribution to determine this variable. From water, vapor and dry air mass balance equa-tions, the authors come to a non linear relation for modelling the drying effect :
[ ( , ) ( )] fl fl fl c C div C T grad C t λ ∂ = ∂ (22)
with Cfl the volumetric water content and λc the non
linear diffusive coefficient function of Cfl and tem-perature T. 0 1 2 3 4 x 10⁻⁴ 0 200 400 600 800 1000 1200 1400 Displacement (m) Fo rc e (N ) c=0 local c=0.001 c=0.002 c=0.003 0 0.2 0.4 0.6 0.8 1 0
Figure 21. Load displacement responses and damage profiles along the bar for different values of the internal length scale. The local computation and the computation for c=0 are identi-cal.
The temperature distribution is defined from a pre-liminary computation based on the resolution of a linear equation [ ( )] p T T C div grad T t ρ ∂ + −λ 0 ∂ = (23)
with Cp the volumetric heat at a constant pressure
and λT the constant thermal conductivity.
For the expression of λC , the following relation has
been chosen (Granger, 1995):
0 0 1 1 ( fl, ) exp( . fl) exp( i( )) c Q T C T A B C T R T T λ = − − (24) with A, B, T0 and i Q
R four model parameters.
Once the distribution of the volumetric water content is evaluated, the degree of saturation is deduced.
fl l sat S C = C (25) 0.2 0.4 0.6 8 1 0. elongation (m) D am age c=0 local c=0.001 c=0.002 c=0.003 Coordinate (m)
where Csat is the water content of the saturated
sam-ple. At the end of the computation, the degree of saturation is known at each point and during the life time of the structure.
7 APPLICATION ON A REPRESENTATIVE STRUCTURAL ELEMENT
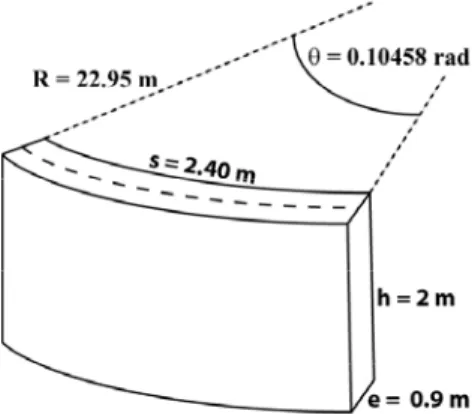
The application presented in this part to illustrate our methodology has been proposed by Electricité de France. The test, named PACE 1300, is a Represen-tative Structural Volume (RSV) of a pre-stressed pressure containment vessel (PPCV) of a French 1300 MWe nuclear power plant. Figure 22 illustrates the geometry of the RSV. It includes 11 horizontal and 10 vertical reinforcement bars (on both internal and external faces), 5 horizontal and 3 vertical pre-stressed tendons, and 24 reinforcement hoops that have been distributed to be as close as possible to the in situ situation. Details concerning the geome-try, steel and concrete properties can be found in Ja-son et al. (2004).
Three processes are taken into account for the study of the hydraulic behavior: the evolution of the mechanical state (damage), the drying effect (evolu-tion of the degree of satura(evolu-tion) and the gas internal pressure (hydraulic loading). A chained method is applied. The mechanical state is defined independ-ently from drying and vice versa. Then, once dam-age and saturation degree in the containment build-ing are known at each point, the distribution of the gas permeability is calculated. Finally, the reparti-tion of the transfer property is included in the hy-draulic computation. This choice for the simulation assumes that damage does not influence the evolu-tion of the degree of saturaevolu-tion. Drying and me-chanical properties are thus totally uncoupled. Then, during the hydraulic internal pressure test, the de-gree of saturation does not evolve. This hypothesis is realistic since the duration of the integrity tests (48 hours) is negligible, compared to the time of drying (more than ten years), and does not enable the dry-ing process to become relevant.
Figure 22. Geometry of the RSV.
In the mechanical problem, the loading is applied in two steps. First, the prestress, the body weight of RSV and that of the surrounding structure are con-sidered. The integrity test loading is then represented by a radial pressure on the internal face and by the bottom effect applied on the top face (tensile stress proportional to the internal pressure to simulate the effect of the neighboring structure). For the compu-tation, the elastic plastic damage constitutive law (section 3) for concrete and a plastic von Mises model for steel are used. We implement here a local version of the mechanical model. For this medium size structure already, the gradient approach requires large scale computing facilities which were not used in the validation of the presented methodology.
Results concerning the global mechanical behav-ior of the structure can be found in Jason et al. (2004). In our study, only the damage distribution is considered for hydraulic purpose. The repartition il-lustrated in figure 23 is computed. Note that the fi-nite element mesh is too coarse and thus a local computation is carried out. Non local computations with a sufficiently fine mesh are still pending.
Damage initially develops along the vertical ten-don which is located in the middle of the mesh. Then, it propagates in the depth of the volume and along the vertical axis. It finally forms a localized damaged zone in the middle of the structure. Note that the reinforcement is not completely periodic in the analyzed structure (radial bars). It explains why the development of damage is not simultaneous near the 3 vertical tendons, but initiates near the middle one first.
Top cross line
Figure 23. Damage in the RSV. Black zones correspond to heavy damaged ones.
Independently from the mechanical computation, the drying effect is simulated using the following boundary conditions. For the preliminary determina-tion of T, the temperatures on the inner and outer faces are kept constant, equal to 15 °C. From the fifth year, the internal temperature increases until
Bottom cross line
35°C. For drying simulations, the boundary condi-tions are expressed with humidity flows wfl through the internal and external surfaces, following (Granger, 1994): 0 0 0.5 [ (2 )]( ( ) fl fl fl eq eq eq w C C C C C C C ) β = − − − − (26)
where b is a parameter, C0 is the initial water content
and Ceq is the water content corresponding to a
hu-midity rate of 50 %. The parameters chosen for the simulation correspond to a numerical calibration performed by Granger (1994).
Figure 24. Distribution of the degree of saturation.
Figure 24 shows the distribution of the saturation degree after 54 years of drying. It is not symmetric due to a non symmetry of the imposed boundary conditions. As expected, the outer surface of the volume is drier than the inner one.
Figure 25. Distribution of the gas total permeability (m²). Black zone corresponds to a value of 10-7 m².
From the knowledge of the saturation degree and the damage distributions, the repartition of the gas permeability can be computed (Fig. 25). It is clearly influenced both by damage and saturation. One can
notice a “localized flow” area on the top of the struc-ture corresponding to the damage localized band. Moreover, the hydraulic conductivity is higher on the outer surfaces than in the core of the volume. It results in a high variation of the values of the gas transfer parameter.
The hydraulic gas pressure is then applied in two steps: first a regular increase in the internal pressure from 0.1 MPa (atmospheric pressure) to 0.58 MPa (integrity tests) until t = 3.6s (external pressure stant equal to the atmospheric pressure), then a con-stant 0.58 MPa internal pressure until t = 106 s.
Figure 26. Distribution for different times of the pressure in the depth of the RSV for the top (a) and bottom (b) of the structure.
Zero flow conditions are added on lateral faces to be as close as possible to the real conditions. Figure 26 gives the gas pressure repartitions during the sec-ond phase (constant 0.58 MPa pressure) on the top and bottom of the structure for different times. A permanent state is quickly reached on the top of the structure. The pressure in the localized damage band keeps a constant value equal to 0.1 MPa (atmos-pheric pressure). This result can be explained by the high permeability observed in this zone that triggers a fast transfer through the concrete compared with the middle and bottom of the RSV. On the bottom, results are more usual as the distribution of the trans-fer property is rather influenced by the degree of saturation.
These distributions provide first interesting infor-mation on the hydraulic behavior during integrity tests. In particular, they show the influence of the gas permeability (and consequently of the damage
Int. Ext. 1 105 2 105 3 105 4 105 5 105 6 105 22.6 22.8 23 23.2 23.4 Pressure (Pa) Radius R (m) 1 105 2 105 3 105 4 105 5 105 6 105 22.6 22.8 23 23.2 23.4 (a) Pre ss u re (Pa ) Radius R (m) Increasing time (b)
and of the saturation degree). Nevertheless, for in-dustrial purpose, they are not totally sufficient. To locate sensitive zones with a potentially high leakage rate, a simple indicator is needed. A variable propor-tional to the flow has been chosen. It is computed following the equation :
( ) ( )
P g g
f = −λ P grad P (27) Figure 27 illustrates the distribution of the vari-able at the end of the computation. For this simula-tion, f concentrates essentially in the zone where the permeability is high with values near zero else-where.
Figure 27. Distribution of the flow indicator. Grey zones corre-spond to a maximal flow.
8 SIZE EFFECT IN THE TRANSFER PROBLEM In the previous example, we are interested in a hy-draulic response of a structure which may, in prac-tice, exhibit diffuse damage only. In this type of con-finement vessels, major (through) cracks are not expected. We may, however, attempt to analyse situations which exhibit a more severe degree of damage. In this case, the validity of the coupled damage – permeability model may be questioned as fluid flow in through cracks may be controlled by the crack opening and the crack tortuosity, two pa-rameters which do not appear in the damage model that rely on a continuum approach. We shall, how-ever, try to analyse the consequences of the coupling between permeability and damage in this case of se-vere damage and more specifically, when damage localises to form a macro-crack.
Due to the regularisation of damage, a size effect is expected to develop on the nominal strength of the specimen in the mechanical problem. We will inves-tigate the consequences of this size effect on the permeability problem and check whether it is consis-tent with classical approaches that involve the de-scription of Poiseuille flow in open cracks. For this purpose, we are going to consider the brazilian
split-ting test as an example of mechanical problem. This type of experiment, combined to permeability analy-ses has been used quite often.
8.1 Mechanical and hydraulic models
Since we intend to look at the effect of damage on the permeability, we shall consider here a simple isotropic damage model. It is the same as the one devised in section 3 but without plastic strains. In order to represent a damage-permeability interaction at the material level, the relation established by Pi-candet for homogeneously diffused micro-cracking is used (but any other could be implemented as well). This exponential law is:
) ) exp(( 0 αD γ K K = (28)
where K, K0 are respectively the current and initial
material permeability. D is the damage, α and γ are the parameters fitted by the author to 11.3 et 1.64. This relation is compared with the one used previ-ously in equation (19). 1,00E+00 1,00E+03 1,00E+06 1,00E+09 1,00E+12 1,00E+15 1,00E+18 1,00E+21 1,00E+24 0 0,2 0,4 Damage0,6 0,8 1 R e lat ive P e rm ea b il ity In c re a se K /K o EXPONENTIAL LAW POWER LAW
Figure 28: Damage-permeability interaction laws. Comparison of both approaches. The straight line corresponds to the power law formula.
Both approaches give approximately the same permeability values for damage lower than 0.2. Then, for higher damage, the extrapolated exponen-tial approach yields a larger permeability in com-parison with the power type approach.
In cracked structures, the crack pattern controls a global fluid flow and the permeability increase is closely related to cracks opening and connectivity. In the present continuum counter part study, diffuse and localised cracking develop in the fracture proc-ess zone, which size is controlled by the internal length in the mechanical model. Then, according to the damage-permeability interaction, the major part of the fluid flow should also localize in the FPZ. If size effect is observed on the structural response in the mechanical problem, some size effect should also appear in the hydraulic problem.
8.2 Mechanical computations
The cylindrical specimen is loaded along a diametral plane by means of steel bearing plates, as shown in figure 29a. This study is not related to any experi-mental data, so that the steel bearing plates are arbi-trary modelled by rigid plates, with high Young’s modulus E and Poisson’s ratio ν of concrete in order to avoid a confinement effect of concrete. The set of model parameters (Fig. 29b) represents ordinary concrete.
Figure 29. (a) Brazilian test – problem statement for the small-est size; (b) material parameters for concrete specimen and rigid plates
Three geometrically similar cylindrical concrete specimens with diameter 110 (D11), 220 (D22) and 440 mm (D44) are analysed with an internal length scale c arbitrary chosen as 20 mm. The tensile strength is sensitive to the boundary conditions, par-ticularly to the size of the loading strip, which should be also kept geometrically similar to insure full similarity (see Bazant and Planas, 1988).
Numerical simulations are performed in the FE code Code_Aster with 6-node triangular elements, which give continuous strain gradients. A plane strain analysis is carried out in order to evaluate global response of each size structure as well as ini-tiation, distribution, evolution and size of the dam-aged zone. The same element size, optimized so that mesh sensitivity is negligible, is considered for each size of specimen.
This non linear problem is solved incrementally by crack opening displacement (COD) control, i.e. the horizontal displacement of point P3B in figure 29 increases monotonically. Force versus COD plots are shown in figure 30 for each size specimen. Fig-ure 30 presents also the best fit of numerical results to Bazant’s size effect law:
0 1 d d Bft + = σ (29)
where ft is the tensile strength, B is a parameter
re-lated to the specimen geometry, d is the diameter of
the cylinder and d0 is a scaling parameter. The
nominal strength σ diminishes as the specimen size grows. 0,0E+00 3,0E+05 6,0E+05 9,0E+05 1,2E+06 1,5E+06 1,8E+06
0,0E+00 1,0E-06 2,0E-06 3,0E-06 4,0E-06
COD (m) Verical force F (N) D11 D22 D44 b
Figure 30. Top: force vs. COD plot; bottom: Bazant’s size ef-fect law.
The distributions of damage for the three size specimens are depicted in figure 31. The damage band width is governed by model characteristic length and its height at failure is the diameter.
D11 1 D22 1 D44 0.7
Figure 31. Damage distributions for three size specimens of di-ameter 110, 220 et 440 mm.
Maximum damage is initially located at some point (depending on specimen size) along the vertical
symmetry axis, then it translates downwards to the centre as the loading increases. The points, where damage is higher than 0.5-0.6, are located within a band of 20 mm width, as shown in figure 32. The width of the severely damaged zone remains con-stant approximately. 0 0,2 0,4 0,6 0,8 1 0 0,01 0,02 0,03 0,04 0,0 Distance from specimen centre (m)
Da ma g e 5 D11 D22 0,5Lc=0,01 D44
Figure 32. Profiles of damage along an horizontal line in the middle of the specimen.
1,0E-18 1,0E-15 1,0E-12 1,0E-09 1,0E-06 1,0E-03 1,0E+00 1,0E+03 0 0,2 0,4 0,6 0,8 1 Dmax Km ean D11 D22 D44 1,0E-18 1,0E-15 1,0E-12 1,0E-09 1,0E-06 1,0E-03 1,0E+00 1,0E+03 0,0 0,2 0,4 0,6 0,8 1,0 Dmean Km ean D11 D22 D44
Figure 33. Mean permeability reduction with a specimen size growth versus local damage (top); mean permeability increase with a specimen size growth versus global damage (bottom).
8.3 Hydraulic properties of damaged specimens At each damage state a local permeability is com-puted according to the local damage-permeability exponential relation applied at each Gauss points of a discretized structure. Then, a structural (average) is determined permeability for each size specimen by weighted-averaging of the local permeability. The results plotted in figure 33 (top) show a reduction of a structural permeability when the size of the speci-men increases. For any given structural damage, fig-ure 33 (bottom) shows also that a structural perme-ability increases with the specimen size. Structural damage is evaluated as a relative loss of initial rigid-ity for any loading step from the F-COD response.
Therefore, the analysis of average structural pa-rameters, like average damage and average perme-ability, exhibits some influence of the structure size. This size effect may be used in order to quantify the internal length scale of the mechanical model since it is the quantity which controls the spreading of damage over the specimen. The larger this spreading the more important the influence of damage and the relative flow rate (per square meter of specimen for instance). Note also that this size effect is the conse-quence of the computation of the average permeabil-ity. It is not intrinsic to the fluid transfer problem.
8.4 Analytical model
In order to determine analytically the size effect law governing the flow in damaged structures, an hy-pothesis of an equivalent uniform damage distribu-tion in a damaged band of width Lc for each size
specimen is considered. Outside this damaged band the material remains intact in the sense of permeabil-ity. These assumptions are valid at failure and permit to estimate an asymptotic mean permeability in-crease with specimen size. The model assumptions are presented in figure 34:
b F R Lc F Overall Surface: S = πR2 Damaged Surface: Sd = 2RLc Intact surface: So = S – Sd = πR2- 2RLc
Figure 34. Hypothesis of an equivalent uniform damage distri-bution in arbitrary chosen surfaces
We assume on one hand that damage is localized in a band of constant width, so that the permeability increase in this zone is very high. On the other hand, the change in permeability outside the damaged band remains negligible. Indeed, we observe on
nu-merical simulation results that outside the band of 20 mm width, the damage is lower than 0.5 (Fig. 5). Due to the exponential or power type damage-permeability interaction, the increase in damage-permeability outside the highly damaged zone is then largely less important than in the highly damaged zone. The as-sumptions of analytic model are then qualitatively justified.
As a total fluid flow through a specimen φt
con-sists of a flow through damaged φd and intact
mate-rial φo
φt = φd + φo (30)
Then a structural (average) permeability Kmean can
be determined as:
Kmean = Kd . Sd/S + Ko.So/S (31)
So that
Kmean = Kd .2Lc/πR + Ko (1 - 2Lc/πR) (32)
The application of the exponential local damage-permeability K=K0exp((αD)γ) yields:
Kmean = Ko( exp ((αD)γ) –1) . 2Lc/πR + Ko
Kmean – Ko = Ko (exp ((αD)γ) –1) . 2Lc/πR
Kmean – Ko = f(Lc,Ko)/R
(Kmean – Ko).R = f(Lc, Ko) (33)
The function f(Lc, Ko) is plotted for numerical results
on each size in figure 35. One can see that for dam-age values larger than 0.5-0.6, this function is inde-pendent on the specimen size.
1,0E-23 1,0E-20 1,0E-17 1,0E-14 1,0E-11 1,0E-08 1,0E-05 0,0 0,2 0,4 0,6 0,8 1,0 Dmax (local) (Km ean-Ko)xR (Kmean-Ko)xR_D11 (Kmean-Ko)xR_D22 (Kmean-Ko)xR_D44
Figure 35. Size effect law for total permeability increase.
These results point that the total increase of the mean permeability (Kmean-Ko) with local damage
(Dmax) is governed by a size effect law with a factor
(1/R) inversely proportional to the size, as shown in Eq. (27). The same type size effect law can be de-termined using power type damage-permeability in-teraction.
Furthermore, a ‘crack permeability’ described by a discrete formulation based on the Poiseuille’s flow between two parallel planes (crack), shows that (see e.g. Gérard et al. 1996):
∆ = 12 3 w K ς (34)
where K, w, ∆, ζ, are the ‘crack permeability’, the crack opening, the distance between the parallel cracks and the corrective factor of crack roughness respectively. In Brazilian splitting test, only one crack traverses the specimen, so that ∆ is equal to the cylinder diameter. One can see then that the ‘crack permeability’ depends on a factor inversely proportional to the size of the specimen. Both ap-proaches, discrete and continuum, are then in a good agreement.
This agreement is important since it has to occur if the continuum approach is expected to tend to-wards the discrete one for large values of damage. Obviously, the present analysis is not a proof that the discrete and continuum approaches are equiva-lent, but at least they are consistent from the view point of scale effects.
9 CLOSURE
The computing methodology and constitutive rela-tions presented in this review provide a compromise. In our opinion, it is a sufficiently accurate descrip-tion of the basic phenomena occurring at the mate-rial level and at the same time the solution strategy is simplified in order to be tractable from a computer resources point of view.
Obviously, it could be improved. In our opinion, the coupled effect between damage and saturation might not be negligible. At the same time, local computations are not totally meaningful, or at least reliable from a qualitative point of view and the is-sue of large scale problems computed with a contin-uum approach to failure is pending. Multi-scale models might open the path for possible solutions. In our opinion finally, it is the limit of the dam-age-permeability model at failure which is also of major concern. The issue of computing a crack width from a distribution of damage, of switching from a continuum and discrete approach to cracking (and thus switching permeability models at the same time) is pending.
ACKNOWLEDGEMENTS
Financial supports from the network on Degradation and Instabilities in Geomaterials with Application to Hazards Mitigation (DIGA), contract HPRN-CT-2002- 00220 and from the MAECENAS project
(FIS5-2001-00100) with the European Commission are gratefully acknowledged. The authors would like to thank EDF and the director of the MECEN pro-ject, Dr. S. Ghavamian for his help and his support.
REFERENCES
Abbas A., Carcasses M., Ollivier J.P., Gas permeability of con-crete in relation to its degree of saturation, Materials and Structures, 32, 3-8, 1999.
Bary B., Etude du couplage hydraulique – mécanique dans le béton endommagé, PhD Thesis, Laboratoire de Mécanique et Technologie, Cachan, France, 1996.
Bary B., Bournazel J.P., and Bourdarot E., Poro-Damage Ap-proach Applied toHydro-Mechanical Fracture Analysis of Concrete, J. Engrg.Mech. ASCE, 126, 937-943, 2000. Bangert F., Grasberger S., Kuhl D., and Meschke G.,
Environ-mentally Induced Deterioration in Concrete: Physical Moti-vations and Numerical Modeling, Engrg. Fract. Mech., 70, 891-910, 2003.
Bazant Z.P., Planas J., Fracture and size effect in concrete and other quasibrittle materials, CRC Press, 1998.
Bear J., Mathematical modelling of transport in porous media. J. Bear and J-M Buchlin eds., Kluwer Academic, Boston, 1991.
Benallal A., R. Billardon, G. Geymonat, Bifurcation and rate-independent materials, Bifurcation and stability of dissipa-tive systems, CISM Lecture Notes 327, Springer, 1-44, 1993.
Biot M.A., General Theory of Three-Dimensional Consolida-tion, J.Applied Phys., 12, 155–165, 1941.
Chatzigeorgiou G., V. Picandet., A. Khelidj, G. Pijaudier-Cabot : Coupling between progressive damage and perme-ability of concrete: analysis with a discrete model. Interna-tional Journal for Numerical and Analytical Methods in Geomechanics, 29, 1005-1018, 2005.
Chavant C.,Modélisations THHM. Généralités et algorithmes, Document code_aster R7.01.10, www.code-aster.org, 2001. Coussy O., Mechanics of Porous Continua, John Wiley
Inter-science, 1995.
Dana E., Skoczylas F., Gas relative permeability and pore structures of sandstones, International Journal of Rock Me-chanics and Mining Sciences, 36, 613-625, 1999.
De Arcangelis L., Herrmann H. J., Scaling and Multiscaling Laws in Random Fuse Networks. Physical Reviews B, 39, 2678-2684, 1989.
Debruyne G., Cirée B., Modélisation de la thermo hydratation, du séchage et du retrait du béton, Document R7.01.12, www.code-aster.org, 2001.
Delaplace A., Pijaudier-Cabot G., Roux S., Progressive dam-age in discrete models and consequences on continuum modeling. Journal of Mechanics and Physics of Solids, 44, 99-136, 1996.
Dormieux L. and Lemarchand E., Homogenization Approach of Advection and Diffusion in Cracked Porous Materials, J. Engrg.Mech. ASCE, 127, 1267-1274, 2001.
Dormieux L. and Kondo D., Approche micromécanique du couplage perméabilité endommagement, C.R.Mécanique, 332, 135-140, 2004.
Dullien F.A.L., Porous media, fluid transport and pore struc-ture, Academic Press, 1979.
Gawin D., Pesavento F., Schrefler B.A., Modelling of hygro thermal behavior of concrete at high temperatures with thermo chemical and mechanical material degradation, Computer methods in applied mechanics and engineering, 192, 1731-1171, 2003.
Gérard B., Breysse D., Ammouche A., Houdusse O., Dirdry O., Cracking and permeability of concrete under tension, Mater. Struct., 29, 141-151, 1996.
Gens A., Olivella S., THM phenomena in saturated and unsatu-rated porous media, Revue Française de Génie Civil, 5, 693-717, 2001.
Gopalaratnam V.S., Shah S.P., Softening Response of plain concrete in direct tension, ACI Journal, 310-323, 1985. Granger L., Comportement différé du béton dans les enceintes
de centrales nucléaires, analyse et modélisation, PhD The-sis, Ecole Nationale des Ponts et Chaussées, France, 1994. Hansen A., Roux S., Herrmann H. J.; Rupture of Central-Force
Lattices. J. Physique, 50, 733-744, 1989.
Herrmann H. J., Hansen A., Roux S., Fracture of disordered, elastic lattices in two dimensions. Physical Review B, 39, 637-648, 1989.
Jason L., Ghavamian S., Pijaudier-Cabot G., Huerta A., Benchmarks for the validation of a non local damage model, Revue Française de Génie Civil, 8, 303-328, 2004. Jason L., Huerta A., Pijaudier-Cabot G., Ghavamian S., An
elastic plastic damage formulation for concrete: application to elementary and structural tests, Computer Methods in Applied Mechanics and Engineering, in press, 2005.
Jason L., Relation endommagement – perméabilité pour les bé-tons. Application aux calculs de structures. PhD Thesis, Ecole Centrale de Nantes, France, 2004.
Krajcinovic, D. and Basista M., Rupture of Central Force Lat-tices Revisited, J. Physique, 1, 241-245, 1991.
Krajcinovic D. and Van Mier J.G.M., Damage and Fracture of Disordered Materials, CISM courses and lectures No. 410, 2000.
Lorentz E., Andrieux S., Analysis of nonlocal models through energetic formulations, International Journal of Solids and Structures, 40, 2905-2936, 2003.
Mensi R., Acker P., Attolou A., Séchage du béton : analyse et modélisation, Materials and Structures, 21, 3-12, 1988. Monlouis-Bonnaire J.P., Verdier J., Perrin B., Prediction of the
relative permeability to gas flow of cement – based materi-als, Cement and Concrete Research, 233, 1-8, 2003. Mainguy M., Coussy O., Baroghel-Bouny V., Role of air
pres-sure in drying of weakly permeable materials, Journal of Engineering mechanics, 127, 1225-1238, 2001.
Mazars J., Application de la mécanique de l’endommagement au comportement non linéaire et à la rupture du béton de structure, PhD Thesis, Université Pierre et Marie Curie, France, 1984.
Peerlings R.H.J., De Borst R., Brekelmans W.A.M., De Vree J.H.P, Spee I., Some observations on localisation in non lo-cal and gradient damage models, European Journal of Me-chanics, A/Solids, 15, 937-953, 1996.
Picandet V., Khelidj A., Bastian G., Effect of axial compres-sive damage on gas permeability of ordinary and high per-formance concrete, Cement and Concrete Research, 31, 1525-1532, 2001.
Pijaudier-Cabot G., Bazant Z.P., Nonlocal Damage Theory, Journal of Engineering Mechanics, 113, 1512-1533, 1987. Press W. H., Teukolsky S. A., Vetterling W. T., Flannery B. P.,
Numerical Recipes in FORTRAN 77: The Art of Scientific Computing. Cambridge University Press, 1992.
Van Genuchten M.T., A closed form for predicting the hydrau-lic conductivity of unsaturated soils, Soil Science Society of America Journal, 44, 892-898, 1980
Sfer D., Carol I., Gettu R., Etse G., Study of the behavior of concrete under triaxial compression, Journal of Engineering Mechanics, 128, 156-163, 2002.
Villain G., Baroghel-Bouny V., Kounkou C., Hua C., Mesure de la perméabilité au gaz en fonction du taux de saturation des bétons, Revue Française de Génie Civil, 5, 251-268, 2001.
Ulm F.J. and Coussy O., Strength Growth as Chemo-Plastic Hardening in Early Age Concrete, J. of Enrg. Mech. ASCE, 122, 1123-1132, 1996.
Ulm F.J., Torrenti J.M., and Adenot F., Chemoporoplasticity of Calcium Leaching in Concrete, J. of Engrg. Mech. ASCE, 125, 1200-1211, 1999.