HAL Id: hal-00068610
https://hal.archives-ouvertes.fr/hal-00068610
Submitted on 4 Oct 2018HAL is a multi-disciplinary open access archive for the deposit and dissemination of sci-entific research documents, whether they are pub-lished or not. The documents may come from teaching and research institutions in France or abroad, or from public or private research centers.
L’archive ouverte pluridisciplinaire HAL, est destinée au dépôt et à la diffusion de documents scientifiques de niveau recherche, publiés ou non, émanant des établissements d’enseignement et de recherche français ou étrangers, des laboratoires publics ou privés.
Gas Phase reactivity of Ni+ with urea. Mass
Spectrometry and Theoretical Studies
Mariona Sodupe, Marc Noguera, Luis Rodríguez-Santiago, Jean-Yves Salpin,
Jeanine Tortajada
To cite this version:
Mariona Sodupe, Marc Noguera, Luis Rodríguez-Santiago, Jean-Yves Salpin, Jeanine Tortajada. Gas Phase reactivity of Ni+ with urea. Mass Spectrometry and Theoretical Studies. Journal of Physical Chemistry A, American Chemical Society, 2003, 107 (46), pp.9865-9874. �10.1021/jp036216f�. �hal-00068610�
Gas Phase reactivity of Ni
+with urea. Mass Spectrometry and Theoretical
Studies
L. Rodríguez-Santiago,*† M. Noguera, † M. Sodupe,† J. Y. Salpin, ‡ J. Tortajada‡ Departament de Química, Universitat Autònoma de Barcelona. Bellaterra 08193.
Laboratoire Analyse et Environnement. CNRS UMR 8587, Université d’Evry-Val-d’Essonne, Boulevard François Mitterrand 91025 Evry Cedex.
Abstract
The gas phase reactivity of Ni+(urea) has been investigated by means of mass spectrometry techniques and density functional calculations. The major fragmentations observed in the MIKE spectrum of [Ni-urea]+ correspond to the loss of CO, NH3 and HNCO. The electrospray MS/MS spectrum shows also these fragmentations, however, an additional intense peak is detected matching to the elimination of water. In order to explain the differences observed in the reactivity under FAB or ESI conditions, several pathways leading to the experimental fragmentations have been considered theoretically. The exploration of the potential energy surfaces has shown that while the elimination of NH3 mainly arises from the non insertion mechanisms, the elimination of CO and HNCO arise exclusively from the insertion mechanisms. Elimination of water shows larger barriers, but under electrospray conditions the presence of the solvent can reduce these energy barriers leading to isomerizations of the [Ni-urea]+ complex in the source region. The results obtained have been also compared to those previously reported for Cu+. Calculations show that the most stable Ni+-urea complex has the Ni+ cation interacting with the oxygen, the computed binding energy being 66.3 kcal/mol.
† Universitat Autònoma de Barcelona ‡
Introduction
The cationization of relevant organic molecules by transition metals is one of the most important topics in gas phase chemistry,1-3 due to the important role that transition metals play in many biological processes. Transition metals are generally present in the biological fluids as isolated ions or complexed by different kind of peptides and proteins. They can also interact with other biomolecules such as nucleic acids inducing different effects that can vary from the stabilization of the helix to transcription failures.6-12 Gas phase studies on the interaction of transition metals with small model molecules is of great interest, since the knowledge of their intrinsic properties can provide important clues to understand the behavior of more complicated systems of biological importance.
Mass spectrometry techniques can be used to investigate metal cation complexes of small molecules of biological relevance such as amino acids or nucleobases.16-22 Metal cation association in the gas-phase usually implies a reorganization of the charge density of the molecule which results in the activation of one or several bonds. Thus, it is normal to observe, under mass spectrometry conditions, the spontaneous fragmentation of the cationized biomolecule. Assuming that the metal ion induces binding site specific fragmentation, such experiments can provide important information on the structure and intrinsic chemical reactivity of these systems. The experimental findings can be rationalized by a reliable description of the potential energy surface (PES) of the system in terms of local minima and transition states connecting them.
Previous studies in our groups have considered the interaction of Cu+, a closed shell cation with a d10 (1S) ground state, with different molecules23-27 such as formamide, guanidine, glycine and others which can be taken as model systems to understand the behavior of more complicated systems of biochemical importance. More recently, we have started to study the interaction of Ni+, an open shell cation with a d9 (2D) ground state, with
these and other model systems such as formamide28 or glycine.29 As copper, nickel cations play an important role in many biological processes. On the other hand, urea and its derivatives are of industrial and biochemical relevance. Therefore, the study of Ni+-ligand interactions and in particular the study of Ni+-urea system is of interest. Moreover, it is interesting to analyze the differences and similarities between Cu+ and Ni+ as a function of their electronic properties. Recent gas-phase studies24,28a of Ni+ and Cu+ interacting with formamide have shown a different reactivity between both systems. For Ni+-formamide, one of the observed fragmentations in the mass spectra correspond to the loss of CO.28a However, for Cu+-formamide, the loss of CO was not observed.24 This might be attributed to the fact that the energy barrier corresponding to the metal C-N insertion that lead to the OC-M+-NH3 precursor of CO in a multistep mechanism, was found to be much higher in energy for Cu+ than for Ni+.
The reactions of Cu+ with urea have been also studied recently both from experimental30,31 and theoretical points of view.30 In this latter study the fragmentation of Cu+-urea prepared by fast atom bombardment (FAB) was investigated. The spectrum showed several spontaneous losses, namely NH3, HNCO and H2O, which were rationalized through the exploration of the potential energy surface by means of the B3LYP density functional method. Recently, the dissociation behavior of Cu(urea)+ complexes generated by electrospray ionization has been also reported.31 In the present work we study the gas-phase reactions of Ni+ with urea using both mass spectrometry techniques and theoretical calculations. We first analyze the unimolecular decomposition of the Ni+-urea complexes generated either by fast atom bombardment or by electrospray. Secondly, we report theoretical calculations to describe the potential energy surface of the system. We study the coordination modes of Ni+ to urea and the possible pathways leading to the observed
fragmentations. Finally, we compare the results obtained with those previously reported for Cu+.30
Experimental section
The FAB mass spectrometric measurements were recorded on a double-focusing ZAB-HSQ mass spectrometer (VG Analytical) of BEqQ configuration32 (B and E represent the magnetic and electric sectors, q is a collision cell consisting of a rf-only quadrupole, and Q is a mass selective quadrupole). Complexes were generated by the CI-FAB method. The CI-FAB source was constructed from VG Analytical EI/CI and FAB ion source parts with the same modifications described by Freas et al.33 In that source the conventional FAB probe tip has been replaced by a foil of an alloy of chromium and nickel. “Naked” metal ions Cr+
and Ni+ were generated by bombarding this target with fast xenon atoms (Xe gas 7-8 keV kinetic energy, 1-2 mA of emission current in the FAB gun). Using alloys allows the production of different metal cations at the same time.
The organic samples were introduced via a heated inlet system at 100°C in a non-heated source. As mentioned by Schwarz et al.,34 we can assume that due to the relatively high pressure in the ion source (10-2-10-3 Pa), efficient collisional cooling of the ions takes place and therefore excited states of the Ni+ ions are not likely to participate in the observed reactivity. The metal ion adduct complexes formed with formamide were mass selected (using an acceleration voltage of 8kV) with the magnetic analyzer B. Metastable dissociations occurring in the second field-free region (2nd FFR) between the magnetic and the electric analyzers were monitored by scanning the latter one. The metastable ion reactions were studied by mass-analyzed ion kinetic energy spectroscopy (MIKES) techniques. The MIKE spectra were recorded at a resolving power of ~1000.
Electrospray mass spectra were recorded on an Applied Biosystems/MDS Sciex API2000 triple-quadrupole instrument fitted with a "turboionspray" ion source. An aqueous mixture of nickel chloride and urea (5 10-4 mol.L-1/5 10-4 mol.L-1) was introduced in the
source using direct infusion with a syringe pump, at a flow rate of 5 l/min. Ionization of the samples was achieved by applying a voltage of 5.5 kV on the sprayer probe and by the use of a nebulizing gas (GAS1, air) surrounding the sprayer probe, intersected by a heated gas (GAS2, air) at an angle of approximately 90°. The operating pressure of GAS1 and GAS2 are adjusted to 2.1 bars, by means of an electronic board (pressure sensors), as a fraction of the air
inlet pressure. The curtain gas (N2), which prevents air or solvent from entering the analyser
region, was similarly adjusted to a value of 1.4 bars. The temperature of GAS2 was set at
100°C.
MS/MS spectra were carried out by introducing nitrogen as collision gas in the second quadrupole at a total pressure of 3x10⁻⁵ mbar, the background pressure being around 10-5 mbar. As detailed later, the declustering potential (DP), defined as the difference of potentials between the orifice plate and the skimmer (grounded), and typically referred to as the "cone voltage" for other electrospray interfaces, was fixed to 120 V to perform MS/MS experiments.
Unless otherwise noted, mass to charge ratios mentioned in throughout this paper refer to as peaks which include the most abundant Ni and Cl isotopes (58Ni and 35Cl).
Urea and nickel salts were purchased from Aldrich and were used without further purification.
Computational details
Full geometry optimizations and harmonic frequency calculations were carried out using the B3LYP density functional35 approach as implemented in Gaussian 98 set of programs package.36
B3LYP is a hybrid density functional method that includes Becke’s three-parameter non-local exchange potential and the non-local correlation functional developed by Lee, Yang and Parr. This method has proven to give results that are in very good agreement with experimental data in many systems containing transition metal atoms.37-41 In particular, the B3LYP method has been used to theoretically determine metal cation affinities for several small compounds that are in good agreement with experiments. Moreover, previous studies on Ni+-ligand systems with B3LYP approach have given similar results to those obtained with CCSD(T) level of theory.29 Even more, B3LYP method has been able to qualitatively explain the observed gas-phase reactivity in these studies.
It is known that for a given atomic electronic configuration, currently used functionals are not invariant over the set of densities associated with a degenerate atomic state, which implies that different occupancies corresponding to the same pure atomic state can lead to different energies.42 In the present work, the B3LYP relative energies have been computed considering the orbital occupation of Ni+ that lead to the lowest energy.
The geometries of the considered species were optimized using the following basis set. For Ni, the all-electron basis of Wachters43 supplemented with two diffuse p and one diffuse d functions44 with the form (14s 11p 6d)/[8s 6p 4d] was used. Dunning’s (9s 5p)/[4s 2p] basis
set45 supplemented with a valence diffuse function (sp=0.0438 for carbon, sp=0.0639 for nitrogen and sp=0.0845 for oxygen) and one d polarization function (=0.75 for carbon, =0.80 for nitrogen and =0.85 for oxygen) was used for C, N and O atoms. For H, the basis set used was Dunning’s (4s)/[2s] supplemented with a valence diffuse function (sp=0.036) and a p polarization function (=1.00). Frequency calculations were performed using the same basis set in order to confirm the nature (minimum or transition state) of the stationary points. In order to confirm the minima connected by a given transition state we have carried out intrinsic reaction coordinate (IRC) calculations. The basis set for all atoms except the
metal center is referred to as D95++(d,p) in the Gaussian 98 package, and the whole set will be referred to as Basis1 from now on.
Single-point calculations were carried out using a larger basis set for all geometries that were relevant in the studied fragmentation mechanisms. This basis set is the following. For Ni the basis set 1 is supplemented with a single contracted set of f polarization functions based on a three-term fit to a Slater type orbital with the final form (14s 11p 6d 3f)/[8s 6p 4d 1f]. For C, N, O and H atoms the basis set described as 6-311+G(2df,2p) in Gaussian 98 Package was used. This set will be referred to as Basis2 hereafter.
In order to get further insight in bonding nature, natural bond orbital analysis of Weinhold and Carpenter was used.46
Results and discussion
Figure 1a shows the FAB mass spectrum that results from the gas-phase reactions of nickel and chromium ions with urea. The existence of 58Ni and 60Ni isotopes leads to an easy identification of nickel containing species. The base peak of the spectrum corresponds to the Cr+ ion at m/z 52 and the most abundant Ni containing species is the Ni+ ion itself at m/z 58. The Ni+ ions react with neutral urea to produce mainly [Ni-urea]+ adduct ions at m/z 118. Besides these ions, an intense peak at m/z 75 is observed and corresponds to [Ni-NH3]+, which arises from the loss of HNCO in the source.
The unimolecular decomposition of the [Ni-urea]+ complex has been investigated by means of the MIKES analysis to obtain information related to the structure and reactivity of this complex ion. The MIKE spectrum is shown in Figure 1b and shows that the [Ni-urea]+ ion undergoes fragmentation by several different pathways. The major fragmentation corresponds to the loss of CO to produce a [Ni-N2H4]+ ion at m/z 90. This is the base peak of
the MIKE spectrum. A very intense peak is also observed for the loss of NH3 at m/z 101. Another two small peaks are observed at m/z 58 and m/z 75 that correspond to Ni+ and to the elimination of HNCO respectively. These results are somewhat different from that observed for the Cu+-urea complex (generated by FAB) where the base peak of the spectrum corresponded to the loss of NH3 and no loss of CO was observed.30
The electrospray spectrum of an aqueous nickel chloride/urea mixture is very dependent upon the cone voltage, also referred to as the declustering potential (DP) in our instrument. At DP=20 Volts, the spectrum is dominated by NiOH(H2O)m+ ions (m=1-3) and peaks corresponding to protonation of urea. Increasing the DP value results in appearence of deprotonated [Ni(urea)n – H]+ species (with n= 1,2) and [NiCl(urea)p]+ (p=1-3; m/z 153, 213 and 273). A high value of DP (more than 100 V) is necessary to observe the [Ni-urea]+ ion (m/z 118) but its intensity remains low (few percents).
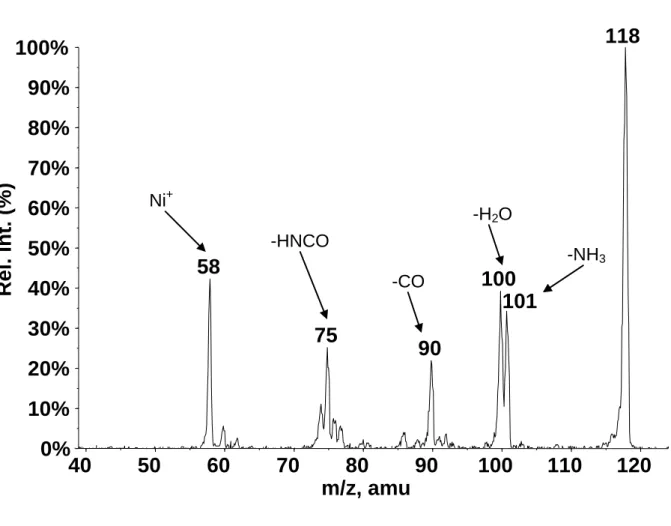
The electrospray MS/MS spectrum of the [Ni-urea]+ ion recorded at DP=120 volts and
with a collision energy of 15 eV (laboratory frame) is presented in Figure 2. When using
nitrogen as collision gas, this corresponds to a maximal transferable internal energy of 2.9 eV
(center of mass frame). Nevertheless, it is worth mentioning that given the length of the
second quadrupole and the pressure of nitrogen, a multiple collision regime is very likely and
will increase the internal energy content of the parent ion.
The electrospray MS/MS spectrum is qualitatively comparable to that obtained under FAB conditions, since elimination of ammonia, carbon monoxide and urea are also observed. However, an additional peak is detected at m/z 100, corresponding to elimination of water. As already proposed by Schröder during the study of the unimolecular reactivity of the [Cu-urea]+ species generated by electrospray, this fragmentation could be attributed to a partial collision-induced isomerization of [Ni-urea]+ complex in the cone region prior to mass
selection by the first quadrupole. In addition, other much less intense peaks, that could be assigned to loss of N2H4, NCO and H2NCO, are observed.
In order to rationalize these experimental findings we have studied the most important characteristics of the potential energy surface by means of the B3LYP density functional method. We have considered the different isomers of the Ni+-urea complex and the possible reactions that lead to the observed fragments.
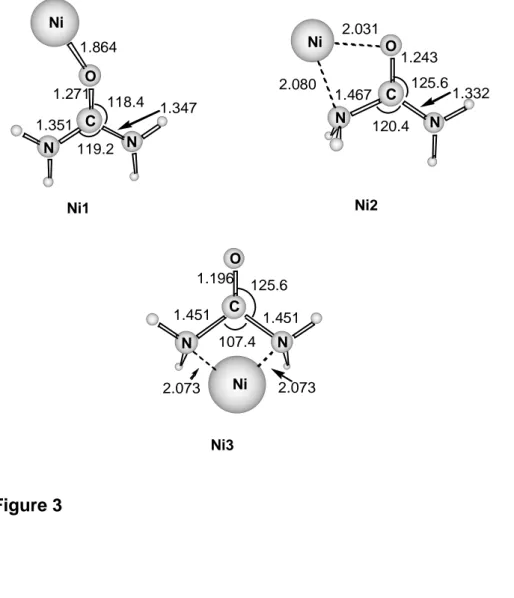
Coordination of Ni+ to urea. The optimized geometries of the different conformers of Ni+-urea are shown in Figure 3. We have considered the coordination of Ni+ to the different basic sites of urea. The most stable structure, Ni1, corresponds to the attachment of the metal cation to the oxygen atom. The same structure was found to be the most stable one in the case of the Cu+-urea complex.30 The second most stable structure, Ni2, is only 2.4 kcal mol-1 less stable than Ni1 and corresponds to the Ni+ cation bridging between the O and N atoms. Finally, the Ni3 structure, corresponds to the metal cation interacting with both nitrogen atoms and lies 12.0 kcal mol-1 above the most stable structure.
The bonding between Ni+ and urea is essentially of electrostatic nature and arises from the interaction of the 2D (d9) state of Ni+ with the 1A1 state of urea. The natural population analysis shows that the metal charge is in all cases larger than 0.84 and the spin density is almost entirely located over the metal atom. This fact shows that the charge transfer is not important for the description of the bonding in this complex or, at least, it is of the same magnitude in all the studied isomers. Thus, the relative stability of the different structures is determined mostly by other factors: the deformation energy of urea defined as the energy difference between the most stable conformer of neutral urea and the urea sub-unit in the complex, the electrostatic interaction, the polarization of urea due to the presence of the metal cation and the metal-ligand repulsion. As a result, the most stable structure corresponds to the interaction of the metal cation with the oxygen of the most stable structure of urea. In the two
other structures the urea sub-unit is significantly deformed which implies an additional energy cost.
If we orient the molecule with the two nitrogen, the carbon and the oxygen atoms in the xz plane, with the CO bond corresponding to the z axis, the monooccupied orbital of the Ni1 structure mainly corresponds to the dz2 orbital of the metal slightly polarized through sd hybridization to reduce the repulsion with the lone pair of the oxygen atom. The open shell of the other two isomers, Ni2 and Ni3, mainly corresponds to the dx2-y2 and dxz orbitals, respectively. In these cases, metal-ligand repulsion is reduced by mixing with the corresponding 4p orbital of the metal cation, which is less efficient than the sd mixing.
The computed binding energy of the Ni+-urea complex is estimated to be 66.5 kcal mol-1 and to 66.3 kcal mol-1, when the B3LYP functional is used in combination with the Basis1 and Basis2, respectively. These values are somewhat larger than that found for Cu+ -urea, 62.3 kcal mol-1, at the B3LYP/6-311+G(2df,2p) level.30 This behavior has already been reported for other systems, both theoretically3,24,26-29 and experimentally3 and is due to the smaller metal-ligand repulsion in the Ni+ compounds.
Reactivity. As shown previously, the major fragmentations of the Ni+-urea adduct under FAB/MIKE conditions correspond to the loss of CO and to the loss of NH3. Elimination of HNCO and the ligand are also observed in a smaller proportion. Similar results are obtained in the ESI MS/MS spectrum, except for the presence of an additional peak corresponding to the fragmentation of a water molecule. We have considered isomers Ni1 and Ni2, separated only by 2 kcal mol-1, as starting points for the studies of the observed fragmentations. In order to obtain the elimination of NH3, a hydrogen atom has to be transferred from one NH2 group to the other one. Then, the obtained complex can dissociate leading to the loss of NH3.
The starting point of the reaction leading to the elimination of CO is not so evident. The reaction could start with the insertion of the metal cation into one of the C-N bonds of urea. Actually, the attachment of the metal cation to the ligand in the Ni2 isomer yields an important activation of the C-N bond, which goes from 1.381 Å in the free ligand to 1.467 Å in the complex. After Ni+ insertion, further rearrangements of the complex can produce a precursor for the elimination of carbon monoxide.
To gain some insight into the reactivity of the Ni+-urea complex we have explored different mechanisms which originates from Ni1 or Ni2 by means of the B3LYP method.
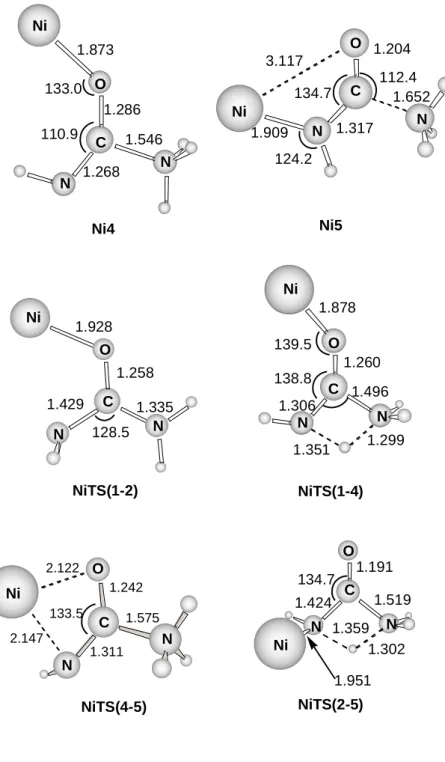
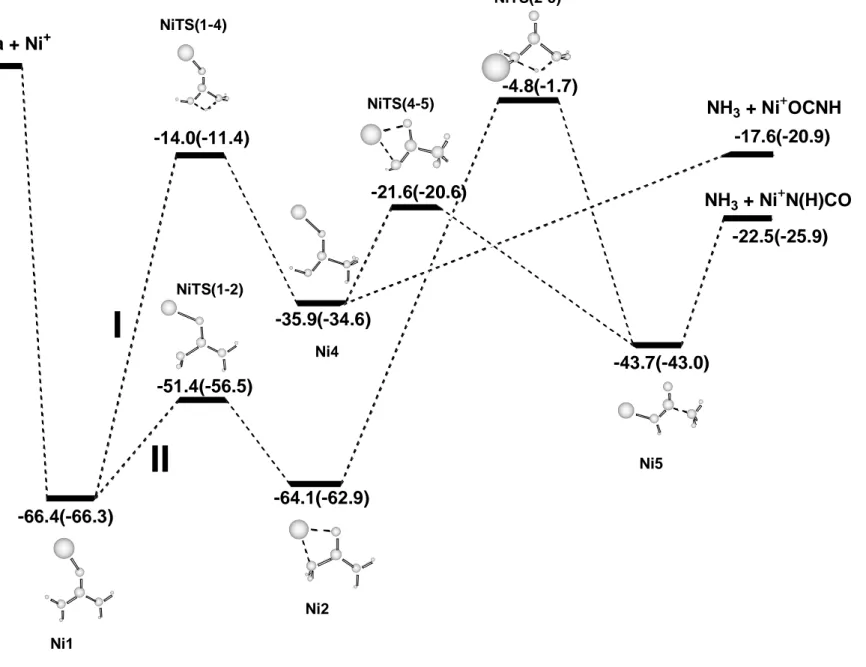
Non insertion mechanisms. Figure 4 shows the optimized intermediates and transition states involved in the mechanism. Figure 5 presents the energy profiles of the mechanisms that originate from a hydrogen transfer from one NH2 group to the other one, either in the Ni1 structure or in the Ni2 one. Relative energies with Basis 1(Basis 2) are given with respect to the ground state reactants Ni+ + urea. Since no significant differences are found when enlarging the basis set, we will mainly refer to Basis 1 along the discussion.
Figure 5 shows that all the calculated structures lie below the reactants Ni+ + urea. The most stable Ni1 isomer can evolve through two different pathways. The direct transfer of a hydrogen atom from one NH2 to the other (path I) leads to structure Ni4 through a barrier of 52.4 kcal mol-1. Ni4 is 35.9 kcal mol-1 below the reactants and can produce the elimination of NH3 without barrier in excess leading to NH3 + Ni+-OCNH. This dissociation is energetically favorable by 17.6 kcal mol-1 with respect to the reactants. More favorable than this dissociation is the evolution of structure Ni4 to Ni5 through the transition state NiTS(4-5). This step has a barrier of 14.3 kcal mol-1 and the resulting structure Ni5 is 43.7 kcal mol-1 lower than the reactants. It can be observed in Figure 4 that the C-NH3 distance in this structure has lengthened compared to the previous structure Ni4. Such changes in the C-N bond length are due to the different Ni+ coordination. In Ni4, the Ni+ cation is interacting
with the oxygen atom so that the carbonylic CO bond acquires an important CO character, whereas in Ni5, Ni+ interacts with the nitrogen atom and the C-O double bond is maintained.
Pathway II starts with the interconversion of conformers Ni1 and Ni2 of Ni+-urea. The transition state NiTS(1-2) that connects the two conformers provides an energy barrier of 15.0 kcal mol-1 with respect to Ni1. Starting from Ni2, one of the hydrogen atoms of the NH2 group attached to the metal atom can be transferred to the other NH2 group leading to isomer
Ni5 through a barrier of 59.3 kcal mol-1. The transition state connecting both minima is NiTS(2-5) and is only 4.8 kcal mol-1 more stable than the reactants. Thus, this second pathway seems less favorable than the previous one. All of the structures studied lie energetically below the reactants Ni+ + urea and these mechanisms will only contribute to the loss of NH3 peak of the observed spectra.
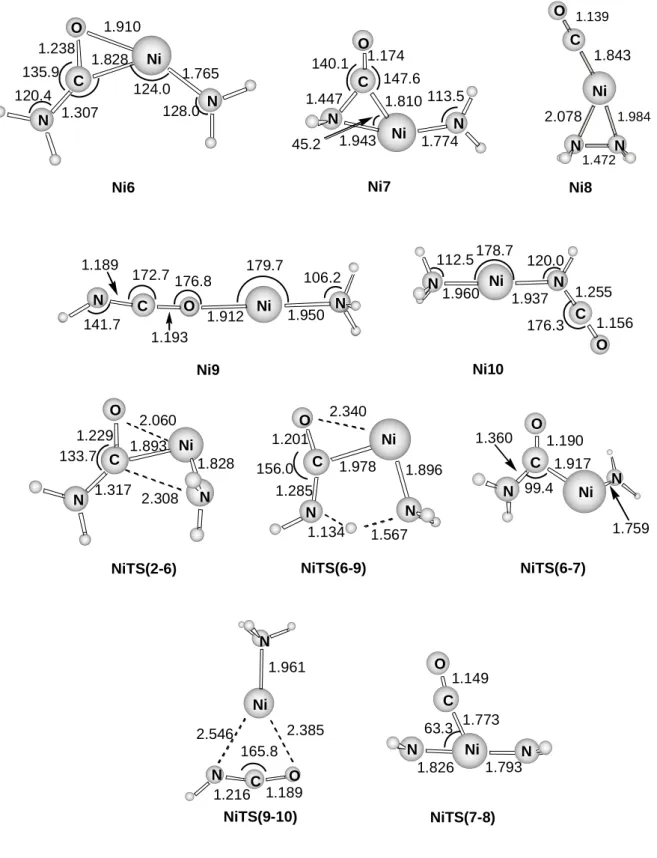
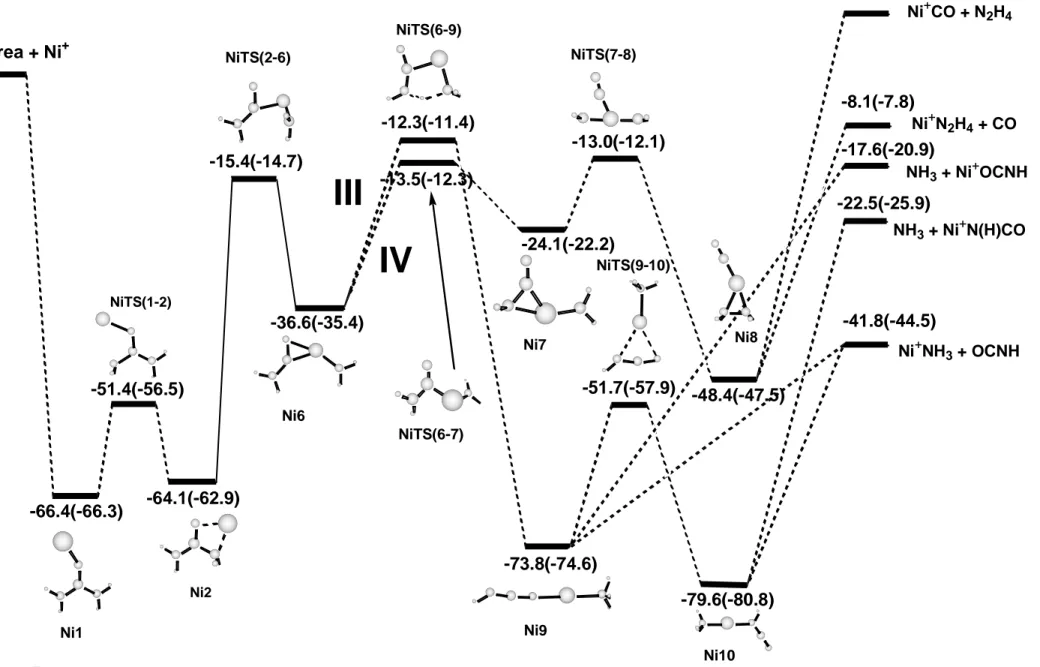
Insertion mechanisms. Figures 6 shows the structures of the intermediates and transition states involved in the insertion mechanisms. For all the inserted structures except for Ni6 and Ni7 natural population analysis shows that the spin density is located at the metal atom (always larger than 0.9). For Ni6 and Ni7 the spin density is more delocalized, the obtained values at the metal center being about 0.5. In any case, none of these structures show spin contamination and the corresponding quartet states were computed much higher in energy. Figure 7 shows an schematic representation of the different pathways that can take place once the metal cation has inserted into one of the C-N bonds of urea. As mentioned above, the evolution of the monocoordinated Ni1 structure to the dicoordinated Ni2 one results in an activation of the adjacent C-N bond. The following insertion of the metal cation produces complex Ni6 through an energy barrier of 48.7 kcal mol-1. The Ni6 complex is a tricoordinated structure where the metal cation is bonded to the nitrogen of one NH2 group and to the C and O atoms of the H2NCO moiety. This complex lies 36.6 kcal mol-1 below the reactants and two distinct pathways starting from it are possible. The first one, III,
corresponds to a hydrogen transfer from the NH2 group attached to the carbon atom to the other NH2 group leading to a very stable dicoordinated complex, -73.8 kcal mol-1, noted as
Ni9 in Figures 6 and 7. This step takes place through a transition state, NiTS(6-9), which is 12.3 kcal mol-1 lower in energy than the reactants. The dicoordinated complex Ni9 can dissociate to produce either HNCO + Ni+-NH3 or NH3 + Ni+-OCNH without barrier in excess, the loss of OCNH being more favorable.
Structure Ni9 can undergo a different transformation and lead to the formation of an even more stable dicoordinated species, Ni10, in which the OCNH group is attached to the metal cation through the nitrogen atom instead of the oxygen atom as in Ni9. Such transformation takes place through the NiTS(9-10) with an energy barrier of 22.1 kcal mol-1. As for Cu+, this structure Ni10 is the global minimum of the potential energy surface. This is not surprising considering that these cations form quite stable linear dicoordinated species due
to their ability to reduce metal-ligand repulsion through sd hybridization. Moreover, Ni10 is more stable than Ni9 because the –NH group has a larger cation affinity than oxygen. Dissociation from Ni10 can produce either the loss of NH3 or the loss of HNCO yielding the products NH3 + Ni+-N(H)CO or HNCO + Ni+-NH3. The computed relative energies indicate that the dissociation into HNCO + Ni+-NH3 is the preferred fragmentation; that is, the Ni+ -NH3 binding energy is larger than the Ni+-N(H)CO one. This behavior is the same than that found for the Cu+ metal cation30 and is consistent with the differences in the proton affinities of NH3 (204 kcal/mol) and HNCO (180 kcal/mol).47 However, the peak corresponding to the loss of OCNH is much less intense than that of NH3 and so, the product distribution significantly deviate from that expected based on thermochemical criteria only. This can be due, in part, to the fact that the loss of NH3 can be also produced from a non-insertion mechanism or, as it has already been suggested for Cu+-urea,31 to the fact that the very stable
intermediate NH3-Ni+-N(H)CO, Ni10, is unlikely to be a precursor of the NH3 dissociation, the product distribution being determined by reaction dynamics.
The second possibility, IV, involves the rotation of the NiNH2 moiety of Ni6. This rotation leads to structure Ni7 where the Ni+ atom is tricoordinated to NH2 and the carbon and nitrogen atoms of the H2NCO sub-unit, in contrast to Ni6 where the metal cation is coordinated to the carbon and oxygen atoms of the same group. This step takes place through the transition state NiTS(6-7) which lies 13.5 kcal mol-1 below the reactants. The NiTS(7-8) transition state connects structures Ni7 and Ni8 with an energy barrier of 11.1 kcal mol-1. Structure Ni8 is also tricoordinated and corresponds to the Ni+ atom bonded to N2H4, forming a three-membered ring, and to the CO molecule. This isomer, Ni8, which is 48.4 kcal mol-1 lower in energy than the reactants, can undergo dissociation to produce CO + Ni+-N2H4 without reverse activation barrier.
At this stage, some features have to be pointed out. First of all, the exploration of the potential energy surface has shown that the elimination of NH3 has lower barriers for pathways involving non insertion mechanisms. In contrast, elimination of CO and HNCO arise exclusively from the insertion mechanisms. Morevover, all the barriers leading to the experimentally obtained fragmentations (paths I, III and IV) are approximately of the same magnitude and approach the energy of the different dissociation channels. As noticed by Schröder et al.31, in this case the energized [Ni-urea]+ complexes can lead to fragmentations with branching ratios that do not correlate with reaction themochemistry, because very stable intermediates, like Ni9 or Ni10, are not involved in the dissociation of the energized [Ni-urea]+ complex. This fact explains the similar intensity of the peaks corresponding to the elimination of NH3 and CO in the spectra.
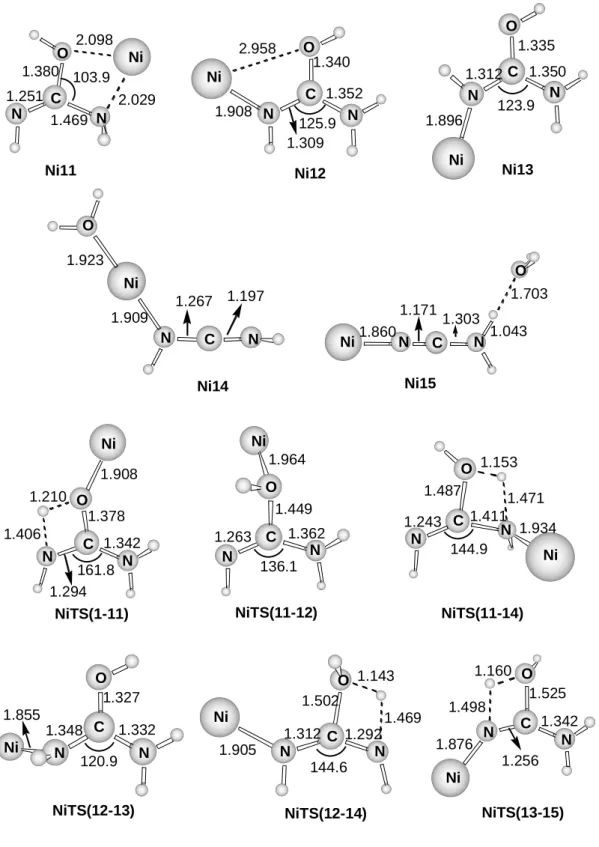
intermediates and transition states as well as the pathways involved in the elimination of a water molecule. The first step in all cases is the transfer of a hydrogen atom from one of the NH2 groups to the oxygen atom. After that, different rearrangements can take place in order to facilitate a second hydrogen transfer from the remaining NH group or from the other NH2 group. Depending on the origin of the second hydrogen transfer two different structures can be obtained. The first one, Ni14, corresponds to the bisligated complex [H2O-Ni-N(H)CNH]+. In the second one, Ni15, the water molecule is bonded to the NH2 group of [Ni-NCNH2]+. This structure lies XXX kcal/mol above the bisligated [H2O-Ni-NCNH2]+, but is the one obtained in the IRC calculation. Dissociation from these structures leads to the loss of H2O.
All the paths shown in Figure 9 exhibit energy barriers higher than the reactants. This behavior explains the absence of the corresponding peak in the FAB/MIKE spectrum. The presence of the peak in the ESI/CID spectrum has been analyzed in detail by Schröder et al.31 for the [Cu-urea]+ complex. They suggest that the reaction leading to this fragmentation can be attributed to a collision induced isomerization of the complex in the cone region. Such an isomerization in our case would lead to complexes Ni14 or Ni15 and is mediated by proton assisted catalysis involving the protic solvents, thus reducing the energy barriers of the process.
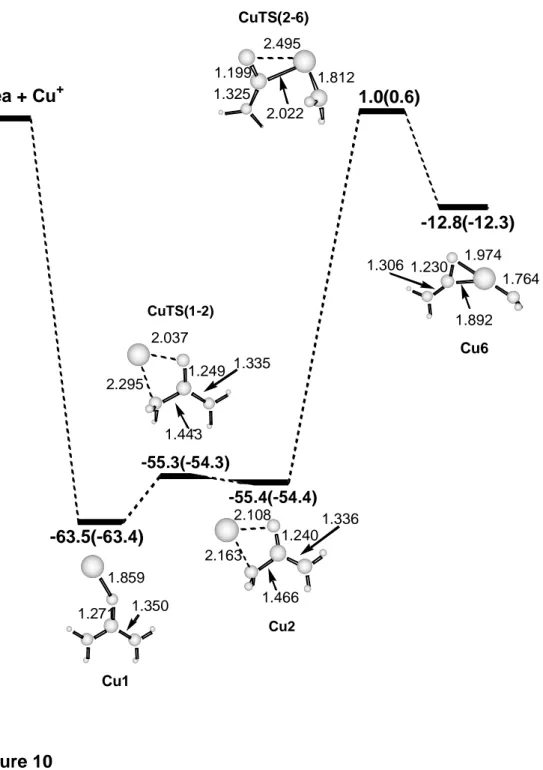
Comparison with the Cu+-urea system. As noted above, the main difference between the MIKE spectra of Ni+-urea and Cu+-urea, reported by Luna et al.,30 is the absence of the loss of CO peak in the second case. As we have demonstrated, the elimination of carbon monoxide takes place after different rearrangements of the inserted structure Ni6. In the case of Cu+-urea, Luna et al.30 also considered the equivalent Cu+ inserted structure. However, the transition state for the metal cation insertion was not shown in their study. Thus, we have calculated the first steps of the Cu+ insertion mechanism using the same methodology as for Ni+-urea. Results are presented in Figure 10. First of all, it can be
observed that the energy difference between the Cu2 and Cu1 isomers (8.1 kcal mol-1) is larger than in the case of the equivalent Ni+ isomers. It should be also noted that the transition state connecting both isomers is shifted to Cu2 and, accordingly, its energy is almost degenerate with Cu2. Finally, the energy of the transition state leading to the inserted Cu+ structure, CuTS(2-6), is 1 kcal mol-1 larger than the energy of the reactants Cu+ + urea, in contrast to NiTS(2-6) which lies 15.4 kcal mol-1 below Ni+ + urea. Consequently, in the Cu+ system the insertion mechanism seems to be much less favorable than the non insertion mechanisms considered by Luna et al. in their previous work.30 Therefore, the elimination of the other fragments is favored compared to the elimination of CO in the case of Cu+-urea, and the last one is not observed in the MIKE spectrum.
Conclusions
Gas phase reactions between Ni+ and urea under CI-FAB conditions lead to the formation of [Ni-urea]+ adduct (m/z 118). This species can be also generated by electrospray provided a high cone voltage is used. B3LYP calculations have shown that the most stable Ni+-urea complex has the Ni+ cation interacting with the carbonylic oxygen, the computed binding energy being 66.3 kcal/mol. In all conformers, the bonding is mainly electrostatic and the relative energies can be explained in terms of the deformation energy of the ligand and the electrostatic+polarization stabilization energy.
The MIKE spectrum of [Ni-urea]+ shows that the main fragmentations correspond to the loss of CO (m/z 90) and NH3 (m/z 101). These two ions are also observed on the low-energy CID spectrum of the [Ni-urea]+ obtained by electrospray ionization. The CID spectrum also exhibits a peak at m/z 100 (elimination of water) which suggests that a partial collision-induced isomerization of [Ni-urea]+ complex in the cone region problably takes places prior to
selection by the first quadrupole. Different non-insertion and insertion mechanisms leading to these fragments have been considered theoretically. The exploration of the potential energy surfaces has shown that the elimination of NH3 is likely to be produced from non insertion mechanisms which have lower barriers, whereas the elimination of CO and HNCO arise exclusively from the insertion mechanisms. In general, calculations explain the major fragmentations observed. However, the intensity of the different peaks, especially that corresponding to the loss of HNCO, cannot be explained only from thermochemical criteria, the product distribution being determined by reaction dynamics. Elimination of H2O shows high energy barriers and the presence of this peak in the ESI/CID spectrum indicates a collision induced isomerization of the [Ni-urea]+ complex catalyzed by the protic solvents, leading to suitable isomers for the H2O elimination in the source region of the spectrometer.
The open shell Ni+ (d9) cation presents a different behavior than the closed shell Cu(d10), given that the loss of CO peak is not observed in the second case. Differences are attributed to the fact that the insertion mechanisms are less favorable for Cu+ than for Ni+.
Acknowledgements
Financial support from DGICYT, through the BQ2002-04112-C02-01 project, and the use of the computational facilities of the Catalonia Supercomputer Center (CESCA) are gratefully acknowledged. M. S. is indebted to the Departament d’Universitats, Recerca i Societat de la Informació of the Generalitat de Catalunya for financial support. The authors are also indebted to the "Conseil General d'Ile de France" for financial support.
References
1. Eller, K.; Schwarz, H.; Chem. Rev. 1991, 91, 1121.
2. Gas-Phase Metal Reactions; Fontijn A., Ed.; North Holland: Amsterdam, 1992.
3. Organometallic Ion Chemistry; Freiser, B. S., Ed; Kluwer Academic Publishers: Dordrecht, 1995.
4. Principles of nucleic acid structures; Sanger, W Springer, New York. 1984.
5. Sabat, M.; Lippert, B.; Metal Ions in Biological Systems; Sigel, A.; Sigel, H.; Eds; 33, Marcel Dekker, New York, 1996
6. Anwander, E. H. S.; Probst, M. M.; Rode, B. M. Biopolymers 1990, 29A, 757. 7. Burda, J. V.; Šponer, J.; Hobza, P. J. Phys. Chem. 1996, 100, 7250.
8. Cerda, B. A.; Wesdemiotis, C. J. Am. Chem. Soc. 1996, 118, 11884.
9. Gadre, S. R.; Pundlik, S. S.; Limaye, A. C.; Rendell, A. P. Chem. Comm. 1998, 573. 10. Rodgers, M. T.; Armentrout, P. B. J. Am. Chem. Soc. 2000, 122, 8548.
11. Risso, N.; Toscano, M.; Grand, A. J. Am. Chem. Soc. 2001, 123, 10272.
12. Csaszar, K.; Špačková, N.; Štefl, R.; Šponer, J.; Leontis, N. B. J. Mol. Biol. 2001, 313, 1073.
13. (a) Wen, D.; Yalcin, T.; Harrison, A. G. Rapid Commun. Mass Spectrom. 1995, 9, 1155. (b) Yalcin, T.; Wang, J.; Wen, D.; Harrison, A. G. J. Am. Soc. Mass Spectrom. 1997, 8, 749.
14. . Lei, Q. P.; Amster, I. J. J. Am. Soc. Mass Spectrom. 1996, 7, 722.
15. (a) Bouchonnet, S.; Hoppiliard, Y.; Ohanessian, G. J. Mass Spectrom. 1995, 30, 172. (b) Lavanant, H.; Hoppiliard, Y. J. Mass Spectrom. 1997, 32, 1037. (c) Lavanant, H.; Hoppiliard, Y. Eur. Mass Spectrom. 1995, 5, 41. (d) Lavanant, H.; Hecquet, E.; Hoppiliard, Y. Int. J. Mass Spectrom. 1999, 185, 11. (e) Rogalewicz, F.; Hoppiliard, Y.; Ohanessian, G. Int. J. Mass Spectrom. 2000, 201, 307. (f) Hoppiliard, Y.;
Rogalewicz, F.; Ohanessian, G. Int. J. Mass Spectrom. 2000, 204, 267. (g) Rogalewicz, F.; Hoppiliard, Y.; Ohanessian, G. Int. J. Mass Spectrom. 2001, 206, 45. (h) Rogalewicz, F.; Hoppiliard, Y.; Ohanessian, G. Int. J. Mass Spectrom. 2003, 227, 439.
16. (a) Cerda, B. A.; Wesdemiotis, C. J. Am. Chem. Soc. 1995, 117, 9734. (b) Polce, M. J.; Beranova, S.; Nold, M. J.; Wesdemiotis, C. J. Mass Spectrom. 1996, 31, 1073. (c) Cerda, B. A.; Wesdemiotis, C. J. Am. Chem. Soc. 1996, 118, 11884. (d) Cerda, B. A.; Wesdemiotis, C. Int. J. Mass Spectrom. 1999, 185, 107. (e) Ryzhov, V.; Dunbar, R. C.; Cerda, B. A.; Wesdemiotis, C. J. Am. Chem. Soc. Mass Spectrom. 2000, 11, 1037. (f) Kish, M. M.; Ohanessian, G.; Wesdemiotis, C. Int. J. Mass Spectrom. 2003, 227, 509.
17. (a) Wyttenbach, T.; Witt, M.; Bowers, M. T. Int. J. Mass Spectrom. 1999, 182, 243. (b) Wyttenbach, T.; Witt, M.; Bowers, M. T. J. Am. Chem. Soc. 2000, 122, 3458. 18. (a) Jockusch, R. A.; Price, W. D.; Williams, E. R. J. Phys. Chem. A 1999, 103, 9266.
(b) Strittmatter, E. F.; Lemoff, A. S.; E. R. Williams J. Phys. Chem. A 2000, 104, 9793. (c) Jockusch, R. A.; Lemoff, A. S.; E. R. Williams J. Am. Chem. Soc. 2001, 123, 12255.
19. Russo, N.; Toscano, M.; Grand, A. J. Phys. Chem. B 2001, 105, 4735.
20. Pedersen, D.B.; Zgierski, M. Z.; Denommee, S.; Simard, B. J. Am. Chem. Soc. 2002,
124, 6686.
21. (a) Rodgers, M. T.; Armentrout, P. B. J. Am. Chem. Soc. 2000, 122, 8548. (b) Rodgers, M. T.; Armentrout, P. B. J. Am. Chem. Soc. 2002, 124, 2678.
22. Ai, H.; Bu, Y.; Han, K. J. Chem. Phys. 2003, 118, 10973.
23. Luna, A.; Amekraz, B.; Morizur, J. P.; Tortajada, J.; Mo, O.; Yañez, M. J. Phys.
24. Luna, A.; Amekraz, B.; Tortajada, J.; Morizur, J. P.; Alcamí, M.; Mo, O.; Yañez, M.
J. Am. Chem. Soc. 1998, 120, 5411.
25. Luna, A.; Morizur, J. P.; Tortajada, J.; Alcamí, M.; Mo, O.; Yañez, M. J. Phys. Chem.
A 1998, 102, 4652.
26. Bertran, J.; Rodríguez-Santiago, L.; Sodupe, M. J. Phys.Chem. B 1999, 103, 2310. 27. Luna, A.; Amekraz, B.; Tortajada, J. Chem. Phys. Lett. 1997, 266, 31.
28. a) Rodríguez-Santiago, L.; Tortajada, J. Int. J. Mass. Spectrom. 2002, 219, 429. b) Luna, A.; Alcamí, M.; Mo, O.; Yañez, M.; Tortajada, J. Int. J. Mass Spectrom. 2002,
217, 119.
29. Rodríguez-Santiago, L.; Sodupe, M.; Tortajada, J. J. Phys. Chem. A 2001, 105, 5340. 30. Luna, A.; Amekraz, B.; Morizur, J. P.; Tortajada, J.; Mo, O.; Yañez, M. J. Phys.
Chem. A 2000, 104, 3132.
31. Schröder, D.; Weiske, T.; Scharwz, H. Int. J. Mass, Spectrom. 2002, 219, 729.
32. Harrison, A. G.; Mercer, R. S.; Reinee, E. J.; Young, A. B.; Boyd, R. K.; March, R. E.; Porter, C. J. Int. J. Mass Spectrom. Ion Process. 1986, 74, 13.
33. Freas, R. B.; Ross, M. M.; Campana, J. E. J. Am. Chem. Soc. 1985, 107, 6195. 34. G. Hornung, G.; Schröder, D.; Schwarz, H. J. Am. Chem. Soc. 1995, 117, 8192. 35. (a) Becke, A.D. J. Chem. Phys. 1993, 98, 5648. (b) Lee, C.; Yang, W.; Parr, R.G.
Phys. Rev. B 1988, 37, 785. (c) Stevens, P.J.; Devlin, F.J.; Chablowski, C.F.; Frisch,
M.J. J. Phys. Chem. 1994, 98, 11623.
36. Gaussian 98, Revision A.7, Frisch, M. J.; Trucks, G. W.; Schlegel, H. B.; Scuseria, G. E.; Robb, M. A.; Cheeseman, J. R.; Zakrzewski, V. G.; Montgomery, Jr., J. A.; Stratmann, R. E.; Burant, J. C.; Dapprich, S.; Millam, J. M.; Daniels, A. D.; Kudin, K. N.; Strain, M. C.; Farkas, O.; Tomasi, J.; Barone, V.; Cossi, M.; Cammi, R.; Mennucci, B.; Pomelli, C.; Adamo, C.; Clifford, S.; Ochterski, J.; Petersson, G. A.;
Ayala, P. Y.; Cui, Q.; Morokuma, K.; Malick, D. K.; Rabuck, A. D.; Raghavachari, K.; Foresman, J. B.; Cioslowski, J.; Ortiz, J. V.; Baboul, A. G.; Stefanov, B. B.; Liu, G.; Liashenko, A.; Piskorz, P.; Komaromi, I.; Gomperts, R.; Martin, R. L.; Fox, D. J.; Keith, T.; Al-Laham, M. A.; Peng, C. Y.; Nanayakkara, A.; Gonzalez, C.; Challacombe, M.; Gill, P. M. W.; Johnson, B.; Chen, W.; Wong, M. W.; Andres, J. L.; Gonzalez, C.; Head-Gordon, M.; Replogle, E. S.; and Pople, J. A. Gaussian, Inc., Pittsburgh PA, 1998.
37. Holthausen, M. C.; Heineman, C.; Cornehl, H. H.; Koch, W.; Schwarz, H. J.Chem.
Phys. 1995, 102, 4931.
38. Adamo, C.; Lelj. F. J.Chem. Phys. 1995, 103, 10605.
39. Blomberg, M. R. A.; Siegbahn, P. E. M.; Svensson, M. J.Chem. Phys. 1996, 104, 9546.
40. Rodríguez-Santiago, L.; Sodupe, M.; Branchadell, V. J. Chem. Phys. 1996, 105, 9966. 41. Bauschlicher, C. W.; Ricca, A.; Partridge, H.; Langhoff, S. R. in Recent Advances in
Density Functional Theory, Part II; D. P. Chong, Ed.; World Scientific Publishing
Company: Singapore 1997.
42. Baerends, E. J.; Branchadell, V.; Sodupe, M. Chem. Phys. Lett. 1997, 265, 481 and references therein.
43. Wachters, A. J. H.; J. Chem. Phys. 1970, 52, 1033. 44. Hay, P. J. J. Chem. Phys. 1977, 66, 4377.
45. Dunning, T. H. J. Chem. Phys. 1970, 53, 2823.
46. (a) Weinhold, F.; Carpenter, J. E. The structure of small molecules and ions; Plenum: New York, 1988. (b) Reed, A.E.; Curtiss, L.A.; Weinhold, F. Chem. Rev. 1988, 88, 899.
47. Taken from "NIST Chemistry WebBook, NIST Standard Reference Database Number 69, July 2001, Eds. P.J. Linstrom and W.G. Mallard" (http://webbook.nist.gov).
Figure captions
Figure 1. (a) FAB spectrum that results from the reaction of Ni+ and Cr+ sputtered from a foil of an alloy of chromium and nickel, with neutral urea, (b) MIKE spectrum of the [Ni-urea]+ complex at m/z 118.
Figure 2. Low-energy CID spectrum of the [Ni-urea]+ complex (m/z 118) generated under electrospray conditions.
Figure 3. Optimized geometries of the different coordination modes of Ni+ to urea at the B3LYP/Basis1 level. Distances are in Angströms.
Figure 4. Optimized geometries of the stationary points obtained for the non insertion mechanisms at the B3LYP/Basis1 level. Distances are in Angströms.
Figure 5. Schematic representation of the potential energy surface associated with the non insertion mechanisms. Relative energies at the B3LYP/Basis1(B3LYP/Basis2) level of theory (in kcal mol-1).
Figure 6. Optimized geometries of the stationary points obtained for the C-N insertion mechanisms at the B3LYP/Basis1 level. Distances are in Angströms.
Figure 7. Schematic representation of the potential energy surface associated with the C-N insertion mechanisms. Relative energies at the B3LYP/Basis1(B3LYP/Basis2) level of theory (in kcal mol-1).
Figure 8. Optimized geometries of the stationary points obtained for the loss of H2O mechanism at the B3LYP/Basis1 level. Distances are in Angströms.
Figure 9. Schematic representation of the potential energy surface associated with the loss of H2O mechanism. Relative energies at the B3LYP/Basis1(B3LYP/Basis2) level of theory (in kcal mol-1).
Figure 10. Schematic representation of the potential energy surface associated with the first steps of the C-N insertion mechanisms of the [Cu-urea]+ complex. Relative energies at the B3LYP/Basis1(B3LYP/Basis2) level of theory (in kcal mol-1).
Figure 1a Figure 1b Cr+ Ni+ [Cr,urea]+ [Ni,urea]+ [Ni,NH3]+ Ni+ -HNCO -CO -NH3
Figure 2
40
50
60
70
80
90
100
110
120
m/z, amu
0%
10%
20%
30%
40%
50%
60%
70%
80%
90%
100%
Re
l.
I
nt
.
(%)
118
58
100
75
90
101
Ni+ -CO -HNCO -NH3 -H2OFigure 3 1.864 1.271 1.351 1.347 119.2 118.4 Ni1 Ni2 1.243 2.031 2.080 1.467 125.61.332 120.4 2.073 2.073 1.196 1.451 1.451 125.6 107.4 Ni3 Ni N N O C Ni C O N N Ni C N N O
Figure 4 Ni4 1.286 1.873 1.268 1.546 110.9 133.0 Ni5 1.652 1.204 1.317 1.909 124.2 134.7 112.4 3.117 NiTS(1-4) 1.878 1.260 1.496 1.306 1.351 1.299 139.5 138.8 NiTS(2-5) 1.191 1.519 1.424 1.951 1.302 134.7 1.359 1.928 1.258 1.429 C 1.335 128.5 NiTS(1-2) Ni C O N N Ni C O N N Ni C O N N Ni C O N N Ni O N N Ni C N N O NiTS(4-5) 2.122 2.147 1.311 1.242 1.575 133.5
Figura 5 urea + Ni+ -66.4(-66.3) -14.0(-11.4) -35.9(-34.6) NH3 + Ni+OCNH -17.6(-20.9) -43.7(-43.0) NH3 + Ni + N(H)CO -22.5(-25.9) -64.1(-62.9) -4.8(-1.7) -51.4(-56.5) NiTS(1-4) NiTS(1-2) Ni1 Ni2 NiTS(2-5) Ni5 -21.6(-20.6) NiTS(4-5)
I
II
Ni4Figure 6 1.910 1.238 1.828 1.765 1.307 120.4 124.0 128.0 135.9 Ni6 Ni7 1.174 1.447 1.810 1.943 1.774 147.6 140.1 45.2 113.5 Ni9 1.950 1.912 1.193 1.189 141.7 172.7 176.8 179.7 106.2 Ni10 1.937 1.960 1.255 1.156 178.7 120.0 112.5 176.3 1.843 2.078 O Ni8 NiTS(7-8) 1.149 1.773 1.826 1.793 63.3 1.229 1.893 1.828 1.317 2.308 2.060 133.7 N NiTS(2-6) O N 1.896 1.978 1.201 1.285 1.567 1.134 2.340 156.0 NiTS(6-9) 1.190 1.917 1.360 99.4 1.759 NiTS(6-7) 1.961 2.546 165.8 1.216 1.189 NiTS(9-10) 2.385 Ni C O N N Ni C O N N Ni C O N N Ni C N N Ni N N C Ni N N C C O Ni N Ni C N Ni C O N N N N O C Ni O O 1.984 1.139 1.472
Figure 7 Ni+N2H4 + CO -24.1(-22.2) -8.1(-7.8) -48.4(-47.5) -13.0(-12.1) urea + Ni+ -36.6(-35.4) -66.4(-66.3) -15.4(-14.7) -73.8(-74.6) -12.3(-11.4) Ni+NH3 + OCNH -41.8(-44.5) NH3 + Ni+N(H)CO -22.5(-25.9) -13.5(-12.3) -51.7(-57.9) Ni1 NiTS(2-6) Ni6 NiTS(6-9) NiTS(6-7) Ni7 NiTS(9-10) NiTS(7-8) Ni9 Ni10 Ni8 -79.6(-80.8) NH3 + Ni+OCNH -17.6(-20.9) -64.1(-62.9) -51.4(-56.5) NiTS(1-2) Ni2
III
IV
Ni+CO + N2H4 16.5(15.2)Figure 8 Ni11 NiTS(1-11) Ni12 NiTS(12-14) NiTS(12-13) Ni14 NiTS(11-14) NiTS(11-12) Ni13 Ni O C N N Ni O C N N Ni O C N N Ni O C N N Ni O C N N Ni O C N N Ni O C N N Ni O C N N Ni15 1.860 1.171 1.303 1.043 1.703 Ni O C N N Ni O C N N NiTS(13-15) 1.876 1.256 1.342 1.525 1.160 1.498 2.098 2.029 1.380 1.469 1.251 103.9 2.958 1.908 1.309 1.352 1.340 125.9 1.896 1.312 1.335 1.350 123.9 1.923 1.909 1.267 1.197 1.406 1.210 1.378 1.294 1.342 161.8 1.908 Ni O C N N 1.964 1.449 1.362 1.263 136.1 1.153 1.471 1.487 1.243 1.411 1.934 144.9 1.855 1.348 1.327 1.332 120.9 1.905 1.312 1.502 1.292 1.469 1.143 144.6
urea + Ni+ -66.4(-66.3) -10.9(-9.5) -39.0(-37.4) H2O + Ni+NCNH2 -30.8(-30.6) -56.7(-58.5) H2O + Ni+N(H)CNH -16.3(-20.0) Ni1 15.4(17.9) -25.9(-25.4) -57.6(-57.6) 5.6(7.4) -38.5(-38.2) -55.2(-55.1) -46.2(-46.7) 9.2(10.9) Ni11 Ni12 Ni13 Ni14 Ni15 NiTS(1-11) NiTS(11-12) NiTS(11-14) NiTS(12-13) NiTS(12-14) NiTS(13-15) N(H)CNH + Ni+H2O -6.3(-9.5)
Figure 10 urea + Cu+ -12.8(-12.3) -63.5(-63.4) 1.0(0.6) Cu1 CuTS(2-6) Cu6 -55.4(-54.4) -55.3(-54.3) CuTS(1-2) Cu2 1.859 1.271 1.350 2.037 2.295 1.249 1.335 1.443 2.108 2.163 1.240 1.466 1.336 1.199 2.022 1.812 1.325 2.495 1.892 1.974 1.230 1.306 1.764
![Figure 1a Figure 1b Cr + Ni + [Cr,urea] + [Ni,urea] +[Ni,NH3]+Ni+-HNCO -CO -NH 3](https://thumb-eu.123doks.com/thumbv2/123doknet/13255160.396338/26.892.112.744.90.837/figure-figure-cr-cr-urea-urea-nh-hnco.webp)