HAL Id: hal-02876974
https://hal-pjse.archives-ouvertes.fr/hal-02876974
Preprint submitted on 21 Jun 2020
HAL is a multi-disciplinary open access archive for the deposit and dissemination of sci-entific research documents, whether they are pub-lished or not. The documents may come from teaching and research institutions in France or abroad, or from public or private research centers.
L’archive ouverte pluridisciplinaire HAL, est destinée au dépôt et à la diffusion de documents scientifiques de niveau recherche, publiés ou non, émanant des établissements d’enseignement et de recherche français ou étrangers, des laboratoires publics ou privés.
Estimating the Distribution of Household Wealth in
South Africa
Aroop Chatterjee, Léo Czajka, Amory Gethin
To cite this version:
Aroop Chatterjee, Léo Czajka, Amory Gethin. Estimating the Distribution of Household Wealth in South Africa. 2020. �hal-02876974�
World Inequality Lab Working papers n°2020/06
"Estimating the Distribution of Household Wealth in South Africa"
Aroop Chatterjee, Léo Czajka, Amory Gethin
Keywords : Distribution; Wealth; South Africa; inequality; welfare state
Estimating the Distribution of Household
Wealth in South Africa
∗Aroop Chatterjee
Léo Czajka
Amory Gethin
April 2020
Abstract
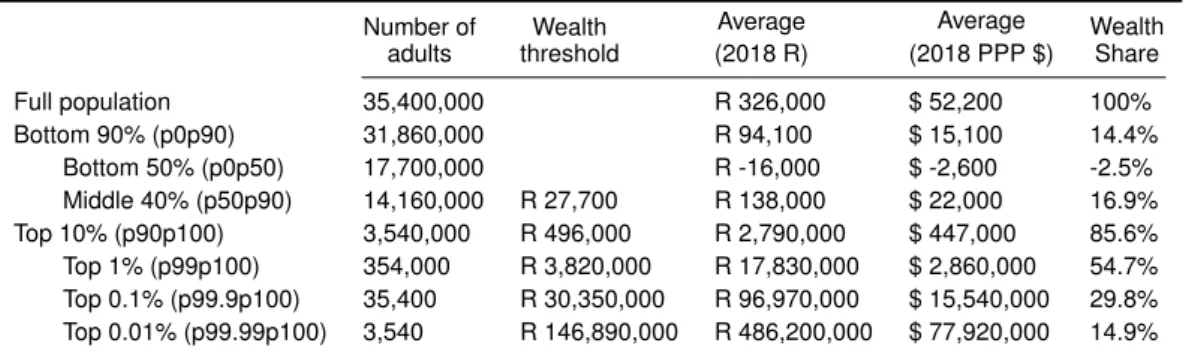
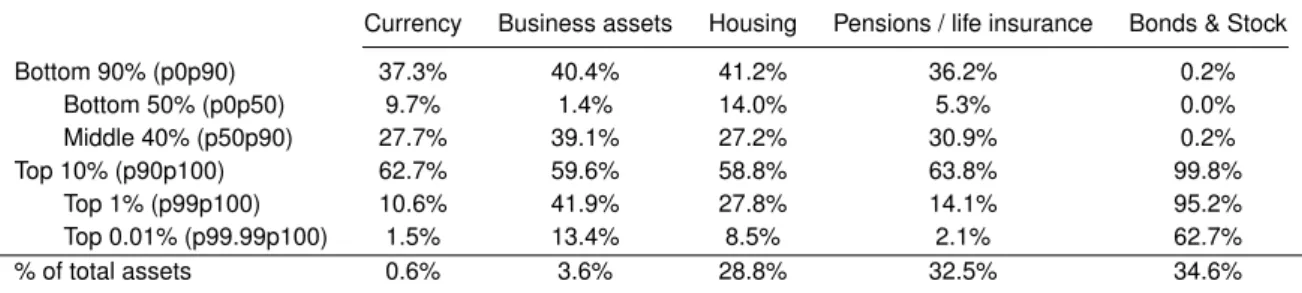
This paper estimates the distribution of personal wealth in South Africa by com-bining tax microdata covering the universe of income tax returns, household surveys and macroeconomic balance sheets statistics. We systematically compare estimates of the wealth distribution obtained by direct measurement of net worth, rescaling of reported wealth to balance sheets totals, and capitalisation of income flows. We document major inconsistencies between available data sources, in particular re-garding the measurement of dividends, corporate assets and wealth held through trusts. Both household surveys and tax data remain insufficient to properly capture capital incomes. Notwithstanding a significant degree of uncertainty, our findings reveal unparalleled levels of wealth concentration. The top 10 per cent own 86 per cent of aggregate wealth and the top 0.1 per cent close to one third. The top 0.01 per cent of the distribution (3,500 individuals) concentrate 15 per cent of household net worth, more than the bottom 90 per cent as a whole. Such high levels of inequality can be accounted for in all forms of assets at the top end, including housing, pen-sion funds and other financial assets. Our series show no sign of decreasing wealth inequality since apartheid: if anything, we find that inequality has remained broadly stable and has even slightly increased within top wealth groups.
∗Aroop Chatterjee, Southern Centre for Inequality Studies - University of Witwatersrand; Léo Czajka, Université
Catholique de Louvain; Amory Gethin, World Inequality Lab – Paris School of Economics. We thank the SA-TIED Data-lab team, as well as Facundo Alvaredo, Thomas Blanchet, Keith Breckenridge, Josh Budlender, Aalia Cassim, Lucas Chancel, Allan Davids, Andrew Kerr, Murray Leibbrandt, Thomas Piketty, Michael Sachs, Imraan Valodia and Eddie Webster for helpful insights. We also thank seminar participants from the Southern Centre for Inequality Studies, WiSER, School of Economics and Finance at the University of Witwatersrand, and SALDRU at the University of Cape Town. We acknowledge financial support from UNU-WIDER SA-TIED project, the Ford Foundation, the Sloan Foundation, the United Nations Development Programme and the European Research Council (ERC Grant 340831). This study is reproduced here with acknowledgement of the copyright holder UNU-WIDER, Helsinki. The study was originally commissioned under the UNU-WIDER project, Southern Africa - Towards Inclusive Economic Development (SA-TIED).
1 Introduction
South Africa is by most contemporary measures the most unequal country in the world. This is a clear legacy of colonialism and apartheid, where minority rule was premised on racially motivated exclusion of the majority from ownership and participation in the economy. However, despite having a progressive constitution and policy mandate, post-apartheid democratic society seems to have reproduced inequality along the same lines. To study this evolution, most analyses of inequality have focused on inequality of incomes and opportunities, but relatively little attention has been given to wealth inequality. However the available evidence suggests that wealth is significantly more unequally distributed than income and thus may greatly contribute to maintain or exacerbate the discrepancies in standards of living and access to economic opportunities. Studying wealth inequalities is therefore crucial to accurately measure its concentration over time, identify the root causes of the current persistence of extremely high levels of inequality in South Africa, to eventually understand how to best overcome it. In this respect this study comes at timely moment given the current policy debate about the different reforms needed to address wealth inequality, such as wealth tax (Davis Tax Committee 2018) or expropriation without compensation.1
This paper estimates the wealth distribution in South Africa from 1993 to 2018, and advances the lit-erature in several ways. First, we systematically contrast all existing data sources in South Africa that can inform estimations on wealth, including macro-economic data, all relevant household surveys, and newly available tax microdata from 2010 to 2017. This inspection demonstrates the crucial lack of fully comprehensive and reliable data available to directly measure the distribution of wealth in South Africa. We further show that some key income components, which could be used to indirectly estimate wealth concentration, are also insufficiently captured, even by the most recent and accurate tax microdata avail-able. This is particularly salient for capital incomes such as rental income, interests and dividends - which almost exclusively benefit the very highest income earners. Secondly, we contribute to the methodological literature on wealth measurement (e.g. Saez and Zucman 2016; Roine and Waldenström 2010) by systematically comparing alternative methods of estimating the wealth distribution when only incomplete data is available, namely: partial direct measurement, rescaling and income capitalisation. Specifically, this paper is the first to systematically apply the income capitalisation method to estimate the distribution of wealth in South Africa. This method allows to measure wealth inequality in spite of the absence of reliable microdata directly measuring wealth, by estimating wealth stocks from the income flows they generate. Thirdly, we improve on existing studies by using a combination of the above-mentioned methods, merging tax microdata with surveys to account for the fact that higher in-comes are better captured by fiscal data, and harmonising the resulting distribution with the National Accounts to ensure aggregates are consistent with macro totals. This paper thus contributes to the Dis-tributional National Accounts (Alvaredo et al. 2016) agenda by creating new ways to bridge the gap between macro and micro data to retrieve consistent distributional estimates. Finally, assuming that under-representation of top wealth groups in surveys has remained constant before 2011, we are able to use the income capitalisation method to reconstruct a time series since 1994.
The rest of the paper unfolds as follow: section 2 reviews the literature on wealth in South Africa, section 3 discusses the available sources on aggregate wealth, section 4 discusses the available microdata sources on the distribution of wealth, section 5 discusses the different methods, section 6 presents the results, and concludes by comparing our favorite estimates with that of other countries.
2 Measuring the wealth distribution: South Africa in an international perspective
Although the estimation of wealth inequality has a long history (e.g. Mallet 1908; Clay 1925; Langley 1950; Daniels and Campion 1936; Atkinson and Harrison 1974), recent improvements in available data and methodological approaches has led to a resurgence in studies on the distribution of wealth. Accord-ingly, a new body of literature has studied long terms trends in wealth inequality (Piketty 2011), the importance of tax havens (Zucman 2014), the use of different techniques to estimate wealth concentra-tion and the importance of combining available data sources in conducting this research (e.g. Garbinti, Goupille-Lebret, and Piketty 2018; Saez and Zucman 2016).
To understand how we can estimate a wealth distribution in South Africa, we briefly review the main studies and techniques, and locate key papers on the South African case within this. We group the literature according to the essential components of such a studies: aggregate household wealth, survey sources of information about the distribution, and administrative data sources of information about the distribution.
2.1 Literature on aggregate household wealth
Recent studies internationally have relied on official household sector balance sheet statistics (referred to as the household balance sheet). These form part of a system of national accounts that capture all economic activity, in the form of both stocks and flows, and which therefore provides internally con-sistent and internationally comparable estimates of aggregate household wealth. The development of national account statistics to include stocks and wealth concepts is relatively recent. For example, the US household balance sheet was systematically developed in the late 1980s (Wolff 1989), in Germany, the first official balance sheets were released in 2010 (Piketty and Zucman 2014). The System of Na-tional Accounts, an internaNa-tional standard for naNa-tional accounting, first included guidelines for wealth only in 1993. The standards that inform present statistics come from 2008 (United Nations 2009).
In this context, South Africa has firmly been part of this international trend, with the first household balance sheet estimated in 1999 (Muellbauer and Aron 1999). Since then it has been continuously consolidated and now forms part of the official quarterly statistical release of the National Accounts of the South African Reserve Bank (e.g. South African Reserve Bank 2015). The household balance sheet has been estimated backward until 1970 which interestingly allows for long-run analyses.
The household balance sheets show that net household wealth, as a percentage of households disposable income, fell from an average of 315 percent in 1980-1998 to 283 percent for the 1999-2003 period, but rose again above 300 percent in 2005. The decomposition reveals a declining significance of liquid assets and the rise of share-holding, pension assets and debt, in line with South Africa’s liberalisation policies (Aron, Muellbauer, and Prinsloo 2006, 2007). Muellbauer and Aron (1999) estimate that from the early 1980s to 1997, the value of housing wealth declined, with pension wealth overtaking it as a proportion of personal disposable income in the early 1990s. Liquid assets, such as bank and building society deposits, declined from the early 1980s, while personal debt rose. After this period, pension wealth was a significant contributor to the recovery in household wealth, while housing wealth recovered due to valuation increases in the private property market and equity prices (Kuhn 2010). These trends continued until the global financial crisis affected property wealth and household debt in 2011 (Walters 2011).2
2The aggregate balance sheet also provides useful sources of data for decomposition analysis, as per Piketty and Zucman
(2014). See Orthofer (2015) for a study on the proportion of South African household wealth changes in South Africa from 1970 to 2014 that are a result of quantity (saving-induced) versus price (revaluation-induced) effects.
2.2 Distribution of wealth using complete micro administrative data
Some researchers have been able to take advantage of national wealth databases, which consist of com-plete records of assets and liabilities. For example, Boserup, Kopczuk, and Kreiner (2016) use admin-istrative tax records from the Danish Tax Agency (SKAT), which collects, in addition to information of various income sources, information about the values of asset holdings and liabilities measured at the last day of the year for all Danes. Wealth and debt components, such as all deposits, stocks, bonds, value of property, and deposited mortgages, as well as all types of debt, are third-party reported and linked to the individual ID numbers. There are also records that allow matching the identification numbers of parents and children to study the intergenerational transmission of wealth.
The data is unfortunately not currently organised like this in South Africa. However, it is important to note that all the components to do so are in place. Third party reporting is already done by all financial institutions to the South African Revenue Service (SARS), but the data has not been made available. Organising this data to link with individual income tax records would not only benefit researchers, but also SARS, as such a dataset can be used to cross check the consistency of the reported income level with the change in net wealth during the year under the assumption of a given estimated consumption level. Incidentally these types of records have proved extremely successful in helping tax enforcement (Kleven, Knudsen, Kreiner, Pedersen, and Saez 2011). The identification numbers linking individuals to their parents are administratively required by South African Home Affairs. Combining this information with administrative data about wealth would allow researchers to study intergenerational dynamics in wealth transmission.
2.3 Distribution of wealth according to survey data
Data on aggregate wealth informs trends in levels and composition of wealth at the national level, but does not allow us to specify how wealth is distributed over the population. In the absence of disaggre-gated administrative data, studies on wealth distribution typically rely on survey instruments such as the Survey of Consumer Finances (SCF) for the US - which provides regular information on assets and debts since the 1960s - or the Household Finance and Consumption Survey (HFCS) which collects data on the assets and liabilities of households in 18 European countries since 2010.
The National Income Dynamics Survey (NIDS), a household panel survey conducted in South Africa, has collected information on the assets and liabilities of South African residents at the household and individual levels in three waves since 2008. Comparing wealth aggregates from the SARB with the one they estimated from the NIDS, Daniels and Augustine (2016) observe that the NIDS survey only captures approximately 3 per cent of the financial assets recorded in the national accounts. Lower levels of financial assets in the NIDS suggest that the survey failed to capture the top end of the wealth distribution. Non-financial assets from the NIDS are around four times higher than the national accounts due to the inclusion of durable assets, not usually included in measures of aggregate net wealth. Mbewe and Woolard (2016) explore two waves of this data, 2010-2011 (wave 2) and 2014-2015 (wave 4) to build measures of household net worth. They estimate that the share of the top 10 per cent accounts for 87 per cent of total net assets in wave 2, and 85 per cent in wave 4 (excluding durable assets). Furthermore, the bottom decile has negative wealth, while the next seven deciles together hold 4 and 7.6 per cent of net wealth in waves 2 and 4 respectively. Exploiting NIDS’ demographic dimensions, they also reveal that approximately 60 per cent of the top decile are White individuals.3 Within-race inequality is very pronounced as well. The Gini index for wealth among the White group is equal to 0.74, compared to 0.98 among the Black group (wave 2).
There is potentially another source of survey data measuring wealth, but this has not been considered for this paper due to the proprietary nature of the data. Van Tonder, Van Aardt, and De Clercq build a set of distributional balance sheets using private sector survey data, the Momentum/Unisa Household Financial Wellness Index surveys conducted between 2011-2015, which cover 12,500 households. They merge these surveys with data from the Bureau of Market Research (BMR) Household Income and Expenditure Database to derive 2016 distributional balance sheet statistics. A slightly different point of reference, they find that the top income decile holds about 51 per cent of household net wealth. This viewpoint however only limits the wealth held to those in the labour market, and so underestimates wealth and its distribution at the top end. The survey records aggregate household net wealth at R 7,344 billion in the fourth quarter of 2017, compared to the National Accounts which estimate it at R 10,835 billion in 2017. However, the methodology used to derive these figures remains very opaque, which makes it hard to understand sources of differences with NIDS and SARB data. Making this survey and data publicly available in an appropriate form to researchers would be key to contrasting it to other data sources and to improving our understanding of the wealth distribution in South Africa.
In any case, studies relying on survey data are limited when estimating the top shares due to under-sampling, non-response and under-reporting issues which are particularly pronounced at the top end of the distribution. Given the extreme levels of wealth concentration in South Africa, this implies that estimates based on surveys can only depict a truncated picture of the reality. In this regard, administra-tive sources are generally more exhausadministra-tive and usefully complement estimates relying on survey data alone.
2.4 Distribution of wealth using estate duty and personal income tax data
Estate duty data has been commonly used to estimate wealth distributions. Mallet (1908) used estate duty data as early as 1908, and this method has since been developed to estimate a historical series even with minimal but useful summary data, as in, for example, Atkinson and Harrison (1974) and Piketty, Postel-Vinay, and Rosenthal (2006). Indeed, one of the earliest studies to look at the distribution of wealth in South Africa used estate duty returns in the Natal province in 1974/75 (McGrath 1982). The data was obtained from Master of Supreme Court (rather than from the tax authority, which had no demographic information attached to the estate duty records). Adjusting the provincial data to make it nationally representative, and using a mortality multiplier, the assets of the deceased were used to estimate the assets of the living. McGrath estimated that the top 5 per cent of the population owned 88 per cent of total household wealth. Assuming that 94 per cent of all wealth was held by the white population at that time (as per the information in the estate duty records), the demographic breakdown also provides some interesting statistics. Among the White population, the top 10 per cent held 65 per cent of wealth, while among the Coloured and Asian groups, it held 96 and 94 per cent of wealth respectively. The advantage of this approach is that estates of the deceased are directly measured. Unfortunately, even though there is an estate duty collected regularly in South Africa today, we have not been able to access data on estate duty records. Access to such data would be crucial to improve our understanding of the wealth distribution and its intergenerational dynamics.
Another set of data useful to estimate the top shares of the wealth distribution is personal income tax data. This provides indirect information on wealth through declarations of income derived from capital ownership. These incomes can then be capitalised to estimate their asset bases (see Saez and Zucman (2016) and Garbinti, Goupille-Lebret, and Piketty (2017) for recent studies in the case of the US and France respectively). In South Africa, Orthofer (2016) has used reported incomes from administrative personal income tax data (PIT) to approximate the wealth distribution, comparing this to the distribution of wealth measured in the NIDS. Given that this study takes an approach which is closest to ours, let us briefly discuss it in more detail. For her estimates using PIT data, which does not cover the lower end of the distribution because of filing rules, Orthofer fits a lognormal distribution below the filing threshold to simulate a bottom end. She then uses the sum of investment incomes (interest, dividends and rental
income) and pension contributions as a proxy for wealth. For her estimates using NIDS data, she takes the sum of assets and liabilities reported in the survey; she also re-samples the top of the distribution from a Pareto distribution to account for the underrepresentation of top income and wealth groups in the survey. In both cases, she estimates that the top 10 per cent share lies between 90 per cent and 95 per cent, and the top 1 per cent share between 50 per cent and 60 per cent.
This study has made an important contribution in being the first to use both surveys and income tax data to measure wealth inequality in South Africa. However, it suffers from at least three major limitations that we seek to address in this paper. Firstly, her PIT estimates only cover specific components of wealth, those who correspond to investment income (i.e. financial assets) and pension contributions (i.e. pension assets). They exclude owner-occupied housing wealth altogether, which we find to amount to as much as 28 per cent of household wealth in 2018 (see section 3). Secondly, her results based on PIT data do not account for the fact that the composition of income is not the same as the composition of wealth. Because assets have different rates of return (for example, bonds tend to have lower rates or return than corporate shares), the income capitalisation method requires applying differential multipliers by asset class. As a result, Orthofer’s estimates using PIT data better correspond to the distribution of financial incomes than to the distribution of wealth. The difference between these two distributions is now well-known in the literature: in the case of the United States, for instance, Saez and Zucman (2016) show that wealth is typically less concentrated than capital income.
When it comes to estimates using the NIDS, we believe that the extraordinarily high levels of wealth concentration found by Orthofer are in large part due to the mismeasurement of pension assets. Accord-ing to her results, the top 1% owns as much as 99% of pension assets in the economy (see table 5, p. 18). This seems unrealistically high, given that more than 10% of the South African adult population contribute to pension funds, and at least 6% of the South African adult population received private pen-sion income from a penpen-sion fund in 2017.4 Looking closer at the NIDS, we find this inconsistency to be due to massive under-reporting in the survey data: indeed, a large share of pensioners and wage earners with positive pension contributions declare having no pension asset, which is by definition impossible. We correct for this discrepancy by imputing pension assets to individuals contributing to pension funds or receiving private pension income, using predictive mean matching. This increases the share of in-dividuals with positive pension assets in the survey data from 6% to 16% of the adult population. It also improves considerably the coverage of aggregate pension assets in the survey, which increases from about a third of the macro total reported by the SARB to close to 100%.
This paper builds upon this existing literature by combining surveys and tax data, but with significant differences. Firstly, we systematically contrast all data sources that can inform estimations on wealth inequality (including all household surveys useful for this purpose, as well as tax data). Secondly, we directly combine surveys and tax data at the individual level, rather than resampling individuals from these two types of datasets. This requires us to thoroughly harmonise income concepts, but it allows us to study the entire distribution with a greater level of precision. Thirdly, we also capitalise incomes from surveys alone, and compare our results to those obtained when combining surveys and tax data. To the best of our knowledge, our study is the first to apply the income capitalisation directly to survey data, with no correction for the under-representation of top income groups, and to assess the consequences of this under-representation on the measurement of top wealth inequality. Quite surprisingly, we find in our case that both approaches yield very similar results. We interpret this as evidence that while surveys do understate the concentration of incomes at the top end, they still allow us to capture the core structure of wealth concentration as long as assets and liabilities are properly rescaled to match macroeconomic totals.
4Authors’ computations using data from income surveys (pension contributions) and data from the matched IRP5-ITR12
Fourthly, we systematically match specific wealth components with the corresponding balance sheets totals. Our wealth distribution is therefore fully consistent with official macroeconomic figures published by the South African Reserve Bank. Correcting for such micro-macro discrepancies is in our view crucial to both better measuring the distribution of wealth and improving the international comparability of existing studies. To be sure, the estimates of aggregate wealth published by statistical institutes are far from being perfect, and they are also likely to suffer from measurement error. Yet, the framework outlined by the United Nations’ System of National Accounts does represent the best attempt to provide internally consistent, comparable and measurable definitions of household wealth. Ignoring the fact that surveys massively understate major components of wealth seems in our opinion a much stronger assumption than attempting, even in an imperfect way, to address existing measurement errors. We know with a relatively high degree of confidence, for instance, that the NIDS survey does not cover more than 4% of bonds and stock held in the economy. Estimates which do not attempt to account for this problem effectively leave out more than 30% of household wealth held in South Africa. To our knowledge, our study is the first one in South Africa to correct for these micro-macro gaps.
Fifthly, the tax microdata we use covers the entire universe of taxpayers. This allows us to go beyond the top 10 per cent or the top 1 per cent and to derive estimates of average wealth covering the very top end of the distribution. As we show in section 5, understanding wealth inequality within top wealth groups is absolutely crucial for the study of wealth inequality in South Africa, both in terms of measurement and policy, as the top 0.1 per cent alone owns a substantial share of household wealth. Finally, our methodology allows to estimate a time series, rather than a point estimate, that gives us a sense of longer term trends since 1993.
3 Data sources on aggregate wealth
This section discusses the data sources available to measure total household wealth and its composition in South Africa. We then turn to a systematic comparison of micro and macro data sources in the next section.
3.1 The household balance sheets
In South Africa, the first comprehensive attempt to estimate the value of total household wealth in the economy goes back to Muellbauer and Aron (1999), who collect and combine a number of data sources to provide figures on the market value of the assets and the liabilities of the household sector since 1975. The South African Reserve Bank (SARB) has since then updated and revised these figures on a yearly basis.
Non-financial assets are divided into residential buildings and other non-financial assets. Residential buildings correspond to the market value of residential properties owned by households. Other non-financial assets include both land underlying dwellings and business assets.
Financial assets are divided into interest in pension funds and long-term insurers, assets with monetary institutions, and other financial assets. Interest in pension funds and long-term insurers corresponds to all pension assets holdings of the household sector. It is the sum of the total assets of official pension and provident funds (series KBP2215 in Capital Markets Statistics), the total liabilities of private self-administered pension and provident funds (KBP2339), and the liabilities of long-term insurers under unmatured policies from the pension business (KBP2215).5 Assets with monetary institutions include
5The original estimates of the South African household balance sheets done by Muellbauer and Aron (1999) excluded life
insurance assets and all other assets associated with the non-pension business of long-term insurers. However, these items are now included by the SARB in line with the SNA guidelines.
Figure 1: The evolution of household wealth in South Africa, 1975-2018 -50 0 50 100 150 200 250 300 350 % of national income 19741976197819801982198419861988199019921994199619982000200220042006200820102012201420162018
Residential buildings Other non-financial assets
Other financial assets Assets with monetaryinstitutions Interest in pension funds
and long-term insurers Mortgage debt
Other debt
Notes: This figure shows the level and composition of household wealth in South Africa between 1975 and 2018, expressed as a share of the net national income.
Source: authors’ compilation based on data from the South African Reserve Bank.
all forms of currency and deposits with banks, mutual banks, the Land and Agricultural Bank, and the Post Bank, as well as notes and coins held by households. This category therefore includes both deposits generating interest income (savings accounts) and other liquid assets which have no corresponding mea-surable income flow (such as cheque accounts, notes or coins). Other financial assets include investment in government and public entities stock, collective investment schemes, corporate bonds and equities, other long-term deposits and households’ investment in foreign assets.
Finally, the SARB decomposes household debt into mortgage advances, corresponding to loans provided by the commercial bank sector, and other debt, which includes trade credit, personal bank loans, credit card debt, instalment sales and lease agreements, non-bank loans granted by micro-lenders, and other loans.
Figure 1 plots the evolution and composition of total household wealth between 1975 and 2018, ex-pressed as a share of national income. Aggregate net wealth has followed a U-shaped curve, declining from about 300 per cent of national income in 1975 to 220 per cent at the end of the 1990s, and rising back to more than 260 per cent at the beginning of the twenty-first century. In 2018, financial assets amounted to two years of national income. Within financial assets, pension assets have risen signifi-cantly and are now the biggest component of household wealth. Non-financial assets amounted to one year of national income in 2018, declining in importance over the years from just under two years of national income in 1974. Household debt rose significantly between 1975 and 2008, in large part due to a boom in mortgage advances in the early 2000s (see Figure A4), and has slightly declined since then, amounting to about 55 per cent of the national income today.
3.2 The limitations of available balance sheets: from institutions to asset classes
As discussed in section 2, we aim to estimate the distribution of household wealth by combining infor-mation on capital income flows with directly measured stock data, not previously done for South Africa. There are at least five limitations to available balance sheets statistics which we discuss below: the decomposition of non-financial assets, the decomposition of housing wealth into tenant-occupied and owner-occupied, the decomposition of financial assets, the decomposition of pension and life insurance assets, and the inclusion of wealth held offshore in tax havens.
Land underlying dwellings
The first issue is that the other non-financial assets category provided by the SARB includes both land underlying dwellings and business assets. These two components are arguably distributed very differ-ently. For our purpose, in particular, it is reasonable to assume that land underlying dwellings is dis-tributed similarly to residential buildings – therefore defining total housing assets are the sum of land and residential buildings. We assume that 70% of other non-financial assets corresponds to land underlying dwellings, the remaining 30% amounting to the assets held by unincorporated businesses.
Tenant- versus owner-occupied housing
The two important components of "Residential buildings" are tenant-occupied housing, and owner-occupied housing. Available studies combining surveys with tax microdata typically assume that the distribution of tenant-occupied housing can be well approximated by the distribution of rental income, while owner-occupied housing assets are better captured using direct measurement available from sur-veys or administrative data (Saez and Zucman 2016; Garbinti et al. 2017). Unfortunately, the "Resi-dential buildings" category published by the SARB does not provide this decomposition, so we choose to estimate the proportions from survey data. The General Household Survey is the only survey that systematically asks both tenants and owners to provide a value for the dwelling in which they live. Our results show that between 22 per cent and 26 per cent of household housing assets are owned by households renting to private individuals over the 2013-2018 period (see appendix for method).
Non-pension financial wealth
"Assets with monetary institutions" and "other financial assets" gather together very different forms of financial assets. "Assets with monetary institutions" include both non-interest bearing deposits such as cheque accounts, which do not generate any income flow, and interest bearing deposits which generate interest income. "Other financial assets" include both bonds and corporate shares, which generate in-terest and dividends respectively. We follow Orthofer (2015) and assume that the composition of other financial assets held by households is similar to that reported by unit trusts.6 This implies that between 80 per cent and 95 per cent of other financial assets consist in corporate shares over the 1975-2018 pe-riod, the remaining being classified as interest-bearing deposits.7 Finally, we separate currency, notes and coins from interest-bearing deposits by using published data from the Money and Banking Statistics
6As discussed by Orthofer (2015), “A breakdown by asset class can be estimated by applying the portfolio composition of
the respective counterparties (monetary institutions, pension funds and long-term insurers as well as unit trusts) to the total of household assets held with these institutions. In practice, we consider all assets with monetary institutions as cash equivalents and apply the portfolio composition of unit trusts to the other financial assets component."
7More precisely, we estimate the share of corporate shares in other financial assets by comparing the market value of ordinary
shares held by unit trusts (KBP 2412) to the sum of the market values of security holdings of public sector entities, stocks and debentures held by unit trusts (KBP 2410 + KBP 2411) in the capital market statistics published by the SARB.
Table 1: The level and composition of household wealth in South Africa in 2018
Market value (R billion) % of national income % of net wealth
Non-financial assets 4504 111.4 % 42.4 % Owner-occupied housing 3020 74.7 % 28.4 % Tenant-occupied housing 988 24.4 % 9.3 % Business assets 497 12.3 % 4.7 % Financial assets 8294 205.1 % 78.0 % Pension assets 2944 72.8 % 27.7 %
Life insurance assets 1412 34.9 % 13.3 %
Bonds and interest deposits 1798 44.5 % 16.9 %
Currency, notes and coins 87 2.2 % 0.8 %
Corporate shares 2053 50.8 % 19.3 %
Total liabilities 2170 53.7 % 20.4 %
Mortgage debt 1022 25.3 % 9.6 %
Non-mortgage debt 1148 28.4 % 10.8 %
Net household wealth 10629 262.9 % 100.0 %
Offshore wealth 575 14.2 % 5.4 %
Net wealth incl. offshore wealth 11204 277.1 % 105.4 % Notes: The table shows the level and composition of household wealth in South Africa in 2018. The market value of each component is expressed in current billion rands.
Source: Own estimates combining available data sources from the SARB.
of the SARB (series KBP1312).8 These amount to 0.8% of net wealth, which is relatively comparable to figures from other countries where balance sheets data are available: in the US, for instance, non-interest financial assets amount to about 1 per cent of personal wealth in recent years (Saez and Zucman 2016).
Pension assets and life insurance
Pension assets correspond to the assets accumulated by wage earners through contributions to pension funds throughout their career, so they should in large part be distributed to wage earners and pensioners receiving pension income or annuities. Life insurance assets, by contrast, corresponds more to a form of savings device, but they do not directly generate interest income, so they cannot be categorised with interest deposits or bonds and have to be distributed differently. As explained above, the share of interest in pension funds and long-term insurers corresponding to assets held by long-term insurers is recorded in the Capital Markets Statistics published by the SARB under series KBP2215, "liabilities of long-term insurers under unmatured policies from the pension business", so we can measure directly total life insurance assets held by households in the economy accordingly.
Offshore wealth
Offshore wealth corresponds to the assets held abroad by South African residents, mainly for tax avoid-ance purposes. By definition, these assets are not recorded in official records and are therefore not included in the household balance sheets. Alstadsæter, Johannesen, and Zucman (2018) combine a number of macroeconomic data sources to measure the total amount of financial assets held in offshore tax havens and distribute it to specific countries. They estimate that the equivalent of about 11.8 per cent of South African GDP was held offshore in 2007. We add this quantity to total household wealth in 2007 and extrapolate it to other years by assuming that it has remained a constant fraction of GDP. Given that offshore wealth is known to have grown globally, this is a relatively conservative assumption: if anything, wealth inequality could have increased more since 1993 than what our estimates suggest (see
8This variable, "Monetary sector liabilities: banknotes and coins in circulation", includes currency, notes and coins held by all
institutions, not only households. We assume that 70% of the total can be attributed to households.Given the small share of this component in total wealth, especially at the top of the wealth distribution, our results are not affected by alternative scenarios.
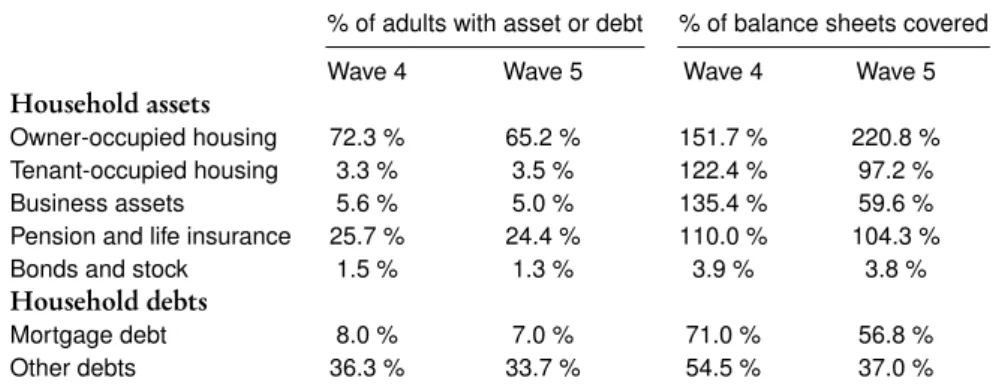
Table 2: Ownership rates and coverage of household balance sheets by asset class in NIDS % of adults with asset or debt % of balance sheets covered
Wave 4 Wave 5 Wave 4 Wave 5
Household assets
Owner-occupied housing 72.3 % 65.2 % 151.7 % 220.8 % Tenant-occupied housing 3.3 % 3.5 % 122.4 % 97.2 %
Business assets 5.6 % 5.0 % 135.4 % 59.6 %
Pension and life insurance 25.7 % 24.4 % 110.0 % 104.3 %
Bonds and stock 1.5 % 1.3 % 3.9 % 3.8 %
Household debts
Mortgage debt 8.0 % 7.0 % 71.0 % 56.8 %
Other debts 36.3 % 33.7 % 54.5 % 37.0 %
Notes: The table shows the share of South Africans who declare having a particular type of asset or debt, along with the share of the total value of this asset or debt in the economy captured by the NIDS survey.
Source: authors’ computations based on data. The unit of observation is the adult individual aged 20 or above. Calculations based on weighted sample using design weights.
section 5), as offshore wealth is well-known for been concentrated at the very top end of the distribution (Alstadsæter et al. 2018).
The level and composition of household wealth in 2018
Table 1 shows the detailed composition of household wealth in 2018 after breaking down the balance sheets categories. Pension assets and owner-occupied housing are the largest component of household assets and liabilities, each amounting to about 28 per cent of net wealth. The next most important categories are corporate shares (19 per cent), bonds and interest deposits (17 per cent) and life insurance assets (13 per cent). Business assets are equal to less than 5 per cent of net wealth. Tenant-occupied housing and currency and non-interest deposits represent 9 per cent and less than one per cent of net wealth respectively. Accounting for offshore wealth increases net household wealth by 5 per cent and brings the net personal wealth to national income ratio to more than 275 per cent.
4 Data sources on the distribution of household wealth
This section reviews the data sources available in South Africa that can be used to inform a distribu-tion funcdistribu-tion of household net assets, and ultimately be applied to the Nadistribu-tional Accounts’ aggregates, described above.
4.1 Household surveys
Surveys can provide information either that directly measure household assets, and/or have information about incomes and outflows. The National Income Dynamics Survey, mentioned in section 2, is the only publicly available survey that explicitly collects data on wealth. Out of the five waves of the survey, wave 2, 4 and 5 have wealth modules that can inform both households’ and, for wave 4 and 5, individuals’ net worth. For the purposes of this paper, we only consider the variables that allow us to build a net wealth concept consistent with the System of National Accounts guidelines (United Nations 2009) for comparability and consistency. The surveys have information on business wealth, housing properties and land, life insurance, pension and other retirement assets, equity wealth, debt and bonds. However, we faced several challenges to extract reliable wealth estimates from this source.
Firstly, we uncovered issues in coverage and reliability in each of the five components of wealth. Look-ing at housLook-ing first, approximately 40 per cent of debtors do not know the house bond value. With pension and other retirement funds, the information is quite inconsistent. For example, in wave 5 of the
Table 3: The coverage of selected national accounts components in South African surveys Gross wages Mixed income Rental income Interest and dividends
PSLSD, 1993 87.7 % 51.7 % 38.4 % 11.5 % IES, 1995 76.9 % 55.0 % 9.9 % 8.8 % IES, 2000 70.9 % 37.2 % 23.1 % 3.4 % IES, 2005 80.5 % 64.2 % 21.7 % 3.8 % IES, 2010 80.2 % 71.9 % 13.5 % 4.5 % LCS, 2008 77.7 % 75.8 % 16.3 % 8.4 % LCS, 2015 74.6 % 86.8 % 21.6 % 12.6 % NIDS, wave 1 62.7 % 12.0 % 65.4 % 7.3 % NIDS, wave 2 67.6 % 4.1 % 13.0 % 0.8 % NIDS, wave 3 65.7 % 20.6 % 20.7 % 7.3 % NIDS, wave 4 73.5 % 12.9 % 43.9 % 2.5 % NIDS, wave 5 72.1 % 14.1 % 41.0 % 5.5 %
Notes: The table shows the ratio of total income reported in surveys to the total corresponding income reported in the national accounts published by the SARB. PSLSD: Project for Statistics on Living Standards and Development. IES: Income and Expenditure Survey. LCS: Living Conditions Survey. NIDS: National Income Dynamics Study.
Source: authors’ computations based on data. The unit of observation is the adult individual aged 20 or above. Calculations based on weighted samples using weights calibrated by the authors’ (see appendix).
survey, 61 per cent of individuals declaring contributions to pensions funds declare having no "pension or retirement annuity", while 77 per cent of individuals declaring income from a pension or provident fund declare no "pension or retirement annuity". We correct for these gaps by imputing all missing values using predictive mean matching. For housing wealth, the market value of the house is modelled by number of rooms, number of adults, province and household income. Similarly, we impute missing business wealth for self-employed individuals, as well as pension funds and corporate shares based on factor income, contributions to pension funds and pension income.
The comparison of household assets and liabilities reported in NIDS to macroeconomic statistics show important inconsistencies (see table 2). The market value of owner-occupied housing wealth is between 50 per cent and 120 per cent higher in NIDS than in the balance sheets, while tenant-occupied housing is closer to the macro aggregate. This most likely reflects the different methods in measuring market values.9 Business assets are covered very differently in the two waves: they are overestimated in wave
4 and underestimated in wave 5. Pension and life insurance assets, after the correction, seem to be relatively close to balance sheets figures, and they even slightly overestimate them. Other financial assets are extremely badly covered: the total reported in NIDS does not exceed 4 per cent of households’ bonds and stock reported in the balance sheets by the SARB. Household debts are slightly better covered, but still fall significantly below macroeconomic statistics.
An alternate method to estimate wealth distribution consists of capitalising incomes (usually the method used for estimating the top end of the distribution from tax data). As more surveys deal with incomes, and generally income reporting is seen as more credible, this provides alternate sources of information for the wealth distribution. The method is discussed in more detail in section 5.1. In this section, we compare incomes from surveys to the corresponding totals recorded in the national accounts. For our
9It is beyond the scope of this paper to discuss and evaluate these methods. However, this issue is not one specific to South
Africa - in the US, survey values have also been found to be higher than in balance sheets figures, and which source of information provides the more accurate estimate of market values is contested (Blanchet 2016; Henriques and Hsu 2014; Dettling, Devlin-Foltz, Krimmel, Pack, and Thompson 2015). As a robustness check, we show in appendix figure A11 that our estimates of the wealth distribution are only marginally affected if one assumes that the balance sheets underestimate housing assets by a factor of two. Another potential issue is how to treat RDP housing, a government-funded social housing project in South Africa, due to compexities around owneship. However, given the typical low market value of these properties, it is unlikely to affect our distributional estimates.
Table 4: The coverage of owner-occupied housing, mortgage debt and other debt in South African surveys
Owner-occupied housing Mortgage debt Other debt
PSLSD, 1993 143.5 % 86.5 % 37.4 % IES, 1995 121.7 % 27.2 % 16.5 % IES, 2000 40.3 % 34.9 % IES, 2005 105.9 % 67.9 % 41.5 % IES, 2010 193.9 % 16.4 % 20.5 % LCS, 2008 145.4 % 13.9 % 18.4 % LCS, 2015 179.5 % 51.0 % 22.2 % NIDS, wave 4 122.3 % 74.3 % 57.4 % NIDS, wave 5 258.8 % 56.8 % 37.0 %
Notes: The table shows the ratio of total assets or debts reported in surveys to the corresponding totals reported in the household balance sheets. PSLSD: Project for Statistics on Living Standards and Development. IES: Income and Expenditure Survey. LCS: Living Conditions Survey. NIDS: National Income Dynamics Study.
Source: authors’ computations based on data. The unit of observation is the adult individual aged 20 or above. Calculations based on weighted samples using weights calibrated by the authors’ (see appendix).
purposes, the components we consider are gross wages (to capitalise pension wealth), mixed income (income from unincorporated enterprises, to capitalise non-financial assets), rental income (to capitalise tenant-occupied housing) and interest and dividends (for equity and bonds). The surveys we consider were designed to capture information about consumption, expenditure and earnings: these are the Project for Statistics on Living Standards and Development (PSLSD) conducted in 1993, the Income and Ex-penditure Surveys (IES) from 1995 to 2010, the Living Conditions Surveys (LCS) of 2008 and 2015, and the NIDS.10The labour force surveys which provide wage data only cover labour incomes, so would not be appropriate for this exercise.
As table 3 shows, rental income, interest and dividends are very poorly covered in household surveys. This is due to this sort of income being concentrated by those at the upper end of the income distribu-tion, who are typically underrepresented in surveys due to issues of sampling and non-response. This motivates our use of the tax microdata to better cover top incomes. Gross wages and mixed income are much better covered in the PSLSD, IES, and LCS than in NIDS. Owner-occupied housing seems to be over-stated relative to the balance sheets in these surveys as in NIDS, echoing the earlier discussion (see table 4). Debts are always below balance sheets totals, but with important fluctuations across surveys. All these limitations justify the need to correct for discrepancies between micro and macro totals. In-deed, the households balance sheets have the advantage of tracking the evolution of wealth consistently, in contrast with surveys which show much greater fluctuations in reported aggregates. By mapping the surveys with macroeconomic statistics, we are at least able to get estimates of the wealth distribution which are consistent with what we know of the level of aggregate wealth and its composition over time, which is what we do in the next section.
4.2 Tax data
The tax data, for purposes of this paper, refers to two data sources - the IRP5 data, and the ITR12 data. The IRP5 forms are income tax forms submitted to the South African Revenue Service (SARS) by employers on behalf of their employees, hence covers incomes related to the employment relationship. Specific variables of interest include gross wages as well as contributions to retirement assets (pension, annuities, etc). The ITR12 forms are self-assessment forms, that require taxpayers to disclose income
10There are concerns about whether these surveys are comparable: see for instance Berg and Louw (2005); Leibbrandt,
Table 5: The coverage of capital income in the tax micro-data
Rental income Interest income Dividends
2010 9.5 % 25.4 % 2.4 % 2011 11.7 % 25.0 % 5.3 % 2012 12.3 % 28.3 % 3.9 % 2013 13.4 % 28.8 % 5.2 % 2014 12.1 % 27.8 % 25.1 % 2015 12.3 % 27.8 % 10.6 % 2016 13.7 % 31.0 % 13.1 % 2017 6.9 % 18.3 % 15.8 %
Notes: The table shows the ratio of total income reported in the tax microdata to the corresponding total reported in the national accounts published by the SARB.
Source: authors’ computations based on data.
from sources other than employment, so that taxable income can be calculated. Thus, data from this form provides information on business, rental, interest and dividend incomes, which can be capitalised to calculate the asset bases from which the incomes derive. These data sources have been combined into a panel that provides detailed information about all incomes, allowances and deductions (for an overview and discussion of the dataset, see Ebrahim and Axelson 2019).
Due to its administrative nature, this data covers the full tax paying population, including individual observations at the top of the distribution. As it is not a sample, it identifies all individual taxpayers, which greatly increases the granularity of measured income flows. This is an advantage over surveys which often suffer from low sample biases. That being said, there are a number of limitations with tax microdata which should also be emphasised. The fact that the ITR12 forms are self-assessed implies that there may be tax evasion or under-reporting of income flows, especially if the likelihood of being controlled by tax authorities is low. More importantly, tax microdata only covers forms of incomes which are useful for tax collection and deductions purposes, which implies that other forms of non-taxable incomes are not reported in the data. This, as we show below, is particular problematic for the measurement of capital incomes.
In order to combine the tax data with survey data at the bottom of the distribution and capitalise income flows, we categorise the source codes reported in the tax data into seven broad categories: gross wages, business income, pension contributions, pension income, interest income, rental income and dividends (see appendix table A2).11 Table 5 shows that when looking specifically at capital incomes in the tax
data, the reported totals fall significantly below the national accounts. Interest income is better mea-sured than rental income and dividends, reaching between 25 per cent and 30 per cent of total interest received by households in the national accounts. Rental income and dividends are significantly lower and inconsistent, covering between 2 per cent to 25 per cent of national accounts totals.12
This under-representation of capital incomes in the tax data is due to three main factors. First, the taxable incomes are different from incomes reported in the national accounts, due to filing rules and tax base. This is particularly problematic for dividends, which in the ITR12 relate to dividends from equities that form part of compensation packages, such as equity share plans. These sort of dividends are subject to income tax, and so part of this data set, whereas dividends from regular ownership of equity is subject to a separate dividend tax. Approximately 80 per cent of dividend information would
11The IRP5 and ITR12 data are presented in the form of source codes corresponding to specific taxable income concepts,
exemptions and deductions. See Ebrahim and Axelson (2019) for a more complete discussion.
12The particularly low figures obtained in 2017 (fiscal year 2018) are mainly due to the fact that assessment was incomplete at
Figure 2: Share of financial assets held through trusts, 1975-2018 0 10 20 30 40 50 60
Share of assets held through trusts (%)
19741976197819801982198419861988199019921994199619982000200220042006200820102012201420162018
Currency, deposits, bonds, loans Corporate shares
Total financial assets
Notes: The figure shows the share of total household assets in the economy held by unit trusts. Source: authors’ compilation based on data from the SARB.
be recorded through this dividend tax returns (DTR01/2 forms), and this information is urgently required to make our estimate more reliable.
Secondly, there may be issues of misreporting of incomes by individual taxpayers. Interest income seems to be poorly covered as a result of incomplete tax filing by taxpayers. In principle, the South African Reserve Bank receives direct information from banks and financial services that they provide about interest. Banks and financial service providers separately supply customers with a tax certificate (IT3(b) certificate), which is meant to inform the interest income declared by the taxpayer. At the same time, the bank sends the South African Revenue Service a third-party submission about incomes its customers’ receive. However, given that interest income is typically low relative to total taxable income, it is possible that small interest income received go unreported. The misreporting of rental income received by individual taxpayers is likely to be more significant, given that rental income is self-reported and that there may be a significant amount of informal letting of fixed property.13
Finally, the most important issue regarding the coverage of capital incomes in the tax microdata is likely to be due to the definition of the taxpayer. The tax data covers only individuals and does not account forms of capital incomes received through units trusts or investment funds. This is particularly problematic in the case of South Africa, both because wealth is highly concentrated at the top of the distribution and because top wealth groups rely extensively on unit trusts. As shown in figure 2, the share of financial assets held through trusts exploded around the time of, politically, the end of apartheid, and economically, liberalisation and financialisation. Over half of specifically interest bearing and dividend
13Notice here that total rental income paid to individuals in the economy is estimated by the authors based on data from the
PSLSD, the IES and the GHS surveys on total rental income paid by households to individual landlords. Therefore, this includes informal rents paid, which may explain why the rental income the tax data is so low compared to the macro aggregate.
earnings financial assets are held in trusts. Trusts in South Africa are used more extensively, including housing mutual funds, as well as tax avoidance vehicles, and one mechanism of several to protect against wealth dilation (wealth loss across generations) (Ytterberg and Weller 2010). There is therefore a clear need to access data on trusts to gain clearer estimates of wealth at the top of the distribution, as well as to understand the mechanisms that results in the persistence of wealth concentration. Trusts are required to submit ITR12T forms, this is discussed in the appendix.
5 Bridging the micro-macro gap: the distribution of wealth in South Africa
This section brings together micro and macro data sources on household wealth in South Africa and discusses several main methods available to estimate the distribution of personal assets and liabilities that are harmonised to the national aggregates. We compare the results from what we identify as three broad approaches to measuring wealth inequality: direct measurement of wealth, rescaling of reported wealth, and capitalisation of income flows.
5.1 Methodological approaches: direct measurement, rescaling and capitalisation
For our purpose, it is interesting to compare three different ways of estimating the distribution of house-hold wealth. The first one, henceforth direct measurement, consists in using reported data on the market value of the assets and liabilities of households. In South Africa, the only publicly available data source enabling such measurement for the entire spectrum of household wealth components is the NIDS survey. This approach is likely to suffer from strong under-estimation of wealth inequality due to non-response and under-sampling issues at the top of the distribution. In particular, the direct measurement approach implies that figures are not consistent with macroeconomic statistics, both in terms of levels and compo-sition of household wealth. In the case of the NIDS we showed in section 4 that the direct measurement approach implies overstating the importance of housing assets and understating the significance of non-pension financial assets.
A second way of measuring the distribution of wealth, which we coin as “rescaling" in what follows, con-sists in assuming that the distribution of recorded wealth components and their correlation is relatively well measured by the household survey, but that it is mainly the average amounts of each component which are understated or overstated. In this case, one can obtain an estimate of the wealth distribution by effectively blowing up individual-level assets and liabilities to match the totals recorded in the na-tional accounts. The core identifying assumption is that individuals overestimate or underestimate the value of the assets and liabilities that they report, but that this misreporting is uncorrelated to rank within each asset class. This approach, as we show below, is problematic in our case because it tends to create a number of outliers, both at the top and at the bottom ends of the distribution. This is in large part because debts are very badly measured in survey data, so that rescaling reported values leads to giving unrealistic levels of debt at the very bottom of the distribution.
A third approach to measuring wealth inequality is the income capitalisation method. This approach consists in using the capital income flows corresponding to the assets and liabilities of households to approximate the distribution of wealth. In practice, this involves multiplying the income flow of a given asset class by the inverse of the rate of return of this type of asset. Just as in the case of rescaling, the capitalisation of income flows has the advantage of leading to figures which are consistent with aggregate household wealth. The identifying assumption in this case is that of constant rates of return by asset class. If the return to a given asset increases with wealth, for instance, then the income capitalisation method will lead to overestimating wealth concentration.
The capitalisation method is only possible for types of assets and liabilities generating income flows. In this paper, we rather propose a “mixed approach" as our preferred methodology to estimate the
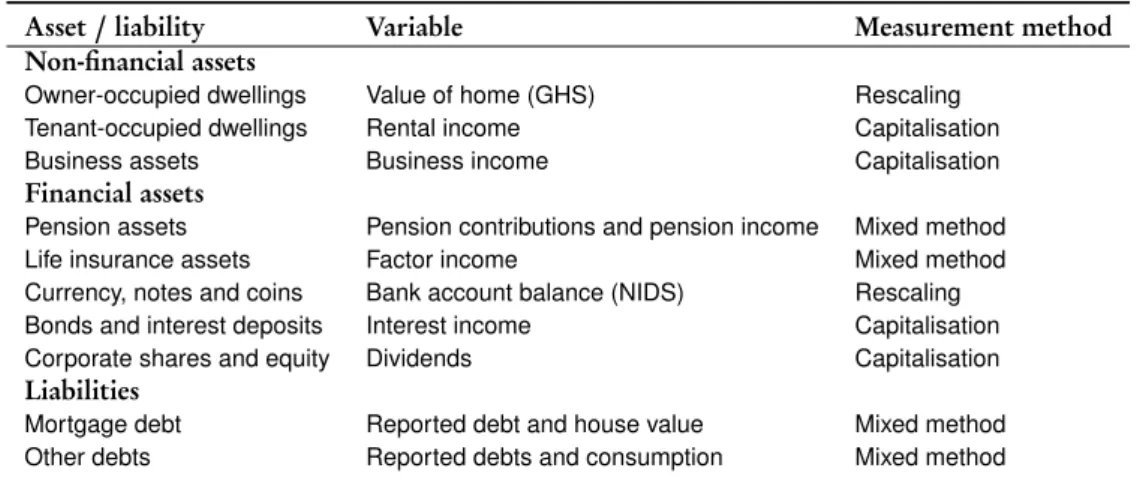
distribu-Table 6: Estimating the distribution of personal wealth in South Africa: a mixed approach
Asset/ liability Variable Measurement method Non-financial assets
Owner-occupied dwellings Value of home (GHS) Rescaling Tenant-occupied dwellings Rental income Capitalisation
Business assets Business income Capitalisation
Financial assets
Pension assets Pension contributions and pension income Mixed method
Life insurance assets Factor income Mixed method
Currency, notes and coins Bank account balance (NIDS) Rescaling Bonds and interest deposits Interest income Capitalisation Corporate shares and equity Dividends Capitalisation
Liabilities
Mortgage debt Reported debt and house value Mixed method Other debts Reported debts and consumption Mixed method
Notes: The table shows the methodological approach used to estimate distribution of the different assets and liabilities reported in the household balance sheets. Direct measurement corresponds to reported data on the market value of assets or liabilities. Capitalisation corresponds to assuming that the distribution of an asset follows that of one or several corresponding income flows. GHS: General Household Survey. NIDS: National Income Dynamics Survey.
Source: authors’ elaboration.
tion of wealth, by combining income capitalisation for available income flows with rescaling when no flow counterpart data is available. As shown in table 6, two types of household assets, owner-occupied dwellings and currency, notes and coins cannot be capitalised and have to be measured directly from available household surveys. We choose to capitalise six types of assets: tenant-occupied dwellings from the rental income received by individual landowners; business assets from the business income received by the business owners of unincorporated entreprises; pension assets from the pension contri-butions and pension income of formal wage earners and pensioners; life insurance assets from factor income; bonds and interest deposits from interest income; and corporate shares and equity from divi-dends received.14
Mortgage debt and other forms of debts have been recorded consistently in the NIDS and other house-hold surveys, but as we showed in section 2, the coverage of liabilities remains partial and inconsistent. As a result, rescaling debts to balance sheets totals may result in overestimating the number of individu-als with negative net worth and extrapolating implausibly high debt values. Instead, we follow a mixed method: we assume that the mortgage debt from the huosehold balance sheet is distributed proportion-ally to the value of the house of mortgagors in the surveys, and that other forms of debts are distributed proportionally to the consumption of those declaring having contracted debts. These are conservative assumptions, as mortgages and other forms of debt are likely to be more unequally distributed than house values and consumption respectively.
14In the case of pension assets, we follow the approach proposed by Saez and Zucman (2016) in allocating them to wage earners
and pensioners so as to match their distribution recorded in the NIDS. In our case, we assume that 75 per cent of pension assets belong to formal wage earners proportionally to pension contributions paid, and 25 per cent belong to pensioners proportionally to pension income received. As we show in the appendix (figure A5), this capitalisation technique applied to the NIDS data yields results which are very similar to those obtained from direct measurement. For life insurance assets, we assume that 50% belong to wage earners proportionally to factor income – the sum of wages, self-employment income and pension income – and that 50% belong to all other adults proportionally to factor income. This again reproduces well the distribution of life insurance assets reported in NIDS (see figure A6).
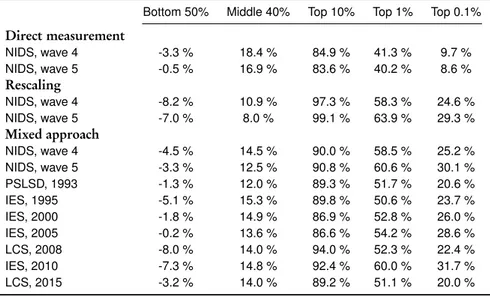
Table 7: Shares of household wealth held by groups in South Africa: survey-based results Bottom 50% Middle 40% Top 10% Top 1% Top 0.1%
Direct measurement NIDS, wave 4 -3.3 % 18.4 % 84.9 % 41.3 % 9.7 % NIDS, wave 5 -0.5 % 16.9 % 83.6 % 40.2 % 8.6 % Rescaling NIDS, wave 4 -8.2 % 10.9 % 97.3 % 58.3 % 24.6 % NIDS, wave 5 -7.0 % 8.0 % 99.1 % 63.9 % 29.3 % Mixed approach NIDS, wave 4 -4.5 % 14.5 % 90.0 % 58.5 % 25.2 % NIDS, wave 5 -3.3 % 12.5 % 90.8 % 60.6 % 30.1 % PSLSD, 1993 -1.3 % 12.0 % 89.3 % 51.7 % 20.6 % IES, 1995 -5.1 % 15.3 % 89.8 % 50.6 % 23.7 % IES, 2000 -1.8 % 14.9 % 86.9 % 52.8 % 26.0 % IES, 2005 -0.2 % 13.6 % 86.6 % 54.2 % 28.6 % LCS, 2008 -8.0 % 14.0 % 94.0 % 52.3 % 22.4 % IES, 2010 -7.3 % 14.8 % 92.4 % 60.0 % 31.7 % LCS, 2015 -3.2 % 14.0 % 89.2 % 51.1 % 20.0 %
Notes: The table compares estimates of the share of household wealth owned by the bottom 50 per cent (p0p50), the middle 40 per cent (p50p90), the top 10 per cent (p90p100), the top 1 per cent (p99p100 and the top 0.1 per cent (p99.9p100) obtained from household surveys using different methodological approaches. The unit of observation is the individual adult aged 20 or above. PSLSD: Project for Statistics on Living Standards and Development. IES: Income and Expenditure Survey. LCS: Living Conditions Survey. NIDS: National Income Dynamics Study.
Source: authors’ computations based on data.
5.2 Measuring wealth inequality using survey data
We start by looking at the distribution of personal wealth estimated from survey data. For all the fol-lowing results, we take the individual adult aged 20 or above as the unit of analysis.15Table 7 compares estimates of the share of wealth held by the bottom 50 per cent (p0p50), the middle 40 per cent (p50p90), the top 10 per cent (p90p100), the top 1 per cent (p99p100) and the top 0.1 per cent (p99.9p100) ob-tained from direct measurement, rescaling and the mixed approach. The NIDS survey is the only survey collecting direct data on wealth and thus for which the results from the three methodologies can be compared. Other household surveys collect data on the value of owner-occupied housing and household debts, so they can be used to estimate the wealth distribution with the mixed approach.16
The first result which clearly stands out is that all approaches converge in revealing an extreme degree of wealth concentration. Regardless of the methodology, the bottom 50 per cent of the South African adult population is consistently negative, while the top 10 per cent is higher than 80 per cent in all surveys and
15We therefore provide “individual" wealth inequality series rather than series where wealth is divided among spouses (narrow
equal-split), among adult household members (broad equal-split) or among both children and adult household members (per capita). The main motivation is that the tax microdata is only available at the individual level, so that applying equivalence scales to the survey data but not to the tax data would imply that the results are not comparable. Notice however that there are wealth components which are only measured at the household level – namely owner-occupied housing wealth, mortgage debt and non-mortgage debt. We split equally these components among adult members of the household. This is far from being a perfect solution, but overall wealth inequality is only moderately affected by changes in units of observation, especially at the top of the distribution. We report in the appendix (figure A9) how changes in equivalence scales affect survey-based top and bottom wealth shares.
16The PSLSD, IES and LCS surveys did not collect data on currency and non-interest deposits, so we impute their value from
the NIDS by assuming that their distribution has remained constant, both in terms of overall concentration and conditionally to post-tax income. Given the small share of currency and non-interest deposits in aggregate wealth, this imputation does not affect our results. Also notice that the data on owner-occupied housing wealth in the IES and LCS surveys is very erratic, so we keep the rank of housing wealth reported in these surveys but force its distribution to match that observed in the GHS between 2002 and 2018.
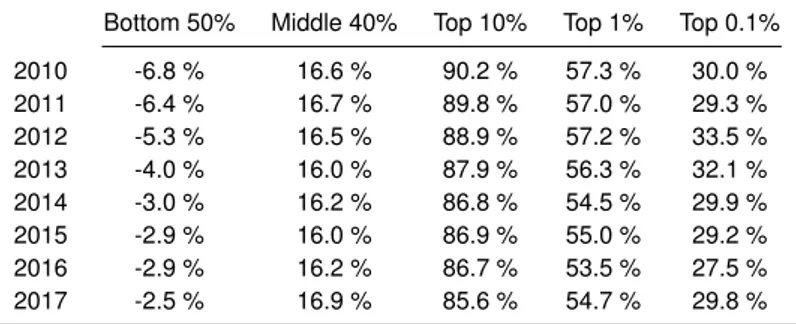
Table 8: Shares of household wealth held by groups in South Africa: results from tax microdata and survey combined
Bottom 50% Middle 40% Top 10% Top 1% Top 0.1% 2010 -6.8 % 16.6 % 90.2 % 57.3 % 30.0 % 2011 -6.4 % 16.7 % 89.8 % 57.0 % 29.3 % 2012 -5.3 % 16.5 % 88.9 % 57.2 % 33.5 % 2013 -4.0 % 16.0 % 87.9 % 56.3 % 32.1 % 2014 -3.0 % 16.2 % 86.8 % 54.5 % 29.9 % 2015 -2.9 % 16.0 % 86.9 % 55.0 % 29.2 % 2016 -2.9 % 16.2 % 86.7 % 53.5 % 27.5 % 2017 -2.5 % 16.9 % 85.6 % 54.7 % 29.8 % Notes: The table shows estimates of the share of household wealth owned by the bottom 50 per cent (p0p50), the middle 40 per cent (p50p90), the top 10 per cent (p90p100), the top 1 per cent (p99p100 and the top 0.1 per cent (p99.9p100) obtained from the income capitalisation method combining surveys and tax microdata. The unit of observation is the individual adult aged 20 or above.
Source: authors’ computations based on data.
methods. According to these results, wealth inequality in South Africa appears to be substantially larger than in any other country for which relatively reliable data is available (see below).
The second result is that there are some important differences in the results obtained from the three different approaches, especially at the top of the distribution. Direct measurement in the NIDS implies a top 0.1 per cent share below 10 per cent, more than twice lower than most of the results obtained from rescaling or the mixed approach. This is mainly due to the very poor coverage of other financial assets in the NIDS, which are particularly concentrated at the top end of the wealth distribution. Rescaling financial assets to balance sheets totals or capitalising income flows corrects for this micro-macro dis-crepancy. Rescaling the value of assets and liabilities increases wealth inequality significantly compared to the mixed approach. This is mainly due to the fact that blowing up debts to balance sheets totals cre-ates a large number of households with strongly negative net worth (the bottom 50 per cent goes down by several percentage points). Finally, it is interesting to note that the mixed approach yields relatively close results across years and data sources: the top 10 per cent share lies between 85 per cent and 90 per cent and the top 1 per cent is estimated to be between 50 per cent and 60 per cent in most cases. This suggests that despite the fact that these households surveys were conducted using different sampling methods and questionnaires, capitalising reported income flows remains somehow an efficient method to broadly capture the structure of wealth concentration in South Africa. Yet, all these surveys are likely to suffer from misreporting or non-response, which implies a misrepresentation of income and wealth inequality at the top end.
5.3 Measuring wealth inequality using tax data
We now turn to the estimation of the distribution of wealth obtained by combining surveys and tax data. As explained in section 4, tax microdata has the advantage of both better covering capital income flows and capturing with a greater degree of precision the levels and composition of incomes at the top end of the distribution. As a result, one may expect that our mixed method will lead to higher measured wealth inequality levels as compared to the capitalisation of income flows in household surveys. That being said, the important limitations of the tax data itself discussed above do prevent us from considering the tax-based estimates presented below as satisfactory.
Income tax data in South Africa does not cover the full adult population: the matched IRP5-ITR12 panel only covers between 40 per cent and 42 per cent of adults over the 2010-2017 period. In order to get a reliable estimate of wealth inequality, we combine the tax data with household surveys in two steps. In a first step, we derive an income concept which is comparable between the two sources, which we