HAL Id: hal-01833596
https://hal.archives-ouvertes.fr/hal-01833596
Submitted on 12 Feb 2019HAL is a multi-disciplinary open access archive for the deposit and dissemination of sci-entific research documents, whether they are pub-lished or not. The documents may come from teaching and research institutions in France or abroad, or from public or private research centers.
L’archive ouverte pluridisciplinaire HAL, est destinée au dépôt et à la diffusion de documents scientifiques de niveau recherche, publiés ou non, émanant des établissements d’enseignement et de recherche français ou étrangers, des laboratoires publics ou privés.
Mercury in blue shark (Prionace glauca) and shortfin
mako (Isurus oxyrinchus) from north-eastern Atlantic:
Implication for fishery management
Sebastian Biton-Porsmoguer, Daniela Bănaru, Charles F. Boudouresque, Ivan
Dekeyser, Marc Bouchoucha, Francoise Marco-Miralles, Benoit Lebreton, Gael
Guillou, Mireille Harmelin-Vivien
To cite this version:
Sebastian Biton-Porsmoguer, Daniela Bănaru, Charles F. Boudouresque, Ivan Dekeyser, Marc Bou-choucha, et al.. Mercury in blue shark (Prionace glauca) and shortfin mako (Isurus oxyrinchus) from north-eastern Atlantic: Implication for fishery management. Marine Pollution Bulletin, Elsevier, 2018, 127, pp.131-138. �10.1016/j.marpolbul.2017.12.006�. �hal-01833596�
1 Mercury in blue shark (Prionace glauca) and shortfin mako (Isurus oxyrinchus) from 1
north-eastern Atlantic: implication for fishery management 2
3
Sebastián Biton-Porsmoguera*, Daniela Bǎnarua, Charles F. Boudouresquea, Ivan Dekeysera,
4
Marc Bouchouchab, Françoise Marco-Mirallesb, Benoît Lebretonc, Gaël Guillouc, Mireille
5
Harmelin-Viviena
6 7
a
Aix-Marseille University, CNRS/INSU, Toulon University, IRD, Mediterranean Institute of
8
Oceanography (MIO) UM 110, Campus de Luminy, 13288 Marseille, France
9 b
Institut Français de Recherche pour l´Exploitation de la Mer (Ifremer), Z.P. Brégaillon, CS
10
20203, 83507 La Seyne-sur-Mer, France
11 c
Littoral Environnement et Sociétés, UMR 7266 CNRS-Université de La Rochelle, 2 Rue
12
Olympe de Gouges, 17000 La Rochelle, France
13 14
Short abstract (150 words) 15
16
Pelagic sharks (blue shark Prionace glauca and shortfin mako Isurus oxyrinchus) caught by
17
long-line fleets in the NE Atlantic were analysed for total mercury (Hg). Hg concentration in
18
muscle increased with size and weight in both species, but at a higher rate in shortfin mako.
19
Spatial variation was observed only in the blue shark with higher Hg values in the North of the
20
Azorean archipelago. These high-level predators are particularly susceptible to bioaccumulate
21
Hg. However, a significant positive relationship between Hg concentration and trophic level
22
(δ15N) of individuals was observed only in the shortfin mako. Most sharks landed were juveniles
23
which presented Hg concentration lower than the maximum limit allowed by the European
24
Union for marketing. However, concentrations above this threshold were most recorded in blue
25
sharks larger than 250 cm total length and in shortfin makos larger than 190 cm, raising the
26
question of the commercialization of large-sized individuals.
27 28 29 30 31
2 Abstract
32 33
Pelagic sharks (blue shark Prionace glauca and shortfin mako Isurus oxyrinchus) caught by
34
long-line Spanish and Portuguese fleets in the NE Atlantic, were sampled at Vigo fish market
35
(Spain) for total mercury (Hg) analysis. Hg concentration in white muscle increased with size
36
and weight in both species, but at a higher rate in shortfin mako than in the blue shark. No
37
difference was found with sex, year and season. Spatial variation was observed in the blue shark
38
with higher Hg values in the North of the Azorean archipelago, but not in the shortfin mako.
39
These high-level predators are particularly susceptible to bioaccumulate contaminants (Hg) in
40
their tissues (muscle). However, a significant positive relationship between Hg concentration and
41
trophic level (δ15
N) of individuals was observed only in the shortfin mako. Most sharks landed
42
were juveniles which presented Hg concentration lower than the maximum limit allowed by the
43
European Union (1 mg kg-1 wet weight) for marketing. However, concentrations above this
44
threshold were most recorded in blue sharks larger than 250 cm total length (TL) and in shortfin
45
makos larger than 190 cm TL, raising the question of the commercialization of large-sized
46
individuals.
47 48
KEYWORDS: Mercury · Pelagic sharks · Blue shark · Shortfin mako · Long-line fishery · NE
49 Atlantic 50 51 1. Introduction 52 53
Long-line Spanish and Portuguese fleets which exploit offshore north-eastern Atlantic waters
54
target pelagic sharks, particularly the blue shark Prionace glauca (Linnaeus, 1758) and the
55
shortfin mako Isurus oxyrinchus, Rafinesque, 1810, along with the swordfish Xiphias gladius
56
Linnaeus, 1758 (Torres et al., 2016). For the past 15 years (2001–2015), the mean landings per
57
year of blue shark represented 2 167 tonnes (63% of long-line landings) and 501 tonnes (14%)
58
for the shortfin mako at the fish market of Vigo in Galicia, Spain (Xunta da Galicia, 2008, pers.
59
comm.; ICCAT, 2015). Sharks are essentially sold for human consumption (meat and fin).
60
The blue shark can reach 380 cm in total length (TL) and could live up to 20 years in the North
61
Atlantic (Skomal and Natanson, 2003). Blue shark females are sexually mature at 220 cm TL
3
6 years) and males at 180 cm TL (4-5 years) (Moreno, 2004; Compagno et al., 2005). The
63
shortfin mako presents a heavier body at similar size than the blue shark, a longer maximum size
64
(440 cm) and a longer life span (30 years max) (Natanson et al., 2006). Median size and age at
65
maturity would be about 280 cm TL and 7-10 years for females, which present a larger size than
66
males, and 200 cm TL, 5-6 years for males (Moreno, 2004; Barreto et al., 2016). However,
67
information on age and growth of both shark species is conflicting and still a matter of debate
68
due to difficult and random sampling of these predators (Skomal and Natanson, 2003; Barreto et
69
al., 2016). These two shark species are highly mobile predators able to migrate over thousands of
70
kilometers in the north Atlantic Ocean (Kohler et al., 2002). Spanish and Portuguese long-liners
71
catch mostly small individuals therefore juveniles represent the major part of shark landings at
72
Vigo fish market for both species (73% of blue sharks and 94% of shortfin makos)
(Biton-73
Porsmoguer, 2015).
74
Sharks position as high-level predators in the marine food web (Ferretti et al., 2010) makes
75
them especially susceptible to contain high concentration of contaminants and particularly
76
mercury (Hg) (Storelli et al., 2002), as Hg is known to bioamplify along food webs, increasing
77
with the trophic level of organisms (Harmelin-Vivien et al., 2009, 2012; Lavoie et al., 2013).
78
Trophic level of organisms is routinely estimated by the nitrogen isotopic ratio (15N/14N),
79
expressed relative to a standard as δ15
N, which tends to increase with the size of individuals and
80
from prey to predator. δ15N is then used to follow the transfer and accumulation of contaminants
81
like Hg or PCB in organisms and food webs (Cabana and Rasmussen, 1994; Booth and Zeller,
82
2005; Cossa et al., 2012). Mercury is a highly toxic trace element present in all compartments of
83
the biosphere. It enters marine food webs from natural and anthropogenic sources (Cossa et al.,
84
2009), and foraging pathway is recognized as being the main Hg contamination way (Mathews
85
and Fisher, 2009). Hg is susceptible to impact aquatic ecosystems including commercial species
86
(McKinley and Johnston, 2010), which could result to adverse health effects on humans like
87
toxic effects on the nervous, digestive, cardiovascular and immune systems, and alterations of
88
fetal neurodevelopment (Castoldi et al., 2003; Diez, 2008). As consumption of marine organisms
89
contributes to most Hg intake in humans, a maximum acceptable level in marine products have
90
been laid down by European Commission regulations and set at 1 mg kg-1 wet weight (ww) for
91
high-level pelagic predators (European Commission, 2006: Regulation No 1881/2006). Fisheries
92
Department from Galician region is supposed to apply the European regulation and must control
4
sanitary state for all landed sea products (Law 11/2008, December 3rd 2008; Xunta da Galicia,
94
2008). But are the sharks landed and commercialized in Galicia fulfil all these requirements?
95
The main goals of the present study were thus to: (i) measure the total mercury concentration
96
in the muscle of sharks caught in the north-eastern Atlantic Ocean and sold at Vigo fish market,
97
(ii) determine the influence of size, weight, sex, trophic level, zones, season and year on Hg
98
content in these sharks, and (iii) consider the possible implications for the fishery management.
99 100 101
2. Material and methods 102
103
2.1. Sampling and stomach content analysis
104 105
Sharks were caught by Spanish and Portuguese long-line vessels in the north-eastern Atlantic
106
in five zones (A to F) between the Iberian Peninsula and the Azores archipelago (15º-35ºW and
107
30º-45ºN), in 2012 and 2013 (Fig. 1). A total of 40 blue shark (Prionace glauca) and 48 shortfin
108
mako (Isurus oxyrinchus) landed at the fish market of Vigo (Spain) were sampled (Table 1).
109
Blue shark and shortfin mako respectively measured from 74 to 284 cm and from 99 to 219 cm
110
total length (TL). White muscle samples were extracted one centimeter beneath the skin from
111
each individual, put in plastic bags and stored frozen at -20ºC. Once at the laboratory, samples
112
were cleaned with distilled water before freeze-drying, grinding and analyzing for total mercury
113
(Hg) and nitrogen stable isotopes (δ15N). Shark stomachs were extracted and stored at -20°C.
114
After identification and weighing (wet weight, ww) of the prey found in stomach contents, those
115
recently consumed (in good state of conservation) were freeze-dried and analyzed for Hg and
116
δ15
N in the same way as shark muscle samples. Total wet weights of partially digested prey were
117
reconstructed according to the size of their hard pieces (beaks for cephalopods and otoliths or
118
vertebrae for teleost fish) using pre-established relationships (Biton-Porsmoguer, 2015).
119
Reconstructed weight percentages (% ww) of the main prey types found in stomach contents
120
were then determined for both shark species.
121 122
2.2. Mercury and stable isotope analyses
123 124
5
Total Hg concentrations were determined with a semi-automated atomic absorption
125
spectrophotometer AMA 254 (Altec Ltd, Prague, Czech Republic) with a detection limit of 0.003
126
ng/mg, following the procedure described in Cossa et al. (2009). Hg quantification procedure
127
consisted in three automatic sequences: (1) ashing at 550°C of the freeze-dried sample for Hg
128
volatilisation, (2) evolved elemental Hg amalgamation on a gold trap, (3) atomic absorption
129
spectrophotometric measurement of the Hg collected after heating the gold trap at 800°C. The
130
accuracy of measurement was assessed every ten samples using certified reference materials
131
from the National Research Council of Canada (fish muscle tissues DORM-4). Hg concentration
132
level of samples was initially expressed as Hg dry weight (dw) concentration in fish muscle or
133
prey muscle samples. However, as Hg concentrations are expressed in wet weight (ww) in
134
international and European regulations, dry weight concentrations were converted into wet
135
weight concentrations, considering that dw concentration = 5 ww concentration (Cresson et al.,
136
2014). The relevancy of this factor has been corroborated with the samples of this study
137
(personal data).
138
Stable isotope analyses were performed with a continuous flow mass spectrometer (Delta V
139
Advantage, Thermo Scientific®, Bremen, Germany) coupled to an elemental analyzer (Flash EA
140
1112 Thermo Scientific®, Milan, Italy). N stable isotope ratios were expressed in the standard δ
141
notation: δ15N‰ = [(Rsample/Rstandard) - 1] x 103, where R is the ratio 15N/14N in sample and 142
standard (atmospheric air for nitrogen). Accuracy of measurement was estimated by replicate
143
measurements of internal standard (acetanilide) and was lower than 0.1‰.
144 145
2.3. Data analysis
146 147
Quantification of Hg concentrations in sharks’ diet: The diets of the blue shark and shortfin
148
mako in the sampling area have been previously studied (Biton-Porsmoguer et al., 2013, 2015).
149
The blue shark mainly fed on cephalopods, then teleost fish and rarely cetaceans, while the
150
shortfin mako mainly preyed on teleost fish, then cephalopods, and occasionally cetaceans and
151
chelonians. The importance in weight (% dw) of each prey type was determined for each species
152
and Hg concentration of their diet was quantified with the equation as in Harmelin-Vivien et al.
153
(2012):
154
Cdiet(i) = [Cprey(x) x Wprey(x)(i)] 155
6
where Cdiet(i) is the Hg concentration in the diet of the shark species (i), Cprey(x) is the Hg 156
concentration of the prey (x), Wprey(x)(i) is the percentage in weight of the prey (x) in the (i)th 157
shark species, and the sum of the product for all the (x) prey types. In a similar way, the δ15
N
158
value of the diet of each shark species was determined following the equation:
159
δ15
Ndiet(i) = [δ15Nprey(x) x Wprey(x)(i)] 160
where δ15
Ndiet(i) is the δ15N of the diet of the shark species (i), δ15Nprey(x) is the δ15N of the prey 161
(x), Wprey(x)(i) is the percentage in weight of the prey (x) in the (i)th shark species, and the sum 162
of the product for all the (x) prey types. These calculations represent only estimations as Hg
163
concentrations and δ15N are measured on prey muscles, while weights include all prey tissues.
164 165
Biomagnification factor calculations: A mean biomagnification factor (BMF) was determined
166
for the two sharks in the north-eastern Atlantic following Fisk et al. (2001), based on mean Hg
167
concentration and trophic level of sharks and their diet, using the following equation:
168
BMFshark(i) = [(Cshark(i)/Cdiet(i))/(δ15Nshark(i)/ δ15Ndiet(i))] 169
Where Cshark(i) is the Hg concentrationin the shark species (i), Cdiet(i) is the Hg concentrationin 170
the diet of the (i) shark species, δ15
Nshark(i) is the trophic level of the (i) shark species, and 171
δ15
Ndiet(i) is the trophic level of the diet of the (i) shark species. This factor is based on the 172
assumption that mercury concentration in a predator depends on those of its prey, corrected for
173
trophic level difference between predator and prey. We replace the trophic level estimation used
174
by Fisk et al. (2001) by δ15
N values, which represents a more accurate estimation of organism
175
trophic position.
176 177
Statistical analysis: As the number, size, weight and sex of individuals differed between
178
sampling zones and species, differences were tested by ANCOVA to remove the effects of these
179
parameters and consider only the factor tested. When significant differences were observed
180
Tukey post-hoc tests were performed. Relationships between Hg content and sharks size, weight
181
and δ15
N were tested by Pearson’s linear correlation on log10 transformed Hg concentrations to 182
linearize the regression and stabilize the variances. Differences in slope and elevation were tested
183
by appropriate t-test. T-test was also used for interspecific comparisons of Hg and δ15N values.
184 185 186
7 3. Results
187 188
3.1. Influence of biological parameters on Hg level
189 190
In both species, mercury concentration did not vary with sex for individuals of similar size or
191
weight (ANCOVA, all p > 0.05). Thus, sexes were combined for further analyses. Total Hg level
192
in muscle ranged from 0.14 to 1.71 mg kg-1 ww in the blue shark and from 0.12 to 2.57 mg kg-1
193
ww in the shortfin mako (Table 2). Mean Hg concentration and mean δ15N value were
194
significantly higher in the shortfin mako than in the blue shark (t-tests, t = -2.213, p = 0.029 and t
195
= -2.848, p = 0.006 respectively) (Table 2). Hg concentration increased significantly with size
196
and weight in both species, as significant linear relationships were observed between log Hg and
197
TL, (cm) and between log Hg and total weight (W kg ww) (log Hg = 0.009 W- 0.555, R2 = 0.59,
198
p < 0.001 in blue shark; log Hg = 0.012 W- 0.630, R2 = 0.66, p < 0.001 in shortfin mako).
199
Whatever the parameter considered (size or weight), the slope of the regression was significantly
200
higher (t-test, p < 0.05) for the shortfin mako than the blue shark, suggesting different
201
bioaccumulation capacities between the two species. However, the relationship between Hg
202
concentration and the trophic level of individual, expressed as δ15N values, was significant only
203
for the shortfin mako (log Hg = 0.169 δ15N – 2.181, R2 = 0.10, p = 0.036), but not for the blue
204
shark (log Hg = -0.069 δ15N + 0.422, R2 = 0.02, p = 0.197).
205 206
3.2. Geographical and temporal variations
207
In blue sharks of similar size, significantly higher mean Hg concentrations (x1.6) were
208
recorded in individuals collected in zone A, than in zone B, D and F, in which blue shark had
209
similar lower concentrations (ANCOVA F = 3.46, p = 0.026) and weight (ANCOVA F = 3.37, p
210
= 0.029). Pearson’s linear correlations between log Hg and size presented similar slopes in all
211
zones, but a higher intercept value in zone A (Fig. 3), suggesting the influence of environmental
212
differences between zone A in the North of the Azores archipelago and the other zones, rather
213
than a biological difference between individuals. In contrast, no difference of Hg level among
214
zones was observed for the shortfin mako, taken into account differences in size or weight of
215
individuals in the different zones (ANCOVA, F = 2.46, p = 0.086 for size; F = 1.49, p = 0.242
216
for weight). In both species and all zones combined, Hg concentration in muscle did not
8
significantly vary with year (2012 vs 2013) nor season (spring vs autumn) (ANCOVA, all p >
218
0.05).
219 220
3.3. Biomagnification factor and influence of diet
221 222
The biomagnification factor BMF takes only into account the last trophic level of the food web
223
analyzed (the predator and its prey). Hg level and δ15N of the main prey ingested by these two
224
sharks displayed highly variable inter- and intraspecific values (Table 3). The lowest mean Hg
225
concentrations were recorded in pelagic teleost prey fish, such as Scomber sp. (0.02 mg kg-1 ww)
226
and Scomberesox saurus (0.08 mg kg-1 ww), and the highest ones in some cephalopods (Illex sp.,
227
2.24 mg kg-1 ww) and the cetacean Delphinus delphis (1.77 mg kg-1 ww). The lowest δ15N value
228
was observed in the teleost fish Euthynnus alletteratus (9.7‰) and the highest one in the
229
cephalopod Ancistroteuthis lichtensteinii (12.9‰). No significant correlation was found between
230
log Hg and δ15N in prey, or δ15N in prey and sharks combined (R2 = 0.06, p > 0.05 for both
231
regressions). The blue shark and shortfin mako ingested then prey with various Hg burden, some
232
presenting higher Hg concentration and trophic level than them. The blue shark mainly fed on
233
cephalopods (76% by weight), teleost fish (18%) and cetaceans (0.03%), while the shortfin mako
234
preyed mainly on teleost fish (66% by weight), cephalopods (27%), cetaceans (0.05%) and sea
235
turtles (0.03%). When growing, the blue shark consumed less cephalopods and more teleosts and
236
cetaceans, while the shortfin mako ingest less teleosts and more cetaceans and chelonians. Mean
237
Hg concentration and δ15N in diet was higher for the blue shark than for shortfin mako, globally
238
and in most size classes (Table 4), while the reverse was observed in shark muscle with generally
239
higher Hg level in shortfin mako muscle than in blue shark muscle. Mean BMF value was low
240
(<1) in the blue shark, but higher than 1 in the shortfin mako (Table 4), suggesting Hg
241
bioamplification from diet to predator in the shortfin mako only. When the different size classes
242
were considered, it was observed that BMF tended to increase with the size of individuals in both
243
species, but not in a linear way. BMF remained always <1 in the blue shark suggesting no Hg
244
bioamplification in this species. In the shortfin mako, no bioamplification was recorded in the
245
smaller individuals (<130 cm TL) with BMF <1, while Hg bioamplification occurred for
larger-246
sized individuals (particularly >200 cm TL) with BMF largely >1. Such results indicated no
9
straightforward relationship between Hg level of prey and predator, but rather suggested
248
differences in metabolism and/or prey consumption rate between the two shark species.
249 250
3.4. Mercury in sharks and food safety
251 252
The significant exponential relationship evidenced between Hg level in muscle and body size
253
of sharks revealed that some individuals presented higher mean Hg concentration than the
254
European regulatory threshold (1.0 mg kg-1 ww) for the commercialization of high-level pelagic
255
predators. Hg level above this value was observed for 4 individuals over 200 cm TL in the blue
256
shark and for 12 individuals over 150 cm TL in the shortfin mako (Fig 4 and 5). We defined (i) a
257
size range of potential risk for consumers with individuals between 200-250 cm TL for the blue
258
shark (Fig 4), and 150-190 cm TL for shortfin mako (Fig 5), as such highly contaminated sharks
259
were present but not numerous in this size range, and (ii) a size at risk (250 cm TL for the blue
260
shark and 190 cm TL for the shortfin mako) above which most individuals presented higher Hg
261
level than the allowed EU limit.
262 263
4. Discussion 264
265
4.1. Bioaccumulation of Hg in blue shark and shortfin mako
266 267
In both shark species Hg concentration in muscle was positively correlated with size and thus
268
age (Fig. 2), independently of sex, suggesting similar feeding habits in males and females, as
269
observed by Biton-Porsmoguer et al. (2016) with stomach content analysis. Increase of Hg level
270
in organism as they were growing and getting older is a well-known bioaccumulation process in
271
marine organisms, particularly in teleost fish (Cossa et al., 2012; Cresson et al., 2014) and
high-272
level predators like sharks (Storelli et al., 2001, 2002; Branco et al., 2004, 2007; Torres et al.,
273
2017) and cetaceans (André et al., 1991). This age-related increase in Hg content is related to an
274
efficient accumulation of mercury due to the decrease of both detoxification capability and
275
growth rate (Amlund et al., 2007; Dang and Wang, 2012). But many parameters can influence
276
the bioaccumulation of Hg in organism along with age, such as growth rate, reproduction,
277
metabolic activity, Hg concentration in prey and feeding rate (Trudel and Rasmussen, 2006;
10
Cossa et al., 2012). Diet is recognized as the main pathway of Hg intake in high-level predators
279
(Boening, 2000). Both shark species ingested prey of various Hg content and δ15N values, some
280
being more contaminated and positioned at a higher trophic level than sharks (Table 3). Hg
281
concentration and δ15N in diet did not increase with shark size (Table 4). Thus, the hypothesis of
282
an increase in Hg uptake when sharks were growing linked to an increase in Hg content of diet
283
was not supported by our study. Larger sharks did not always seem to feed at a higher more
284
contaminated trophic level than smaller ones, as observed by McMeans et al. (2010) in Arctic
285
sharks. Feeding on larger prey did not imply to feed on more contaminated or higher trophic
286
level organisms. No relationship between Hg concentration and δ15N was found in the blue
287
shark, as also observed by Torres et al. (2017) south of the Azores and Escobar-Sánchez et al.
288
(2010) at Baja California, or by Rumbold et al. (2014) for coastal sharks in Florida. Conversely,
289
positive relationship between Hg and δ15N was observed in shortfin mako. This result was also
290
observed in a few shark species analyzed in Australia (Pethybridge et al., 2011) or in the Celtic
291
sea (Domi et al. 2005). Hg is efficiently accumulated in shark tissues with a very slow
292
elimination rate as in teleost fish (Amlund et al., 2007). In addition, the fractionation and
turn-293
over of δ15N between diet and shark tissue seems to be also slower in sharks than teleost fish
294
(Hussey et al. 2012), suggesting particular metabolic activity related to nitrogen cycling in
295
elasmobranchs. Torres et al. (2017) recorded also similar Hg concentrations and δ15N values in
296
male and female blue sharks. The absence of influence of sex, season and year on mercury level
297
in both species can be explained by the high mobility of these sharks regardless of sex (Queiroz
298
et al., 2016) and the large spectrum of prey consumed at different seasons during the two years
299
(Biton-Porsmoguer et al., 2013, 2015).
300
A higher increase in Hg content with size was observed in the shortfin mako compared with
301
blue shark (Fig. 2), suggesting different bioaccumulation processes between the two species
302
(age, diet, activity and/or metabolism). While the blue shark and the shortfin mako are long-lived
303
species (with a higher life span for shortfin mako) (Skomal and Natanson, 2003; Natanson et al.,
304
2006), the age of specimens analyzed in this study ranged likely from 1 to 10 years for both
305
species with a majority of juveniles (87.5%), especially in the shortfin mako (Biton-Porsmoguer,
306
2015). Shortfin makos were heavier than blue sharks at the same size, invalidating the possibility
307
of a dilution of Hg by growth in the blue shark to explain its lower Hg content. Higher Hg
308
content of diet in shortfin mako was also not supported by our results (Table 4). Thus, the higher
11
Hg concentration observed in the shortfin mako could not be attributed to an older age, a slower
310
growth rate or a higher Hg content of its prey. Differences in metabolic activity and feeding rate
311
could explain the higher Hg uptake with size observed in shortfin mako compared to blue shark.
312
Shortfin mako belongs to the warm-bodied Lamnidae which present an elevated aerobic
313
metabolism compared to their ectothermic relatives like the blue shark which belongs to the
314
Carcharhinidae (Shadwick and Goldbogen, 2012). The shortfin mako can maintain higher
315
musculature, brain, eyes and viscera temperatures than the surrounding water (1 to 10°C higher
316
than ambient temperature) (Carey, 1982). Therefore, it needs to eat more frequently than the blue
317
shark and accumulates more mercury due to an increased feeding rate. This hypothesis was
318
supported by the lower vacuity index (percentage with an empty stomach) observed in the
319
shortfin mako (36%) compared to blue shark (47%) (Biton-Porsmoguer, 2005).
320 321
4.2. Regional differences
322 323
Mercury levels recorded in the blue shark in this study (0.14-1.71 mg kg-1 ww) were in
324
agreement with values previously reported in different studies performed in the north Atlantic
325
Ocean (0.16-1.84 mg kg-1 ww) and Tasmania (SW Pacific Ocean) (0.27-1.20 mg kg-1 ww), but
326
not on the south coast of Brazil (0.46-2.40 mg kg-1 ww) (De Carvalho et al., 2014) where higher
327
Hg concentrations were recorded (Table 5). This may be related to the high mobility of these
328
sharks, their ability to cover large areas for feeding and their dietary opportunism. However,
329
Branco et al. (2007) record a higher accumulation rate of total mercury with size in the blue
330
shark from the equatorial Atlantic (0.68-2.50 mg kg-1 ww) compared with specimens from the
331
Azores archipelago (0.22-1.30 mg kg-1 ww). They relate this pattern to higher Hg concentration
332
in prey, as well as differences in quantity and type of food eaten in the Equator. Such a
333
hypothesis was not relevant in our study, as the rate (regression slope) of Hg increase in blue
334
shark with size was similar in all zones (Fig. 3). Higher Hg concentrations in the north of Azores
335
could not be attributed to gender, as no difference with sex was observed. In mid-Atlantic (south
336
of the Azores), Torres et al. (2017) record lower Hg concentrations in the blue shark than we did
337
for individuals of similar size range in the same area (0.33 ± 0.02 and 0.41 ± 0.02 respectively).
338
The higher intercept value of the linear regression for specimens from the north of the Azores
339
suggested rather the influence of environmental conditions with probably higher Hg
12
concentrations in sea water and prey in this zone, but no difference in metabolism, feeding rate
341
or prey types between populations. The Azores archipelago is a volcanic region with naturally
342
high mercury level in sea water and sediment (Guest et al., 1999) that may explain the
343
significantly higher levels of Hg found in the blue sharks of zone A. Moreover, the Azores
344
archipelago constitutes probably a nursery area for the blue shark and juveniles can stay in this
345
area at least for two years (Vandeperre et al., 2014), accumulating thus a higher Hg burden
346
during this time. However, in the absence of Hg concentration analysis in seawater and in a
347
higher number of prey in the different zones, we cannot test this hypothesis.
348
No difference in Hg concentration among zones was observed for the shortfin mako in this
349
study. This homogeneity was probably due to the high swimming activity of this species, which
350
moves frequently between distant zones (Kohler et al., 2002). The Hg values recorded in the
351
shortfin mako were high (0.12-2.57 mg kg-1 ww) and in the range of those observed for this
352
species in the north Atlantic and other oceans (0.15-3.12 mg kg-1 ww) (Table 5).
353 354
4.3. Biomagnification of Hg in sharks
355 356
Mercury, under its organic monomethylmercury form, is one of the few trace metals that
357
biomagnifies along food webs (Gray, 2002). Biomagnification is assumed when BMF factor
358
(concentration in predator/concentration in diet corrected from their respective trophic level) is
359
higher than 1 (Fisk et al., 2001). Biomagnification of Hg was observed only in the shortfin mako,
360
not in the blue shark (Table 4). These two sharks consumed prey with a great variability in both
361
Hg concentration and δ15N value (Table 3). For the blue shark, Hg content in diet was higher
362
than in shark muscle for all size classes, leading up to a BMF always <1, while slightly
363
increasing with size. For the shortfin mako, higher Hg content in shark muscle compared with
364
diet and BMF values >1 were observed from individuals larger than 130 cm, and more
365
significantly larger than 200 cm. However, BMF calculation should be considered cautiously.
366
First, the reduced number of prey analysed in this study is not sufficient to characterize the
367
global diet of the two species and a broader study should be conducted to conclude. Second, the
368
same mean Hg and δ15
N values of prey groups were used for all size-classes of both sharks.
369
However, as observed by Biton-Porsmoguer et al. (2015), they could prey on different species.
370
Finally, the time lag between ingestion and assimilation of prey was not considered. Stomach
13
content offered a snap shot of shark’s diet when caught, while muscle Hg concentration reflected
372
food assimilation over several months. Nonetheless, similar results are reported by Maz-Courrau
373
et al. (2012) at Baja California with Hg biomagnification in the shortfin mako but not in the blue
374
shark. The absence of any Hg biomagnification in blue shark is also observed in the Pacific
375
Ocean of México by Escobar-Sánchez et al. (2011). Difference in BMF factor between the two
376
species, with Hg biomagnification occurring only in the shortfin mako is probably related with
377
their metabolic differences (endothermy in shortfin mako vs ectothermy in blue shark)
378
(Shadwick and Goldbogen, 2012) as discussed above, with a positive relationship between Hg
379
content and δ15
N in the shortfin mako and not in blue shark.
380 381
4.4. Food safety and fishery implication
382 383
The mean values of mercury level in the muscle of blue shark and shortfin mako analyzed in
384
this study were lower than the upper limit allowed by the European Union in high-level pelagic
385
predators for human consumption (1 mg kg-1 ww) (Table 2), as also observed by Torres et al.
386
(2017) for these species. However, Hg concentration exceeded the legal EU standard in larger
387
individuals (Fig. 4 and 5). Above 250 cm TL in P. glauca and 190 cm TL in I. oxyrinchus most,
388
if not all, individuals exhibited Hg content well above the EU sanitary risk limit, representing a
389
size at risk for the consumption of these species. Measuring mercury concentration above
390
European and international regulatory thresholds in shark muscle is regularly reported in the
391
literature, whatever the ecology, geographic distribution or feeding habits of species (Storelli et
392
al., 2002; Branco et al., 2004, 2007; Pethybridge et al., 2010; Escobar-Sánchez et al., 2011; De
393
Carvalho et al., 2014; Cresson et al., 2014; Mc Kinney et al., 2016, and references in Table 5).
394
All authors raise the health issue of shark, and more generally high-level predator, consumption.
395
However, Hg concentration value alone does not seem to be sufficient to evaluate the toxicity of
396
marine organisms for human consumption, but rather the molar ratio Se:Hg, as selenium is
397
known to play a protective role against the toxic effects of Hg and enhance detoxifying
398
mechanisms (Branco et al., 2007; Khan and Wang, 2009). But studies on sharks record low
399
Se:Hg values (Kaneko and Ralston, 2007; Escobar-Sánchez et al., 2011) or no relationship
400
between Se and Hg concentrations (Torres et al., 2017), which leaves unsold the problem of Hg
401
toxicity in larger sharks.
14
The commercialisation of blue shark (>250 cm TL) and shortfin mako (>190 cm TL) exceeding
403
the size at risk is thus an issue for Galician Fishery Authorities in terms of compliance with
404
European legislation. The shark fisheries are not regulated (no quotas and size limits) in Spain.
405
According to our results, in terms of human food safety, we wonder about the possible risk
406
linked to large shark consumption, especially when they are caught between the Azores
407
Archipelago and the Iberian Peninsula. However, limiting large shark consumption may lead to
408
an increase in finning practice (prohibited in the EU in 2003 with application for Spain and
409
Portugal in June 2013). Therefore, maritime control should be enforced for the strict application
410
of the Council Regulation (EC No 1185/2003). Furthermore, some nursery areas, such as the
411
Azores Archipelago (Vandeperre et al., 2014), Gulf of Cadix (Compagno et al., 2005), and north
412
of Galicia (Biton-Porsmoguer, pers. com.), may concentrate big blue shark females exceeding
413
the size at risk for mercury level. Within these areas shark fishing should be limited or at least
414
regulated. No information about reproduction activities has been recorded for shortfin mako up
415 to now. 416 417 5. Conclusions 418 419
Mercury concentrations in muscle of the blue shark P. glauca and the shortfin mako I.
420
oxyrinchus in north-eastern Atlantic were in the range of values reported in other regions for
421
these widely-distributed sharks. An increase in Hg burden with length and weight was observed
422
in both species, but at a higher rate in the shortfin mako. Bioaccumulation of Hg with individual
423
trophic level (δ15
N) and biomagnification from prey to predator was only observed in the shortfin
424
mako, and likely related to its endothermic metabolism and higher feeding activity. The absence
425
of significant difference between sexes, seasons and years in both species could be explained by
426
the high mobility of these sharks and their feeding adaptation to different environmental
427
conditions. Most blue shark and shortfin mako landed and sold at the fish market of Vigo (Spain)
428
exhibited Hg concentration in muscle lower than the maximum limit allowed by the European
429
Union for human consumption (1 mg kg-1 ww), as they were juveniles. However, Hg content
430
above this legal threshold was recorded in the majority of adult blue shark larger than 250 cm TL
431
and shortfin mako larger than 190 cm TL. Then, we recommend avoiding the capture and
432
commercialization of individuals exceeding these respective lengths for the two species. In
15
addition, a size range of potential risk was defined (from 200 to 250 cm for the blue shark and
434
from 150 to 190 cm for the shortfin mako) in which some individuals might present Hg
435
concentration above the legal limit. The landing of blue shark and shortfin mako in Vigo during
436
the next decade should assume the implementation of management measures for the sustainable
437
fishing exploitation and the conservation of these species.
438 439
Acknowledgments 440
441
We gratefully acknowledge the Port Authority of Vigo (Spain), which authorized sampling, and
442
the Captains of the fishing boats for allowing us to measure and dissect landed sharks before
443
selling them. Mercury analyses were realized by Ifremer Laboratory at La Seyne-sur-Mer
444
(France). Stable isotope analyses were performed at the LIENSs laboratory, University of La
445
Rochelle (France). Thank are also due to Michael Paul, a native English speaker, for English
446
correction, and to an anonymous reviewer for most helpful comments.
447 448
References 449
Amlund, H., Lundebye, A.K., Berntssen, M.H.G., 2007. Accumulation and elimination of
450
methylmercury in Atlantic cod (Gadus morhua L.) following dietary exposure. Aquat.
451
Toxicol. 83, 323−330.
452
André, J., Boudou, A., Ribeyre, F., Bernhard, M., 1991. Comparative study of mercury
453
accumulation in Dolphins (Stenella coeruleoalba) from French Atlantic and
454
Mediterranean coasts. Sci. Total Environ. 104, 191−209.
455
Barreto, R.R., de Farias, W.K.T, Andrade, H., Santana, F.M., Lessa R., 2016. Age, growth and
456
spatial distribution of the life stages of the shortfin mako, Isurus oxyrinchus (Rafinesque,
457
1810) caught in the western and central Atlantic. PLoS One. 11(4), e0153062.
458
Biton-Porsmoguer, S., 2015. Biologie, écologie et conservation du requin peau bleue (Prionace
459
glauca) et du requin mako (Isurus oxyrinchus) en Atlantique nord-est. Thèse doctorale.
460
Aix-Marseille Université. 269p.
461
Biton-Porsmoguer, S., Bǎnaru, D., Béarez, P., Dekeyser, I., Merchán Fornelino, M.,
Míguez-462
Lozano, R., Boudouresque, C-F., 2013. Diet of the shortfin Mako Isurus oxyrinchus and
16
the blue shark Prionace glauca in the northeastern Atlantic Ocean. Rapp. Comm. int.
464
Mer Médit. 40, 499.
465
Biton-Porsmoguer, S., Bӑnaru, D., Boudouresque, C-F., Dekeyser, I, Merchán, M., 2015. DNA
466
evidence of the consumption of short-beaked common dolphin Delphinus delphis by the
467
shortfin mako Isurus oxyrinchus, in the Northeastern Atlantic Ocean, Mar. Ecol. Progr.
468
Ser. 532, 177−183.
469
Biton-Porsmoguer, S., Dekeyser, I., Bӑnaru, D., Bouchoucha, M., Marco-Miralles, F., 2016.
470
Using the body mass index (BMI) to estimate mercury contamination of the blue shark
471
(Prionace glauca) and the shortfin mako (Isurus oxyrinchus). Cybium 40(4), 319−322.
472
Boening, D.X., 2000. Ecological effects, transport, and fate of mercury: a general review.
473
Chemosphere 40, 1335−1351.
474
Booth S., Zeller D., 2005. Mercury, food webs, and marine mammals: implications of diet and
475
climate change for human health. Environ. Health Persp. 113, 521–526.
476
Branco, V., Canário, J., Vale, C., Raimundo, J., Reis, C., 2004. Total and organic mercury
477
concentrations in muscle tissue of the blue shark (Prionace glauca L.1758) from the
478
Northeast Atlantic. Baseline / Mar. Pollut. Bull. 49, 854–874.
479
Branco, V., Vale, C., Canário, J., Santos, M.N., 2007. Mercury and selenium in blue shark
480
(Prionace glauca, L. 1758) and swordfish (Xiphias gladius, L. 1758) from two areas of
481
the Atlantic Ocean. Environ. Pollut. 150, 373−380.
482
Cabana, G., Rasmussen, J.B., 1994. Modelling food chain structure and contaminant
483
bioaccumulation using stable nitrogen isotopes. Nature 372, 255–257.
484
Carey, F.G. 1982. Warm fish. In: C. R. Taylor, K. Johansen & L. Bolis, eds., A companion to
485
animal physiology. Cambridge University Press, Chapt. 16, 216−233.
486
Castalodi, A.F., Coccini, T., Manzon, L., 2003. Neurotoxic and molecular effects of
487
methylmercury in humans. Rev. Environ Health. 18, 19−31.
488
Compagno, L., Dando, M., Fowler, S., 2005. Guía de campos de los tiburones del mundo.
489
Barcelona, Ediciones Omega, 357p.
490
Cossa, D., Averty, B., Pirrone, N., 2009. The origin of methylmercury in open Mediterranean
491
waters. Limnol. Oceanogr. 54, 837−844.
492
Cossa, D., Harmelin-Vivien, M., Mellon-Duval, L., Loizeau, V., Averty, B., Crochet, S., Chou,
493
L., Cadiou, J.-F. 2012. Influence of bioavaibility, trophic position and growth on
17
methylmercury in hakes (Merluccius merluccius) from northwestern Mediterranean and
495
northeast Atlantic. Environ. Sci. Technol. 46, 4885−4893.
496
Council Regulation (EC) Nº. 1185/2003 of 26 June of 2003 on the removal of fins of sharks on
497
board vessels. Official Journal of the European Union L 167/1, 26 June 2003, 3p.
498
Cresson, P., Fabri, M.C., Bouchoucha, M., Brach Papa, C., Chavanon, F., Jadaud, A., Knoery, J.,
499
Miralles, F., Cossa, D. 2014. Mercury in organisms from the Northwestern
500
Mediterranean slope: Importance of food sources. Sci. Total Environ. 497−498, 229−238.
501
Dang, F., Wang, W.X., 2012. Why mercury concentration increases with fish size? Biokinetic
502
explanation. Environ. Pollut. 163, 192-198.
503
Davenport, S., 1995. Mercury in blue sharks and deepwater dogfish from around Tasmania.
504
Australian Fish. 54 (3), 20−22.
505
De Carvalho, G.G.A., Degaspari, I.A.M., Branco, V., Canário, J., Ferreira de Amorim, A.,
506
Kennedy, V.H., Ferreira, J.R., 2014. Assessment of total and organic mercury levels in
507
blue sharks (Prionace glauca) from the South and Southeastern Brazilian Coast. Trace
508
Elem. Res. 159, 128−134.
509
Dias, A.C.L., Guimarães, J.R.D., Malm. O., Costa, P.A.S., 2008. Total mercury in muscle of the
510
shark Prionace glauca (Linnaeus, 1758) and swordfish Xiphias gladius Linnaeus, 1758,
511
from the South-Southeast coast of Brazil and the implications for public health. Cad.
512
Saúde Pública, Rio de Janeiro. 24(9), 2063−2070.
513
Díez, S., 2008. Human health effects of methylmercury exposure. In: D.M. Whitacre (ed.) Rev.
514
Environ. Contam. T. 198, 111−132.
515
Domi N., Bouquegneau J.M., Das K., 2005. Feeding ecology of five commercial shark species
516
from the Celtic Sea through stable isotope and trace metal analysis. Mar. Environ. Res.
517
60(5), 551−569.
518
Escobar-Sánchez, O., Galván-Magaña, F., Rosíles-Martínez, R., 2011. Biomagnification of
519
mercury and selenium in blue shark Prionace glauca from the Pacific Ocean of Mexico.
520
Biol. Trace Elem. Res. 144, 550–559.
521
European Commission., 2006. Commission Regulation (EC) No 1881/2006 of 19 December
522
2006 setting maximum levels for certain contaminants in foodstuffs. Off. J. Eur.
523
Communities: Legis 37:4. ELI: http://data.europa.eu/eli/reg/2006/1881/2015−05−21.
18
Ferretti, F., Worm, B., Britten, G.L., Heithaus, M.R., Lotze, H.K. 2010. Patterns and ecosystem
525
consequences of shark declines in the ocean. Ecol. Lett. 13, 1055–1071.
526
Fisk, A.T., Hobson, K.A., Norstrom, R.J., 2001. Influence of chemical and biological factors on
527
trophic transfer of persistent organic pollutants in the Northwater Polynia marine food
528
web. Environ. Sci. Technol. 35, 732−738.
529
Gray, J.S., 2002. Biomagnification in marine systems: the perspective of an ecologist. Mar. Poll.
530
Bull. 45, 46−52.
531
Guest, J. E., Gaspar, J. L., Cole, P. D., Queiroz, G., Duncan, A. M., Wallestein, N., Ferreira, T.,
532
Pacheco, J-M., 1999. Volcanic geology of Furnas Volcano, Sao Miguel, Azores. J.
533
Volcanol. 92, 1−29
534
Harmelin-Vivien, M., Bodiguel, X., Charmasson, S., Loizeau, V., Mellon-Duval, C.,
535
Tronczyński, J.,Cossa, D., 2012. Differential biomagnification of PCB, PBDE, Hg and
536
Radiocesium in the food web of the European hake from the NW Mediterranean. Mar.
537
Poll. Bull. 64, 974−983.
538
Harmelin-Vivien, M., Cossa, D., Crochet, S., Bănaru, D., Letourneur, Y., Mellon-Duval, C.,
539
2009. Difference of mercury bioaccumulation in red mullets from the north-western
540
Mediterranean and Black seas. Mar. Poll. Bull. 58, 679−685.
541
Hussey, N.E., MacNeil, M.A., Olin, J.A., McMeans, B.C., Kinney, M.J., Chapman, D.D., Fisk,
542
A.T., 2012. Stable isotopes and elasmobranchs: tissue types, methods, applications and
543
assumptions. J. Fish Biol. 80, 1449–1484.
544
ICCAT., 2015. Report of the 2015 ICCAT Blue Shark stock assessment session. Portugal 2015,
545
1−115.
546
Instituto Español de Oceanografía (IEO)., 2003. Niveles de arsénico y metales pesados en
547
Marrajos (Isurus oxyrinchus), Pez espada (Xiphias gladius) y Tintorera (Prionace
548
glauca). Informe final. Convenio específico de colaboración entre la Secretaría General
549
de Pesca Marítima y el Instituto Español de Oceanografía. 48p.
550
Kaneko, J.J., Ralston, N.V., 2007. Selenium and mercury in pelagic fish in the central North
551
Pacific near Hawaii. Biol. Trace Elem. Res. 119, 242−254.
552
Khan, M.A.K., Wang, F., 2009. Mercury-selenium compounds and their toxicological
553
significance: Toward a molecular understanding of the mercury-selenium antagonism.
554
Environ. Toxicol. Chem. 28, 1567−1577.
19
Kohler, N.E., Turner, P.A., Hoey, J.J., Natanson L.J., Briggs R., 2002. Tag and recapture data for
556
three pelagic shark species: blue shark (Prionace glauca), shortfin mako (Isurus
557
oxyrinchus) and porbeagle (Lamna nasus) in the north Atlantic Ocean. Coll. Vol. Sci.
558
Pap. ICCAT. 54 (4), 1231−1260.
559
Lavoie, R.A., Jardine, T.D., Chumchal, M.M., Kidd, K.A, Campbell, L.M., 2013.
560
Biomagnification of mercury in aquatic food webs: A worldwide meta-analysis. Environ.
561
Sci. Technol. 47, 13385−13394.
562
Mathews, T., Fisher, N.S., 2009. Dominance of dietary intake of metals in marine elasmobranch
563
and teleos fish. Sci. Total Environ. 407, 5156–5161.
564
Maz-Courrau, A., López-Vera, C., Galván-Magaña, F., Escobar-Sánchez, O., Rosíles-Martínez,
565
R., Sanjuán-Muñoz, A., 2012. Bioaccumulation and biomagnification of total mercury in
566
four exploited shark species in the Baja California Peninsula, Mexico. Bull. Environ.
567
Contam. Toxicol. 88, 129–134.
568
McKinley, A., Johnston, E.L., 2010. Impacts of contaminant sources on marine fish abundance
569
and species richness: a review and meta-analysis of evidence from the field. Mar. Ecol.
570
Progr. Ser. 420, 175−191.
571
McKinney, M.A., Dean, K., Hussey, N.E., Cliff, G., Wintner, S.P., Dudley, S.F.J., Zungu, M.P.,
572
Fisk, A.T., 2016. Global versus local causes and health implications of high mercury
573
concentrations in sharks from the east coast of South Africa. Sci. Total Environ. 541,
574
176−183.
575
McMeans, B.C., Svavarsson, J., Dennard, S., Fisk, A.T., 2010. Diet and resource use among
576
Greenland sharks (Somniosus microcephalus) and teleosts sampled in Icelandic waters,
577
using 13C, 15
N, and mercury. Can J Fish Aquat Sci. 67, 1428–1438.
578
Moreno, J.A., 2004. Guía de los tiburones de aguas ibéricas, Atlántico nororiental y
579
Mediterráneo. Barcelona, Omega publ. 315p.
580
Nakano, H. and Stevens, J.D., 2008. The biology and ecology of the blue shark, Prionace
581
glauca; pp. 140−151. In Sharks of the open ocean: Biology, fisheries and conservation.
582
Edited by M. D. Camhi, E. K. Pikitch, and E. A. Babcock. Blackwell Publishing. Oxford,
583
U.K.
20
Natanson, L.J., Kohler, N.E., Ardizzone, D., Cailliet, G.M., Wintner, S.P., Mollet, H.F., 2006.
585
Validated age and growth estimates for the shortfin mako, Isurus oxyrinchus, in the North
586
Atlantic Ocean. Environ. Biol. Fish. 77, 367−383.
587
Pethybridge, H., Cossa, D., Butler, E.C.V., 2010. Mercury in 16 demersal sharks from southeast
588
Australia: Biotic and abiotic sources of variation and consumer health implications. Mar.
589
Environ. Res. 69, 18−26.
590
Queiroz, N., Humphries, N.E., Mucientes, G., Hammerschlag, N., Lima, F.P., Scales, K.L.,
591
Miller, P.I., Sousa, L.L., Seabra, R., Sim, D.W, 2016. Ocean-wide tracking of pelagic
592
sharks reveals extent of overlap with longline fishing hotspots. Proc. Natl. Acad. Sci.
593
U.S.A. 113(6), 1582−1587.
594
Rumbold, D., Wasno, R., Hammerschlag, N., Volety, A., 2014. Mercury accumulation in sharks
595
from the coastal waters of southwest Florida. Arch. Environ. Contam. Toxicol. 67,
596
402−412.
597
Shadwick, R.E., Goldbogen, J.A., 2012. Muscle function and swimming in sharks. J. Fish. Biol.
598
80, 1904−1939.
599
Skomal, G.B., Natanson, L.J., 2003. Age and growth of the blue shark (Prionace glauca) in the
600
North Atlantic Ocean. Fish. Bull. 101, 627−639.
601
Storelli, M.M., Giacominelli-Stuffler, R., Marcotrigiano, G.O., 2001. Total mercury and
602
methymercury in tuna fish and sharks from the south Adriatic Sea. Ital. J. Food Sci. 13,
603
101−106.
604
Storelli, M.M., Giacominelli-Stuffler, R., Marcotrigiano, G.O., 2002. Mercury accumulation and
605
speciation in muscle tissue of different species of sharks from Mediterranean Sea, Italy.
606
Bull. Environ. Contam. Toxicol. 68, 201–210.
607
Suk, S.S., Smith, S.E., Ramon, D.A., 2009. Bioaccumulation of mercury in pelagic sharks from
608
the Northeast Pacific Ocean. Cal. Coop. Ocean Fish. 50, 172−177.
609
Teffer, A.K., 2014. Heavy metal food chain: Relating feeding ecology and mercury
610
bioaccumulation in Southern New England´s top pelagic predators. Master´s Thesis.
611
University of Massachussets, Amherst, MA.
612
Trudel, M., Rasmussen, J.B., 2006. Bioenergetics and mercury dynamics in fish: a modelling
613
perspective. Can. J. Fish Aquat. Sci. 63, 1890–1902.
21
Torres, P., Tristão da Cunha, R., dos Santos Rodrigues, A., 2017. Mid-Atlantic elasmobranchs:
615
Suitable metal scouts? Mar. Pollut. Bull. http://dx.doi.org/10.1016/j.marpolubul.
616
2017.01.058.
617
Torres, P., Tristão da Cunha, R., dos Santos Rodrigues, A., 2016. The elasmobranch fisheries of
618
the Azores. Mar. Policy 73, 108-118.
619
Vandeperre, F., Aires-da-Silvas, A., Fontes, J., Santos, M. Serrão Santos, R., Afonso, P., 2014.
620
Movements of blue sharks (Prionace glauca) across their life history. PLoS ONE 9(8):
621
e103538. doi:10.1371/journal.pone. 0103538.
622
Xunta de Galicia. 2008. Ley 11/2008, del 3 de Diciembre, de pesca de Galicia. Publicado
623
en DOG núm. 243 de 16 de Diciembre de 2008 y BOE núm. 15 de 17 de Enero de 2009
624 625
22 Tables
626 627
Table 1. Number of individuals analyzed by sex, season, year and zone for blue shark and
628
shortfin mako. M: Male, F: Female.
629 630 631
Species Sex Season Year Zone
M F Winter Summer 2012 2013 A B C D E F Blue shark 20 20 18 22 19 21 18 11 0 9 0 2 Shortfin mako 26 22 18 30 18 30 9 16 13 0 7 3 632 633 634 635
Table 2. Mean (SD), (min – max) total length (TL, cm), total weight (W, kg ww), total Hg
636
concentration (Hg, mg kg-1 ww) and δ15N (‰) of the analyzed blue shark and shortfin mako.
637 638 Species TL (cm) W (kg ww) Hg (mg kg-1 ww) δ15 N (‰) Blue shark 160 (56) (74 – 284) 21.0 (21.2) (1.5 – 77.0) 0.52 (0.35) (0.14 – 1.71) 11.3 (0.8) (10.0 – 13.7) Shortfin mako 156 (36) (99 – 219) 40.3 (62.7) (7.0 – 76.8) 0.74 (0.56) (0.12 – 2.57) 11.8 (0.6) (9.6 – 12.9) 639 640
23
Table 3. Mean (SD) Hg concentration (mg kg-1 ww) and trophic level (δ15N) in the various prey
641
of blue shark and shortfin mako. N = number of samples analyzed; unid. = unidentified
642 643 Prey type N Hg (mg kg-1 ww) N δ15N (‰) Cephalopods Ancistroteuthis lichtensteinii Gonatus steenstrupi Illex coindetii Illex sp. Cephalopods unid. 1 1 1 1 6 1.17 0.23 0.20 2.24 1.24 (0.86) 3 3 3 3 12 12.9 (0.1) 10.7 (0.1) 11.3 (0.1) 11.7 (0.1) 12.1 (0.9) Teleost fish Balistes capriscus Euthynnus alletteratus Scomberesox saurus Scomber scombrus Scomber sp. Thunnus alalunga Xiphias gladius Teleosts unid. 1 2 8 3 2 3 1 3 0.06 1.08 (1.07) 0.08 (0.03) 0.13 (0.08) 0.02 (0.001) 1.35 (0.09) 1.43 0.20 (0.21) 3 6 12 9 6 9 3 9 10.1 (0.1) 9.7 (0.3) 11.2 (0.5) 11.2 (0.2) 12.2 (0.6) 11.8 (0.5) 12.0 (0.2) 11.1 (0.1) Chelonians Caretta caretta 1 0.59 3 9.8 (0.1) Cetaceans Delphinus delphis Cetaceans unid. 2 2 1.77 (0.36) 0.46 (0.05) 6 6 10.6 (0.5) 10.9 (0.1) 644 645 646 647
24
Table 4. Mean Hg concentration (mg kg-1 ww) and δ15N (‰) in the two shark species and their
648
respective diet, and biomagnification factor (BMF) calculated from sharks to their diet in all
649
individuals combined and in the different size classes analyzed (T1-T5), N = number of
650
individuals analyzed.
651 652
653
* The single 99 cm TL mako was included in T2 size class
654 655 656 657 658 659 660 661 662 663 664 Species N Hg-shark (mg kg-1 ww) δ15 N-shark (‰) Hg-diet (mg kg-1 ww) δ15 N-diet (‰) BMF Blue shark T1 (<100 cm TL) T2 (100-129 cm TL) T3 (130-159 cm TL) T4 (160-200 cm TL) T5 (>200 cm TL) 40 6 9 8 7 10 0.52 0.25 0.36 0.37 0.62 0.86 11.3 11.3 11.0 11.3 11.6 11.3 0.95 1.06 1.12 1.05 0.68 1.03 11.8 11.8 11.9 11.8 11.5 10.9 0.57 0.25 0.35 0.37 0.91 0.80 Shortfin mako T2 (100-129 cm TL)* T3 (130-159 cm TL) T4 (160-200 cm TL) T5 (>200 cm TL) 48 11 16 12 9 0.74 0.28 0.75 0.54 1.59 11.8 11.4 11.5 12.1 12.0 0.61 0.65 0.69 0.84 0.59 11.6 11.1 11.5 11.3 10.1 1.19 0.42 1.09 0.60 2.26
25 Table 5. Range of total Hg levels in the blue shark (Prionace glauca) and the shortfin mako (Isurus 665
oxyrinchus) in the Atlantic and other oceans. * = mean values; TL = total length of individuals (cm); Hg =
666
total Hg concentration in muscle (mg kg-1 ww); Ref. = reference of the study cited. 667
668
(1) Present study, (2) Branco et al. (2004), (3) Branco et al. (2007), (4) IEO (2003), (5) Teffer (2014), (6) 669
Torres et al. (2016), (7) Dias et al. (2008), (8) De Carvalho et al. (2014), (9) McKinney et al. (2016), (10) 670
Davenport (1995), (11) Maz-Courrau et al. (2012), (12), Suk et al. (2009), (13) Storelli et al. (2001). 671 672 673 674 675 676 677 678 679 Region
Blue shark Shortfin mako TL (cm) Hg (mg kg-1 ww) TL (cm) Hg (mg kg-1 ww) Ref.
Azores & Iberian Peninsula (NE Atlantic) 79-284 0.14-1.71 100-219 0.12-2.57 (1) Azores Archipelago (NE Atlantic)
South-Eastern Azores (NE Atlantic)
84-239 98-223 0.16-1.84 0.14-0.50 - 153-216 - 0.35-1.53 (2, 3) (4)
Canary Islands (NE Atlantic) 216-258 0.16-1.84 - - (2)
New England (NW Atlantic) - - 199* 2.65* (5)
North Atlantic Equatorial Atlantic 160-274 172-265 1.25* 0.68-2.50 106-285 - 3.12* - (4) (6) South Atlantic 122-274 1.01* 94-262 2.14* (4) Brazil (SW Atlantic) 77-137 0.46-2.40 - - (7, 8) Indian Ocean 164-269 1.24* 119-262 2.34* (4)
South Africa (SW Indian Ocean) - - 161-220 2.69* (9)
Tasmania (SW Pacific Ocean) 89-335 0.27-1.20 - - (10)
Baja California (NE Pacific Ocean) - - 127* 1.05* (11)
California (NE Pacific Ocean) - - 75-330 0.15-2.90 (12)
Hawaï (Pacific Ocean) - - 105-240 0.40-3.10 (12)
26 680 Fig. 1. 681 682 683 684 685
Fig. 1. Map of the 6 sampling areas (A to F) between the Azores Archipelago and the Iberian
686
Peninsula (North-eastern Atlantic Ocean) and two sampled species (the blue shark in black areas
687
and the shortfin mako in grey areas)
688 689 690 691
27
Fig. 2.
692 693
694
Fig. 2. Correlation between log10Hg and size in blue shark (N=40, black line and circles) and
695
shortfin mako (N=48, grey line and circles)
696 697 698 699 700 701 702 703 704 705
28 Fig. 3. 706 707 708 709
Fig.3. Spatial difference of correlation between log Hg and size in the blue shark in zone A
710
(northeast of the Azores, white diamonds) compared with the other sampling zones (B, D and F,
711 black squares). 712 713 714 715 716 717 718 719 720 721 722 723 724
29 725 Fig. 4. 726 727 728 729
Fig. 4. Correlation between Hg level (mg kg-1 ww) and total length (TL, cm) in the blue shark.
730
The horizontal bold line corresponds to the European regulatory threshold (1.0 mg kg-1 ww) for
731
commercialization. The light grey area indicates the size range of potential risk (from which
732
several sharks might be above the threshold) and the dark grey area starts at the size at risk (from
733
which most sharks exceed the threshold).
734 735 736 737 738 739 740 741 742 743 744
30 745 Fig. 5. 746 747 748
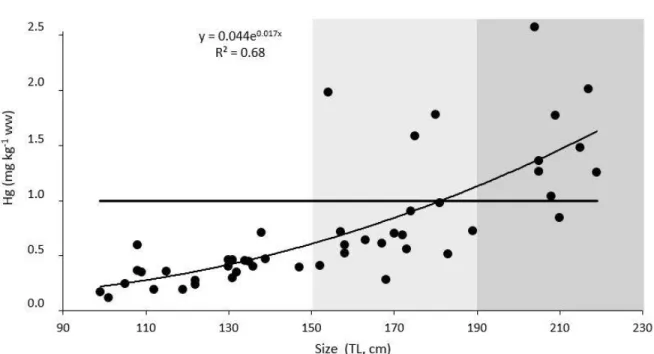
Fig. 5. Correlation between Hg level (mg kg-1 ww) and total length (TL, cm) in the shortfin
749
mako. The horizontal bold line corresponds to the European regulatory threshold (1.0 mg kg-1
750
ww) for commercialization. The light grey area indicates the size range of potential risk (from
751
which several sharks might be above the threshold) and the dark grey area starts at the size at risk
752
(from which most sharks exceed the threshold).
753 754 755