Contents lists available atScienceDirect
Journal of Environmental Management
journal homepage:www.elsevier.com/locate/jenvmanResearch article
Contribution of agroecological farming systems to the delivery of ecosystem
services
Fanny Boeraeve
a,∗, Nicolas Dendoncker
b, Jean-Thomas Cornélis
c, Florine Degrune
d,
Marc Dufrêne
aaBiodiversity and Landscapes Unit, TERRA Teaching and Research Center, Gembloux Agro-Bio Tech, University of Liege, Passage des Déportés 2, 5030, Gembloux, Belgium bDepartment of Geography, Institute Transitions, University of Namur, Rue de Bruxelles 61, 5000, Namur, Belgium
cWater, Soil and Plant Exchanges Unit, TERRA Teaching and Research Center, Gembloux Agro-Bio Tech, University of Liege, Belgium dFreie Universität Berlin, Germany
A R T I C L E I N F O Keywords: Sustainable agriculture Multifunctional Transition Trade-off Synergy
Ecosystem service bundle
A B S T R A C T
Agroecology has been suggested as a promising concept for reconciling agricultural production and environ-mental sustainability by optimizing ecological processes that deliver ecosystem services (ES) to replace external inputs. While this statement is widely agreed upon, few assessments of real-life conditions exist that assess multiple ES simultaneously. This paper provides an assessment of seven ES based on 14 indicators in three agroecological farming systems (AFS) and thirteen of their adjacent conventional farming systems (CFS). Based on field-scale measurements spread over three years, our findings suggest that the studied AFS succeed in providing a wider array of regulating services than their neighboring CFS. Soil aggregate stability and soil respiration rates are in general more supported in AFS, which also show lower pest abundance. On the other hand, CFS show higher grain production and higher performance for two out of three fodder quality indices. While this ‘productivity gap’ may be due to the still-evolving state of the studied AFS, we nuance this through the lens of an emerging paradigm to assess farming system multi-performance. It is now argued that we need to shift from a volume-focused production system to a system that also values the ecological processes underpinning crop production and other benefits to society. Based on our findings, we recommend future work to iterate our initiative, including several indicators per service and embed these into a wider context of co-adaptive science-practice to further develop context-specific and user-useful research.
1. Introduction
Achieving food security is no longer a matter of producing only quantity. In less than a century, agricultural yields have quintupled thanks to moto-mechanization, mineral fertilization, crop selection and food system specialization. However, this comes at the cost of damaged ecosystems (Tilman et al., 2002; Stoate et al., 2009) and threatens farmers and consumers’ health (Gordon et al., 2017; Kunde et al., 2017).
Today's challenge is thus to maintain high agricultural productivity while sustaining the environment and its functions (Hodbod et al., 2016, Garbach et al. 2017). The solution is no longer to rely intensively on external resources, but to restore agro-ecological functions as a means to increase the farms' resilience and autonomy (Landis, 2017; Gordon et al., 2017). Future farming systems will have to be explicitly designed to provide multifunctional and more resilient landscapes (Holt
et al., 2016), and agroecology is being promoted as a promising ap-proach to answer this call (Wezel et al., 2013;Hatt et al., 2016, Garbach et al. 2017).
The approach of agroecology promotes the safeguarding of ecolo-gical processes and functions that underpin the delivery of ecosystem services (ES) that are crucial to the ES crop production (e.g. soil nu-trient cycles, pest control) and other ES beneficial to society (e.g. aes-thetic landscapes, healthy food) (Zhang et al., 2007;Malézieux, 2012; Duru et al., 2015). The concept of agroecology also encompasses the social and economic dimensions of food systems (Francis et al., 2003) and can be defined as a science, a movement and/or a practice (Wezel et al., 2011). The scope of the present article focuses on the ‘practice’ side of agreoecology, in which the concept aims to provide synergies to deliver multiple ES within a system. A wide range of agroecological practices can be reported, such as integrating natural and semi-natural landscape elements, implementing cover crops, using green manure,
https://doi.org/10.1016/j.jenvman.2019.109576
Received 11 October 2018; Received in revised form 17 April 2019; Accepted 12 September 2019 ∗Corresponding author.
E-mail address:f.boeraeve@uliege.be(F. Boeraeve).
relying on intercropping or agroforestry, etc. (Wezel et al., 2013;Hatt et al., 2016).
To achieve the design of innovative multifunctional productive agroecological systems, we require a thorough understanding of the relationships between ecological processes, functions and services, both under current conditions and after transitioning (Dale and Polasky, 2007;Dendoncker et al., 2018). A large range of indicators are needed to provide the required information to understand the agroecosystem and adapt it to its socio-ecological context. Farming systems represent complex entities with synergizing or offsetting processes and practices. Hence, research aiming to disentangle this complexity requires system-based and multidimensional approaches (Kremen et al., 2012; Robertson et al., 2014,Ponisio et al., 2015).
However, while an ever-increasing body of literature acknowledges this need, little research simultaneously investigates multiple ES on transitioning agroecological farms (Bommarco et al., 2013;Andersson et al., 2015;Holt et al., 2016). Conventional agricultural research fo-cuses on disciplinary approaches which have led to a set of standardized practices applicable to most pedo-climatic conditions (Hatt et al., 2016). Hence, conventional agricultural research produces knowledge on specific agricultural practices and single services. Most agricultural research assessing multiple services has been based on mapping ap-proaches and land use indices (e.g. Maes et al., 2012), models (e.g. Lerouge et al., 2016) or literature reviews and meta-analyses (Kremen and Miles, 2012;Barral et al., 2015;Rapidel et al., 2015, Garbach et al. 2017). Some examples exist of field-based, farm-scale assessments of multiple ES (Porter et al., 2009; Sandhu et al., 2010; Syswerda and Robertson, 2014), but these fail to assess interactions between services and practices (Seppelt et al., 2011; Landis, 2017) and are based on experimental farms. While research in experimental fields allows the isolation of factors and biases, studying real-life examples of agroeco-logical transitions with a systemic approach presents the advantage of examining systems which have to adapt to their social and environ-mental constraints, thus providing analyses of realistic conditions (Drinkwater, 2002). To the best of our knowledge, no research ad-dresses agroecological systems by analyzing multiple ES delivery and the underlying synergies and tradeoffs. Yet, agroecology calls for site-specific, holistic and decentralized scientific approaches to design practices adapted to each socio-environmental system (Dale and Polasky, 2007;Méndez et al., 2013;Bommarco et al., 2013;Andersson et al., 2015;Ponisio and Kremen, 2016).
This study contributes to answering this gap and endorses this new paradigm by assessing the multi-performance of innovative agroecolo-gical farming systems (AFS) through an integrated ES assessment. The studied AFS are located in the western part of the Hainaut Province in Belgium. They are part of a self-organizing network of farmers who work together to achieve more resilience and autonomy on their farms. Among these, we have selected three cereal farms which we consider to be agroecological as they combine multiple ecological practices: they are organic, implement soil reduced tillage, crop intercropping and green infrastructures within the farm's landscape. While these AFS have undertaken a transition of their entire food system, the present research focuses on the agroecosystem and agricultural practices. These AFS are unique examples of cereal cropping systems located at a relatively high level of ‘agroecologization’ as they combine multiple agroecological practices (Horlings and Marsden, 2011;Wezel et al., 2013).
The present study carries out field-scale ES assessments in order to better understand key ecological interactions that constrain or enhance the mutli-performance of AFS. As a diachronic analysis of the AFS be-fore their transition is not possible, the assessment is carried out con-comitantly in adjacent conventional parcels growing cereals and sharing the same environment and soil type. Following a participatory ES identification and selection (Boeraeve et al., 2018), we assess seven regulating and provisioning ES based on 14 indicators. Our study is, to the best of our knowledge, the first attempt to assess multiple ES si-multaneously, based on a field-scale approach and to rely on real-life
AFS examples. Our aim is to test the theoretical hypothesis that eco-logical processes and interactions can substitute for external and che-mical inputs of intensively managed CFS and that AFS offer greater ES synergies.
2. Materials and methods 2.1. General sampling approach
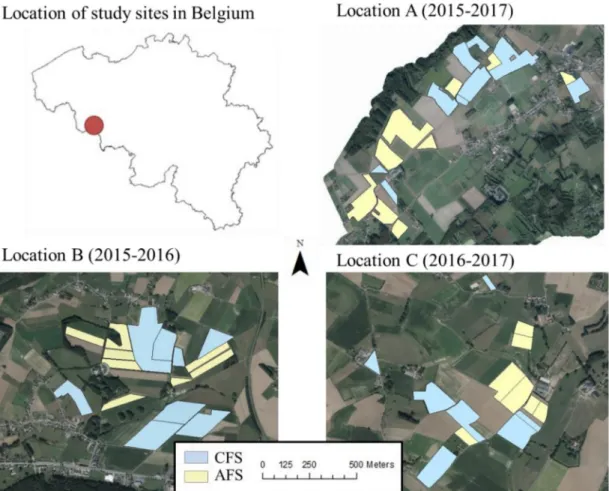
The present research is a system-experiment on commercial farms which contrasts with factorial-experiments on experimental sites, as are often the case in agricultural research (Drinkwater, 2002). The research studied three AFS (as there are only three such AFS in Belgium) and a diversity of thirteen neighboring CFS. In total, 24 parcels of AFS and 24 parcels of CFS were compared. For each sampling year, all AFS parcels with cereal intercropping were selected, and for each AFS parcel a ‘reference’ parcel was selected among adjacent CFS to represent the AFS parcel before the transition. This ‘pairing’ between AFS and CFS parcels was done under the conditions that winter wheat was grown in CFS (as this crop is sown and harvested at the same time as the AFS cereal intercropping) and that they shared the same soil type (homogenized soil texture, drainage and soil profile development). Similar soil types were first determined based on the soil map of Wallonia (Bock et al., 2008) and then validated on the ground by soil scientists. Each AFS surrounded by its reference CFS parcels represents a distinct farm-set, referred to as locations A, B and C. Each location was sampled twice between 2015 and 2017 (Tables 1 and 2).
2.2. Site and farm description
The studied farms are located in the western part of the Hainaut province in Belgium (Fig. 1). The climate is oceanic temperate with annual rainfall around 800 mm/year and average temperatures are around 10 °C. Location A lies on a loamy sand (i.e., dominance of sand) while B and C are located on sandy loam (i.e., dominance of loam). The three selected AFS have been selected as they share similar farming practices: they are certified organic, rely on reduced tillage and direct seeding, grow cereals in intercropping and implement green infra-structures (hedgerows, wildflower strips, etc.). The intercropping con-sists in mixing mainly triticale, oats, rye, spelt, pea and vetch. For lo-cation A and B mixes alternate with a winter mix (called ‘biomax’ which includes: sunflower, vetch, field beans, clover, winter radish Daikon and phacelia). This winter mix is rolled by a FACA roller before sowing the cereal mix. Location C does not make use of biomax as they sow very close to the harvest date. The selected AFS have combined organic agriculture and reduced tillage for the last eight years and are still evolving. Agricultural practices of AFS are summarized inTable 1.
CFS are conventionally managed, i.e., mineral fertilizers and syn-thetic weed and pest controls are applied and the ground is tilled or ploughed.Table 2details the agricultural practices of the selected CFS, which are representatives of conventional Walloon cereal farms, while selected AFS are ‘niche examples’ as these are the only farming systems in Belgium to combine these agroecological practices.
2.3. Identification and selection of ES and their indicators
As suggested byDendoncker et al. (2018), the biophysical ES as-sessment is embedded in a social valuation to guide the selection of context-relevant ES. ES were identified at the very start of the project through a consultation with nine farmers of the studied farms (ES providers and beneficiaries) and 11 local inhabitants (ES beneficiaries). The procedure includes prioritization based on both an individual and a collective scoring and follows a common methodology for participatory ES selection (Boeraeve et al., 2018). The prioritized ES were then subject to the technical constraints of the project (i.e., expertise, time, equipment and finance). The final ES list comprises seven services that
include two provisioning services: fodder production and quality; and five regulating services: soil quality, pest control, erosion control, flood control and water pollution control. We refer to the ES ‘fodder’ pro-duction and quality instead of ‘food’ because the cereals of the studied farms (both for AFS and CFS) are grown for fodder purposes, as are most cereal crops in Wallonia (Delcour et al., 2014).
As many services are difficult to directly quantify, many indicators relate the state of the ecosystem or ecological processes and thus in-dicate the potential ES delivery, and not the actual ES delivery. In order to offer transparency, we structure our indicators within a framework depicted in Fig. 2that distinguishes between indicators of ecosystem state, processes or functions, services and benefits. ‘Ecosystem state’ indicators reflect the structure and composition of ecosystems, such as soil data or the abundance of specific organisms. ‘Ecosystem processes and functions’ are the basic ecosystem functions that become ES when of benefit to humans. Following the recommendations of Andersson et al. (2015), we used – when relevant – several indicators for the same service, to more comprehensively portray the processes underlying ES delivery.
2.4. Field measurements for ES assessment
The selection of measurement methods for each indicator followed the approach of the Rapid Ecosystem Function Assessment (REFA) suggesting a suite of fast, easy-to-use, repeatable and cost-efficient methods to quantify essential ecosystem components (Meyer et al., 2015). This approach was chosen to span a larger range of ES and to allow better transmission of the results to the farmers.Table 3presents the measurement method selected for each indicator.
2.4.1. Soil physico-chemical properties
Soil data was gathered to describe the agroecosystem as soil phy-sico–chemical properties underpin ecological processes, such as soil decomposition. Additionally, this step served to investigate the corre-lation between soil parameters and ES.
Soil was sampled mid-July to coincide with the maturity of the cereals. In each parcel, three soil composites (500 g from six sampling points) were collected using an auger of 20 cm length and 5 cm width. Samples were analyzed by the Provincial Center of Agriculture and Rurality in La Hulpe (Belgium). Available nutrients (P, Mg, Ca and K) were extracted with EDTA (Ethylenediaminetetraacetic acid) extractant (Lakanen and Erviö, 1971) and their concentrations were then assessed by means of atomic absorption spectroscopy (Mg, Ca and K) or spec-trophotometry (P). The other parameters were assessed following ISO norms: pH (water & KCl): ISO 10390 (2005); Total C and N contents: ISO10694 (1995); cation exchange capacity: ISO 23470 (2007). 2.4.2. Soil erosion protection
To assess the soil resilience to erosion, soil aggregate stability was measured through the commonly used wet-sieving method (Herrick et al., 2001; Seybold and Herrick, 2001). Nine soil aggregates were collected per parcel at the end of October, when erosion problems are usually encountered. Sieves were constructed from 1.5 mm mesh screens and 2 cm diameter PVC tubes. Samples were rated from one to six based on a combination of ocular observations of slacking during the first 5 min following immersion in distilled water, and the percent re-maining after five dipping cycles at the end of the 5 min period. Despite manual sieving and visual rating, the method has been proven to pro-vide as valuable information as laboratory estimations (including weighing scales and mechanical sieving) (Herrick et al., 2001). 2.4.3. Water pollution protection
Soil samples were examined for remaining nitrates (NO3-) content at the end of fall (November) as an indicator of potentially leaching ni-trates to streams and ground water. Three composite samples were collected through the longest diagonals of the parcel, corresponding to three depths (0-30, 30-60 and 60-90 cm). Each composite was com-posed of 10 sample points arranged over two crossing transects, and analyzed in the ‘Soil and Ecology’ technical plateform in Gembloux Agro-Bio Tech (Belgium). Nitrate was extracted from the soil sample Table 1
Description of the three agroecological farming systems (AFS) studied in the present research.
Location A (AFS 1) Location B (AFS 2) Location C (AFS 3)
Sampling years 2015–2017 2015–2016 2016–2017
Number of parcels 9 8 7
Total surface (ha) 94 115 23
Cultivation surface (ha) 86 70 15
Permanent grasslands surface
(ha) 8 10 8
Ecological structure surface and
type 9ha of agri-environmental measures: wildflower strips 35ha of agri-environmental measures(hedgerows, ponds, wildflower strips) 1 parcel in agroforestry
Animal (amount, unit) since 2015: 25 Angus cows since 2015: 25 Angus cows 1982–1997: dairy cows
2002: 100: goats
Tillage type today direct seeding reduced tillage
Year of transition to reduced
tillage 1995 2013 2015 (before: only 1 ploughing/5years)
Year of transition to direct
seeding 2010 NA NA
Year of transition to organic
farming 2011 2011 1997
Rotation Alternation: cereal-pulse mix - biomax (i.e. winter cover).
With rarely hemp or potatoes instead of cereal mix for locaction A or favabeans for location B. 3 years temporary grasslands - 2years cereal-pulse mix
Approximate time of cereal-pulse
mix sowing September–October
Composition of cereal-pulse mix triticale, oats, rye, spelt, pea, and vetch triticale, oats, pea, spelt triticale, oats, rye, spelt, pea, vetch,
buckwheat Approximate time of winter cover
sowing August (after harvesting the cereal mix) NA
Composition of winter cover Clover, favabeans, buckwheat, flaxseed, phacelia,
sunflower, oat, vetch, peas, lupin, forage radishes Sunflower, vetch, peas, favabean, flaxseed,chinese radish, phacelia No winter cover
Fertilization 2012: organic TMS
Before potatoes: Ramial chipped wood (RCW) or manure (<1/year)
NA Before sowing cereal-pulse mix: goat
Table 2 Description of the conventional farming systems (CFS) neighbors of the agroecological farming systems (AFS) in the three locations (A, B and C). The 1st column indicates the years when the parcels were sampled; the 2nd column the amount of parcels sampled per farm, then the third column indicates surfaces at the farm scale (total, croplands and grasslands); the 4th column lists the crops grown within the farm rotation (although only winter wheat parcels were studied); the 5th column provides details of the livestock of each farm; the 6th column provides information on fertilizer types and frequency of use per season (Frequ., numbers in brackets); the 7th column gives details on phytosanitary treatments, and the last column describes the soil tillage type. Livestock breeds are Holstein Friesian for dairy cows and Belgian Blue for lactating cows. *Fertilizer and phytosanitary treatments are described for parcels of wheat only. Sampl. year Parcels Surface (ha) Crops Livestock Fertilizer* Phytosanitary treatment* Soil tillage type Tot. Crop Grass. Type Frequ. Type and Frequ. Location A: CFS 1-3 neighbors of AFS 1 CFS1 2015–2017 2 60 45 15 corn, wheat, potatoes, temporary grasslands 100 lactating cows TMS, mineral nitrogen 1 fungicide + herbicide reduced tillage, ploughing on exceptions CFS2 2 110 64 46 corn, wheat, beetroot, alfalfa 100 dairy cows, 60 lactating cows Urea 3 growth regulator + fungicide (2) + herbicide ploughing or reduced tillage CFS3 5 100 98.5 1.5 corn, wheat, beetroot, potatoes, peas, beans, carrots, parsnips 10 lactating cows Mineral nitrogen 3 or 4 growth regulator (2) + fungicide (2) + herbicides (2) + insecticide reduced tillage Location B: CFS 4-7 neighbors of AFS 2 CFS4 2015–2016 2 125 103 22 corn, wheat, beetroot, potatoes, barley, beans, chicory 100 dairy cows Mineral nitrogen NA growth regulator (2) + fungicide +herbicide ploughing or reduced tillage CFS5 1 55 35 20 corn, wheat, beetroot, alfalfa, barley 100 dairy cows (Montbéliarde) TMF, Mineral nitrogen, Magnesium + Sulfur (Epsotop) 6 growth regulator (3) + fungicide (2)+ herbicide ploughing 25–30 cm CFS6 2 100 75 25 corn, wheat, beetroot 60 dairy cows, 2500 porks Mineral nitrogen NA growth regulator + fungicide (2) + insecticide + herbicide ploughing 25–30 cm CFS7 3 67 50 17 corn, wheat, beetroot, potatoes 145 lactating cows Mineral nitrogen 1 growth regulator + fungicide (2) + herbicide reduced tillage Location C: CFS8-13 neighbors of AFS 3 CFS8 2016–2017 1 35 23 12 corn, wheat, beetroot 30 lactating cows Mineral nitrogen 2 growth regulator (1-2) + fungicide (2) + herbicide ploughing 25–30 cm CFS9 1 42 30 12 corn, wheat, beetroot, clover, alfalfa 80 lactating cows (Montbéliarde) Mineral nitrogen 3 growth regulator + fungicide (2) ploughing or reduced tillage CFS10 1 60 45 15 corn, wheat, beetroot, clover, alfalfa, potatoes, beans 60 lactating cows Mineral nitrogen NA fungicide (0-2) + herbicide ploughing 25–30 cm CFS11 1 65 55 10 corn, wheat, beetroot 35 lactating cows Mineral nitrogen 3 growth regulator + fungicide (2) + insecticide + herbicide ploughing 25–30 cm CFS12 1 90 75 15 corn, wheat, beetroot, potatoes 40 dairy cow Mineral nitrogen 3 growth regulation, fungicide (1-2), herbicide (1-2) reduced tillage CFS13 2 65 45 20 corn, wheat, beetroot 85 dairy cow, 60 lactating cows Mineral nitrogen 3 growth regulator + fungicide (2) + herbicide ploughing or reduced tillage
Fig. 1. Maps of the study sites. Map of Belgium indicating the position (red) of the three study locations and maps of each location (A, B, C). In brackets are the sampling years for each location. (For interpretation of the references to colour in this figure legend, the reader is referred to the Web version of this article.)
Fig. 2. Framework depicting indicators (black) used to portray ES delivery (grey). Indicators of ES de-livery are either indicator of ecosystem state or of ecological functions and processes, thus re-presenting the ecosystem capacity to delivery ES. Only the indicators fodder quantity and quality as-sess the actual delivery of the ES fodder production directly. OM = Organic Matter, ES = Ecosystem services.
through a reaction with potassium chloride (0.1 mol/L) in accordance with the ISO 14256-1 norm. Nitrate levels (kg NO3-/ha) from the three depths were added up and values were inverted for analyses to allow interpretation in terms of service and not dis-service.
2.4.4. Soil fertility
Soil fertility is a complex function which largely depends on sinks and sources of nutrients controlled by microbial and physico-chemical reactions that govern mineral weathering and organic matter decom-positions.
2.4.4.1. Soil organic matter degradation rate. Microorganism activity controlling mineralization of organic matter was assessed by means of the bait-lamina test (Kratz, 1998;Römbke, 2014). Sticks were bought from Terra Protecta GmbH, and consist of 16 cm long PVC strips with 16 × 2 mm holes filled with cellulose, bran flakes and active coal to mimic the materials degraded by soil fauna. Nine sticks were buried vertically in the ground, reaching the first 15 cm of the topsoil layer. Extra control sticks were buried and checked every two days. Sticks were collected 10–15 days later when around 50% of the control sticks had been degraded. The degradation of the bait material is associated to the feeding activity of soil invertebrates. Soil microorganisms and invertebrates consume the ‘bait,’ and the number of holes that are empty gives a relative measurement of the percentage of N mineralization (Knacker et al., 2003; Porter et al., 2009; Ghaley et al., 2014).
2.4.4.2. Soil microbioal activity: soil respiration. From the soil composites collected for the physico-chemical soil properties, 40 g of dry soil was placed into hermetically sealed jars together with a solution of NaOH (0.5 M) held in a separate open container. Samples were then incubated in the dark for four months and the electrical conductivity of NaOH was measured three times a week with a conductimeter (HACH sensION™ + EC71). Measurements were also performed for five jars without soil to serve as a control. Electrical conductivity values of NaOH samples were used to estimate the mass of emitted CO2with the following formula (Rodella and Saboya, 1999; Critter et al., 2004): = m V NaOH CE CE CE CE CE Wd [ ] 22 ( ) 100 ( )
CO NaOH NaOH x control
NaOH Na CO
2
2 3
wheremCO2is the mass of emitted CO2per 100 g of dry soil C (mgCO2/ 100 g dry soil), VNaOHis the volume of the NaOH solution placed in the jar, NaOH[ ]its concentration, 22 the molar mass of CO2, CENaOHthe electrical conductivity of a standard NaOH solution, CExthe electrical
conductivity of the NaOH sample,CEcontrolthe electrical conductivity of NaOH in control jars b, CENa CO2 3 the electrical conductivity of a standard Na2CO3 solutions and Wd is the dry weight of the soil sample (g).
2.4.4.3. Nutrient content. Soil concentrations of the four main available nutrients for plant growth (P, Mg, Ca and K) were calculated as part of the characterization of the soil physico-chemical parameters, along with pH and organic matter. These were then standardized and added up to provide one soil fertility indicator, as suggested byPankaj et al. (2011) (without taking into account aluminium concentration, because deemed irrelevant in our agricultural context characterized by soil pH > 5). 2.4.5. Pest control
Pest abundance (here aphid) was assessed through the measurement of two biological control processes: parasitism and predation. 2.4.5.1. Parasitism rate and aphid abundance. Juvenile and adult aphids (winged and not winged) and their mummies (parasitized aphids) were counted on twenty randomly selected plants per parcel. Counting was performed at the aphid's peak-season, occurring mid-June. No aphids were found in 2016 likely due to a rainy season. Average aphid abundances per plant were then inverted for analyses to allow interpretation in terms of service and not dis-service. The parasitism rate was calculated as the ratio between parasitized aphids and the total number of aphids (Roschewitz et al., 2005;Balzan and Moonen, 2014). 2.4.5.2. Predation rate. Live aphids, Sitobion avenae, were bought from KatzBiotech AG and glued to 5 × 3 cm sandpaper cards with odorless solvent-free glue. Three aphids were glued per card and ten cards were placed per parcel along a transect through the longest diagonal of the parcel with a minimum distance of 10 m between each other and 25 m from borders. Cards were collected after 24 h and remaining aphids were counted. Predation rate was calculated as the ratio between aphids eaten and the total number of aphids at the start of the experiment (Östman et al., 2001;Geiger et al., 2010).
2.4.6. Flood control
Soil hydraulic conductivity was measured on soil sampled in 53 × 50 mm stainless steel rings. Three samples per parcel were col-lected at the end of October, when flood risks were high due to low crop cover and regular rain. Samples were first saturated with water then placed in a permeameter (Eijkelkamp 09.02.01.05), a laboratory tool that creates a difference in water pressure on both ends of the sample to induce water flow through the sample and ends in a millimeter burette. Table 3
Measurement method for each indicator to assess the seven selected ecosystem services.
ECOSYSTEM SERVICE INDICATOR ASSESSMENT METHOD WITHIN PARCELS REPLICATION
Soil erosion control Soil aggregate stability (0-5 class) Wet sieving 9 soil aggregates
Water pollution control Potentially leaching Nitrogen (Kg
N-NO3/ha)
NO3- extraction with KCl (norm ISO 14256-1) 1 composite of 10 soil sampling
points
Soil fertility Soil organic matter degradation rate
(%) Bait Lamina test 9 sticks
Soil respiration rate (mgCO2/g of dry
soil) Conductimetric determination of CO2 3 soil composites of 6 samplingpoints
Sum of nutrients (g/kg) Specific extraction followed by atomic absorption spectroscopy/
spectrophotometry 3 soil composites of 6 samplingpoints
Pest control Parasitism rate (%) Aphids and mummies counting 20 plants
Average aphid abundance per plant Aphid counting 20 plants
Predation rate (%) Predation aphid cards 10 predation cards, 3 aphids per card
Flood control Soil permeability (cm/day) Permeameter 3 soil ring samples
Fodder production Straw yield (kg/m2) Dry weighting 4*1m2
Grain yield (kg/4m2) Dry weighting 4*1m2
Fodder quality Protein content (%) Infrared quality analyses 4*1m2
VEM (VEM/kg) Infrared quality analyses 4*1m2
Hydraulic conductivity K-factor (cm/day) was determined with the formula of the constant head method (Regalado and Muñoz-Carpena, 2004;Strudley et al., 2008;Nijp et al., 2017):
=
K V L
A t h . . .
where V is the volume of water flowing through the sample (cm3), L is the length of the soil sample (cm), A the cross-section surface of the sample (cm2), t the time used for flow through a water volume V (day) and h is the calculated water level difference inside and outside the sample cylinder.
2.4.7. Fodder production
Whole plant cereals were sampled on four quadrats of 1 m2 per parcel to assess aboveground biomass dry matter. Plants were sub-divided into grains and straw, dried (60 °C for 10 days) and weighed. The final yield of grain is expressed in t/ha at 15% humidity, and yield of straw as t/ha dry weight. The assessment of crop production for AFS parcels includes all the plants of the intercropping mix (triticale, oats, rye, spelt, pea and vetch).
2.4.8. Fodder quality
Protein and starch content (%) were assessed with the near-infrared reflectance spectroscopy technique (Rapid Content Analyzer, XM-1100 Series). The fodder quality index ‘VEM’ was used as an indicator for the energy supply of the cereal in a context of milk production. VEM is the commonly used indicator for fodder quality in Belgium (European Grassland Federation et al., 2008).
2.5. Statistical analysis
Two distinct types of analyses were carried out: (i) multivariate analyses to depict the correlation structure of the datasets, and (ii) univariate analyses with linear mixed models to test whether the farming system affects the delivery of each ES separately. Analyses were performed in R software, version 3.3.2 (R Core Team, 2016). Normality was checked and, when necessary, log- or square-based transformations were applied to meet the normality assumption.
(i) To explore the potential correlation between soil physico-chemical parameters and system type, we performed a principal component analysis (PCA) followed by a constrained ordination with a re-dundancy analysis (RDA) (Section3.1). A second set of PCA and RDA was applied to each location depicting the correlations be-tween ES and system type (Section3.2). Then, the percentage of the variation of ES delivery explained by system type, soil parameters and spatial coordinates (to test spatial auto-correlation) was as-sessed using the function ‘varpart’. To test the correlation of each of these parameters to the ES dataset, we constrained the ES dataset by each of these parameters (Section 3.3). Analysis of variance (ANOVA) on each RDA quantifies the tested relationship by means of F tests (<0.05). Only soil parameters significantly correlated to ES and which were not used for the ‘soil fertility 3’ indicator were kept for analysis. Multivariate analyses were performed using the package ‘vegan’ (Oksanen, 2018).
(ii) Linear mixed models were applied using the package ‘lme4’ (Bates and Maechler, 2018) (Section3.4). The farming system (AFS and CFS) was analyzed as a fixed effect, while the year, the location and the parcel pairs were analyzed as random effects. Pairs were nested within location and year, since pairs of parcels changed across lo-cations and years. For each indicator, the model was constructed from the experimental variables listed above, adding interaction(s) when they significantly changed the model. This was tested by means of a Chi-square test (<0.05) using the ‘anova’ function of the ‘lme4’ package. The effect of the farming system on ES delivery was tested using an F test (<0.05) on the constructed model using the
package ‘car’ (Fox et al., 2018). 3. Results
This section first presents the correlation structure of the soil parameters in order to verify the correlation between soil parameters and system type (3.1). It then presents the distinction between AFS and CFS, illustrated by means of PCA (3.2). Next, the correlation structure is depicted between ES, the system type, soil parameters and spatial data (3.3). Finally, results of the linear mixed models depict whether each ES is delivered significantly differently in AFS and CFS (3.3). Descriptive statistics with the mean, standard deviation and median of each in-dicator are provided in the supplementary material.
3.1. Parcel distribution along soil data
Fig. 3shows the PCA biplot of the soil parameters of all parcels sampled throughout the three years of sampling. Within the soil meters dataset, soil physico-chemical parameters (excluding soil para-meters used to determine the indicator ‘soil fertility 3’: P, Mg, Ca and K) and soil texture parameters are included. The first two principal com-ponents cover 90.4% of the variability of the dataset. No clear dis-tinction can be made between system types, but a disdis-tinction can be made between location A on the loamy sand and locations B and C on the sandy loam. Constraining this soil dataset by system types by means of RDA shows that soil parameters are not significantly correlated to system types (F = 1.0443, P = .316).
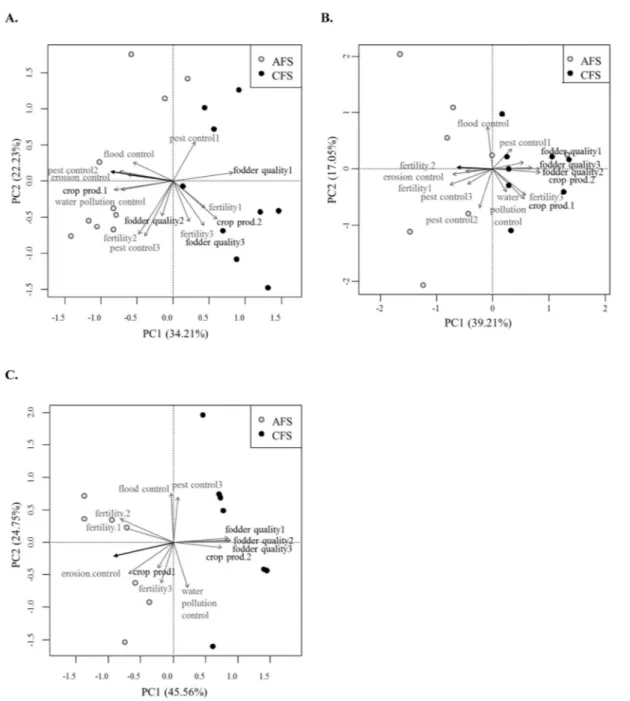
3.2. Correlation structure between ecosystem services and system types Fig. 4represents the PCAs carried out per location (A, B and C), therefore integrating two years of measurements. The first two prin-cipal components of the PCA explain 56.44%, 56.26% and 70.31% of the variance for location A, B and C, respectively.
PCAs, without being constrained, distinguish between the two types of farming systems by their first principal component, which explains 34.21%, 39.21%, 45.56% of the variance respectively. This is con-firmed by the ANOVA performed on the RDA showing a significant influence of the system type (P = .001, .002, 0.002 for locations A, B, C, respectively –Table 2).
The contribution of each variable to the first axis reveals details of this main trend (Fig. 4). AFS tended to show higher regulating ES (grey inFig. 4), while CFS present higher provision ES (black inFig. 4). Two exceptions are noted: the AFS of location A performs better in terms of straw production (crop prod 1), and CFS of location B have a larger amount of soil nutrients (fertility 3). Besides this, in all locations, AFS show higher erosion control and soil respiration rates (fertility 2), while CFS always give greater grain production (crop prod 2) and protein content (fodder quality 1). In addition to these common trends, in lo-cation A the AFS also provide more flood protection, fewer aphids (pest control 2) and higher protection against water pollution. In location B the AFS also provide higher degradation of organic matter (soil fertility 1), and CFS have higher straw production (crop prod.1), starch content (fodder quality 3) and VEM indices (fodder quality 2). In location C the AFS also provide more organic matter degradation (fertility 1), while CFS perform better in starch content (fodder quality 3) and VEM indices (fodder quality 2).
The first principal component thus opposes system types in terms of provision and regulating services, illustrating a clear pattern of trade-offs in ES delivery. Grain production (crop prod 2) and protein content (fodder quality 1) are always negatively correlated to the regulating ES erosion control and soil respiration rates (fertility 2), and in location B and C, also to organic matter degradation rate (fertility 1).
3.3. Correlation of ecosystem services with system type, soil parameters and spatial coordinates
RDA constraining the ES dataset with the system types shows sig-nificant correlations within the three locations. RDA constraining ES with soil parameters shows significant correlation for locations A and C. On the other hand, RDA constraining by the spatial coordinates do not show significant correlation, indicating that there is no spatial auto-correlation in the ES dataset. Proportions of the variance explained by each of these tested variables, i.e., the system type, soil parameters and spatial coordinates, are summarized inTable 4.
3.4. Effects of system types on each ecosystem service
F tests on the mixed linear models of each indicator illustrate where ES delivery is significantly different between system types (Table 5). Soil aggregate stability and soil respiration rates are in general more supported in AFS (F = 18.3, P = .043; F = 74.5, P < .001) which also show lower aphid abundance (F = 25.8, P < .001). On the other hand, CFS show higher grain production (F = 141.60, P < .001) and higher performance for fodder in two out of three quality indices: protein content and VEM (F = 125, P < .001; F = 11.2, P < .01).
4. Discussion
This section first discusses the hypothesis that AFS offer greater ES synergies in the light of our results. We next delineate the limitations of the present work to offer transparency on the research process. We then conclude with perspectives for future work and recommendations based on our lessons learned and with regard to the limitations depicted. 4.1. The potential of AFS to deliver ES synergies
Our study shows that AFS tend to perform better in providing
regulating ES, while CFS deliver greater amounts of provisioning ES, a result depicted by both uni- and multi-variate analyses. The PCA of the three locations all showed the same pattern, with the first principal component representing most of the variance and distinguishing be-tween farming system types. Interestingly, these differences persist across the three different locations studied (including location A on a distinct soil type), replications along the three sampling years and the different technical histories of the parcels. Although soil parameters may explain a considerable share of the variance in the ES dataset (Section3.3), soil parameters are not significantly correlated to system types (Section3.1). Hence, we can confidently conclude that, over the studied time period and according to the chosen indicators, our studied AFS have a clear impact on the delivery of ES, favoring regulating services, while the studied CFS still outperform for provisioning ES.
As cereal crops have been shown to have the greatest yield differ-ence of all crop types between organic and conventional systems (Ponisio et al., 2015), our results are likely to depict a maximum yield difference between AFS and CFS. Moreover, the three studied AFS are still evolving, constantly adapting, and do not represent 100% mature systems. It is possible that with time, adaptive management can help to bridge this yield gap (Hodbod et al., 2016).
Yield and provisioning ES in general have always been the focus of agricultural work and research (Ponisio et al., 2015; Gordon et al., 2017). However, taking yield as the only measure of success is no longer pertinent as high yields come at the cost of destroying ecological processes, which in turn impact crop growth and productivity. We concur with colleagues arguing that yield is only one factor among many others that determine the management's performance (Rapidel et al., 2015;Ponisio and Kremen, 2016). The studied AFS are viable economically, and thanks to the lower amount of work required in the field (no spraying, less tillage, etc.), they ‘unlock time for extra financial activities such as making transformed products, organizing school visits, etc.’ (AFS farmer's personal comment).
Examples of agricultural practices that successfully achieve Fig. 3. Principal component analysis (PCA) of the soil physico-chemical parameters measured in the two systems (AFS and CFS) and at the three locations (A, B and C). Soil parameters are represented as arrows. Parcels are represented according to the system to which they belong (white: AFS (agroecological farming systems), black: CFS (conventional farming systems)) and the location (A: circle, B: square, C: triangle).
synergies between regulating and provisioning ES exist.Robertson et al. (2014)report from 25 years of experimentation and observation of no-till, reduced input and organic systems which provide high yields and water pollution control, pest control and biodiversity support. Litera-ture reviews fromGarbach et al. (2017)andKremen and Miles (2012) both conclude that it is possible to design multi-performant systems that are equally productive and that maintain or enhance other ES.
Despite these encouraging examples, we should acknowledge that it may not be possible to always achieve high levels of ES delivery ev-erywhere. Recent work corroborates our findings by identifying trade-offs between ES. Holt et al. (2016) show that pesticide mitigation measures may have serious impacts on food production, despite en-hancement of other ES.Polasky et al. (2011)identify that the scenario which maximizes the highest private returns has the lowest net social
benefit. Together with these findings, our results illustrate the im-portance of taking ES bundles into account in land use decisions. Land-management decisions should identify potential synergies and tradeoffs across the landscape and adapt accordingly.
As agroecology is about adapting practices to the environment, prior analysis of the potential of ES delivery and synergies is a crucial preliminary step to any farm-management decisions. Due to the con-text-specificity of agroecology, and because systems are in different evolving states of their transition, it is therefore not surprising that research reports distinct outcomes in terms of performance and ES delivery. AFS are hardly comparable: while in some locations AFS may be able to provide ES synergies, AFS at different locations may present tradeoffs that require compromises in the design of agroecological farming practices (Polasky et al., 2011;Holt et al., 2016).
Fig. 4. Principal correlation analysis (PCA) of the ecosystem services (ES) measured in locations A, B and C. ES are represented as arrows (grey and black text for regulating and provisioning, respectively) pointing towards the parcels (white and black dots for AFS (agroecological farming systems) and CFS (conventional farming systems), respectively) where they reach their maximum value. The angle between the arrows is a measure of the correlation between ES, i.e., correlated ES have arrows pointing in the same direction; negatively correlated ES have arrows pointing in opposite directions; uncorrelated ES have arrows in perpendicular positions. The black arrow depicts the system variable, allowing interpretation between the ES and farming system type.
4.2. Limitations of the study
Some of the characteristics of the present study also lead to some limitations to bear in mind. The limited geographical scope hampers the extrapolation of our results to other farming systems and other regions. The three studied AFS are not comparable to standard farming systems in Belgium. These represent ‘niche examples’. Studying real-life ex-amples, as in the present research, has the advantage of providing in-formation on systems which have adapted to their socio-environment (Drinkwater, 2002). As agroecology is about adapting to its socio-eco-logical context, it is likely that what works at one place may not work somewhere else (Holt et al., 2016). Hence, local scale ES assessments of agroecosystem multi-performance are believed to be more relevant, to provide context-specific practical guidelines (Polasky et al., 2011; Landis, 2017).
Experimenting on real-farms has the advantage of depicting real
conditions, but faces the challenge of harboring many uncontrolled parameters, such as environmental factors and historical itineraries of studied parcels. To decrease the potential of these factors to bias ES measurements, the sampling strategy is hierarchized, with several CFS for each AFS, and parcels compared within similar soil types. As the relative variance across system types is greater than within, we can confidently affirm that the impact of AFS is greater than the impact of uncontrolled parameters.
Such system-based approach also hampers the distinction between the different agricultural practices (organic, no till, intercropping, green infrastructures) implemented by the studied AFS. It remains unclear whether the outcomes of the present work are due to one specific practice or to the agroecological combination of these practices. For instance, the lower abundance of aphids in AFS may be due to the in-tercropping practice, as attested by the literature (known as ‘the re-source concentration hypothesis’ (Lopes et al., 2016) more than to the Table 4
Summary of proportion (%) of variance (var.) explained by the system type (syst), soil parameters and spatial coordinates (coord). P-values of the F tests (P) on the correlation of these datasets with the ecosystem services (ES) dataset for each location (A, B and C). The last four columns depict the % of variance explained by the interactions between variables.
System(AFS - CFS) Soil Coordinates syst x soil syst x coord. coord.x soil syst x soil x coord.
var. (%) P var. (%) P var. (%) P var. (%) var. (%) var. (%) var. (%)
A 27.9 <.001*** 27.9 0.0111 * 8.3 0.289 21.4 0 6.5 0
B 27.1 0.002 ** 18.3 0.124 20.5 0.125 0 0 0 7
C 41.4 <.001*** 44.4 0.0076 ** 31.2 0.5 27.3 14.1 17.1 0
Table 5
Summary table of the F tests (column 3) applied to each indicator model and its resulting P value (column 4). Column 5 depicts whether AFS (agroecological farming systems) performed higher (>) or lower (<) than CFS (conventional farming systems), with the amount of ‘>’ symbols illustrating the power of the levels of significance, dark grey illustrating cases where AFS perform significantly lower than CFS and light grey when AFS perform significantly higher than CFS.
ECOSYSTEM SERVICE
INDICATOR
F
P
Outcomes
Erosion control
Soil aggregate stability (0-5 class)
18.3
0.0433
AFS > CFS
Water pollution control
Potentially leaching Nitrogen (Kg N-NO
3/ha)
1.34
0.258
AFS = CFS
Fertility 1
Soil organic matter degradation rate (%)
1.9
0.302
AFS = CFS
Fertility 2
Soil respiration rate (mgCO
2/g)
74.5
<.001
AFS>>>CFS
Fertility 3
Sum of nutrients (g/kg)
0.004
0.9489
AFS = CFS
Pest control 1
Parasitism rate (%)
0.302
0.592
AFS = CFS
Pest control 2
Average aphid abundance per plant
25.8
<.001
AFS>>>CFS
Pest control 3
Predation rate (%)
0.12
0.731
AFS = CFS
Flood control
Soil permeability (cm/day)
0.552
0.459
AFS = CFS
Crop production 1
Straw yield (kg/m
2)
0.01
0.93
AFS = CFS
Crop production 2
Grain yield (kg/4m
2)
141
<.001
AFS<<<CFS
Fodder quality 1
Protein content (%)
125
<.001
AFS<<<CFS
Fodder quality 2
VEM (VEM/kg)
11.2
<.01
AFS<<CFS
AFS itself.
The short time frame of our assessment and the ‘snapshot’ approach (i.e., measurements are taken only once a year, along three years) also calls for caution in the interpretation of our results. Previous work has highlighted how ecological processes can respond differently in the short and in the long term, following non-linear trends (Knapp et al., 2012; Landis, 2017). Hence, some variations may have been missed within the present work. Our snapshot approach proves useful in highlighting trends in ES delivery between AFS and CFS. However, long term repetition would be required to develop a thorough understanding of the opportunities and consequences of agroecological transitions and to deliver management guidelines.
The choice of ES, indicators and measurement methods of course influences the outcomes of the research. We have attempted to be as transparent as possible in the process by involving stakeholders in ES prioritization and by relying on multiple indicators per ES. Our in-dicators mostly only provide indirect information about the actual de-livery of ES, and rather relate the ecosystem's capacity to provide ES (Fig. 2).
4.3. Perspectives and recommendations
Our work suggests that having several indicators per service may provide a more nuanced estimation of the ES actual delivery. For in-stance, pest control seems to be higher in AFS when looking at aphid abundance, although this would not have been suggested if we were to rely on parasitism or predation estimations alone, as done in earlier ES assessments (e.g.Porter et al., 2009;Sandhu et al., 2010). The same applies to our estimation of soil fertility, where the soil organic matter degradation rate and the amount of available nutrients did not show any significant difference between system types, while respiration rates were significantly different. This is even more concerning when com-paring degradation with respiration as these rely on the same ecological processes: the microbial activity. The different outcome is likely due to degradation being assessed in situ, thus constrained by weather and other environmental limitations, and respiration being assessed ex situ with controlled parameters. Hence, we concur withMeyer et al. (2015) and advocate that ES assessments should span a range of functions per service to represent the overall functioning and lower the risk of methodological bias. When possible, in situ measurements should be preferred as these represent a more direct measurement of the ES de-livery, while ex situ measurements are more likely to reflect the po-tential capacity of the ecosystem to provide the assessed process, function or service.
In addition to the choice of indicators, the ES tool itself also frames the prism of analysis. Despite offering a multidimensional analytical tool, the ES tool does not, and could not, cover all aspects. In terms of system multi-performance, the ES ‘yield’ should not only be combined to other ES, but also to indicators such as the economic gross margin, the workload required etc., which are indicators that directly influence the decision making of farmers. Within intercropping systems, yield indicators should be replaced by the ‘Land Equivalent Ratio’ (Mead and Willey, 1980), whose calculation was impossible to implement within the present study due to a lack of data on each species' yield.
While the present research offers a first snapshot of the potential of AFS to deliver ES synergies, further research is required to better un-derstand the underlying relationships between practices, ecological processes and functions and ES flows. To this end, research would benefit from closer collaboration between multidisciplinary and dis-ciplinary studies.
As suggested byDendoncker et al. (2018), to steer agroecological transition the assessment of supply and demand of ES must be em-bedded within a wider framework, which also includes the identifica-tion of plausible evoluidentifica-tions of the system, the selecidentifica-tion of the most acceptable pathways of change and the implementation of the selected scenario. This whole process should itself be iterative as ES follow
non-linear responses and as stakeholder needs and perceptions may vary over time (Dendoncker et al., 2018). Such an iterative approach would strengthen the currently limited timeframe of our study. We thus en-courage further research to carry out long term and iterative mon-itoring of agricultural transitions.
5. Conclusion
This paper builds on the emerging paradigm arguing to assess multi-performance of agroecosystems. The present work provides the novelty of assessing simultaneously multiple stakeholder-relevant ES and their interactions in real-life AFS. It answers the call for system-based as-sessments of agroecological transitions to provide knowledge adapted to a specific socio-ecological context.
Our studied AFS do not (yet) perform as well as CFS in terms of provisioning ES. However, by analyzing the multi-performance of these AFS, we show that they meet higher regulating ES delivery. While there is a consensus on the necessity to conciliate agricultural production with ecological functions, too little evidence exists to support the design of concrete guidelines on agricultural management. To do so, we en-courage further research to iterate the work initiated by this study, relying on multiple indicators for each ES, and to embed it in a stake-holder-inclusive approach, offering farmers a science-practice partner-ship that enables co-generation of solutions. As it is likely that what works in one place may not work elsewhere, such research ought to be site-specific to provide context-specific solutions. We believe that such systematic analysis of the socio-agroecosystem will be a great con-tribution to the pressing need to reconcile environmental functioning and agricultural production. In a world where many planetary bound-aries have been crossed, such reconciliation is more urgent than ever. Declarations of interest
None.
Acknowledgments
We thank the National Fund for Scientific Research (FNRS) for providing a Ph.D. scholarship to Fanny Boeraeve and a Research Credit to finance the research project "Farms For Future" awarded to Prof. Marc Dufrêne. We thank numerous colleagues from distinct depart-ments who have supported us with their expertise in the choice of as-sessment methodologies, the sharing of specific tools and devices and the interpretation of results: Prof. Frédéric Francis, Prof. Gilles Colinet, Prof. Bernard Bodson, Prof. Aurore Degrée, Prof. Sarah Garré and Prof. Yves Beckers. We specifically thank our colleagues Xavier Legrain for his soil expertise and Yves Brostaux for his statistical expertise. We also thank the farmers for giving us access to their land and for their col-laboration. At last, we thank the reviewers and the editor for their in-sightful comments and recommendations.
Appendix B. Supplementary data
Supplementary data to this article can be found online athttps:// doi.org/10.1016/j.jenvman.2019.109576.
References
Andersson, E., Nykvist, B., Malinga, R., Jaramillo, F., Lindborg, R., 2015. A social–eco-logical analysis of ecosystem services in two different farming systems. Ambio 44 (S1), 102–112.
Balzan, M.V., Moonen, A.-C., 2014. Field margin vegetation enhances biological control and crop damage suppression from multiple pests in organic tomato fields. Entomol. Exp. Appl. 150 (1), 45–65.
Barral, M.P., Rey Benayas, J.M., Meli, P., Maceira, N.O., 2015. Quantifying the impacts of ecological restoration on biodiversity and ecosystem services in agroecosystems: a global meta-analysis. Agric. Ecosyst. Environ. 202, 223–231.
“Eigen” and S4. CRAN.
Bock, L., Legrain, X., Veron, P., Bracke, C., Bah, B., Lejeune, P., 2008. Carte Numérique des Sols de Wallonie – version 1.2. Gembloux Agro-Bio Tech - PCNSW.
Boeraeve, F., Dufrene, M., De Vreese, R., Jacobs, S., Pipart, N., Turkelboom, F., Verheyden, W., Dendoncker, N., 2018. Participatory identification and selection of ecosystem services: building on field experiences. Ecol. Soc. 23 (2), 27. Bommarco, R., Kleijn, D., Potts, S.G., 2013. Ecological intensification: harnessing
eco-system services for food security. Trends Ecol. Evol. 28 (4), 230–238.
Critter, S.A.M., Freitas, S.S., Airoldi, C., 2004. Comparison of microbial activity in some Brazilian soils by microcalorimetric and respirometric methods. Thermochim. Acta 410 (1–2), 35–46.
Dale, V.H., Polasky, S., 2007. Measures of the effects of agricultural practices on eco-system services. Ecol. Econ. 64 (2), 286–296.
Delcour, A., Van Stappen, F., Gheysens, S., Decruyenaere, V., Stilmant, D., Burny, P., Rabier, F., Louppe, H., Goffart, J.-P., 2014. Etat des lieux des flux céréaliers en Wallonie selon différentes filières d’utilisation. Biotechnologie, Agronomie, Société et Environnement 18 (2), 181–192.
Dendoncker, N., Boeraeve, F., Crouzat, E., Dufrêne, M., König, A., Barnaud, C., 2018. How can integrated valuation of ecosystem services help understanding and steering agroecological transitions? Ecol. Soc. 23 (1), 12.
Drinkwater, L.E., 2002. Cropping systems rsearch: reconsidering agricultural experi-mental approaches. HortTechnology 355–361.
Duru, M., Therond, O., Martin, G., Martin-Clouaire, R., Magne, M.-A., Justes, E., Journet, E.-P., Aubertot, J.-N., Savary, S., Bergez, J.-E., Sarthou, J.P., 2015. How to Implement Biodiversity-Based Agriculture to Enhance Ecosystem Services: a Review. Agronomy for Sustainable Development.
European Grassland Federation, Hopkins, A., 2008. European grassland federation, and sveriges lantbruksuniversitet. In: Biodiversity and Animal Feed: Future Challenges for Grassland Production: Proceedings of the 22nd General Meeting of the European Grassland Federation, Uppsala, Sweden, 9-12 June 2008. Organizing Committee of the 22nd General Meeting of the European Grassland Federation. Swedish University of Agricultural Sciences (SLU), Uppsala.
Fox, J., Weisberg, S., Price, B., 2018. Package “Car”: Companion to Applied Regression. CRAN.
Francis, C., Lieblein, G., Gliessman, S., Breland, T.A., Creamer, N., Harwood, R., Salomonsson, L., Helenius, J., Rickerl, D., Salvador, R., 2003. Agroecology: the ecology of food systems. J. Sustain. Agric. 22 (3), 99–118.
Garbach, K., Milder, J.C., DeClerck, F.A.J., Montenegro de Wit, M., Driscoll, L., Gemmill-Herren, B., 2017. Examining multi-functionality for crop yield and ecosystem services in five systems of agroecological intensification. Int. J. Agric. Sustain. 15 (1), 11–28. Geiger, F., Bengtsson, J., Berendse, F., Weisser, W.W., Emmerson, M., Morales, M.B.,
Ceryngier, P., Liira, J., Tscharntke, T., Winqvist, C., Eggers, S., Bommarco, R., Pärt, T., Bretagnolle, V., Plantegenest, M., Clement, L.W., Dennis, C., Palmer, C., Oñate, J.J., Guerrero, I., Hawro, V., Aavik, T., Thies, C., Flohre, A., Hänke, S., Fischer, C., Goedhart, P.W., Inchausti, P., 2010. Persistent negative effects of pesticides on bio-diversity and biological control potential on European farmland. Basic Appl. Ecol. 11 (2), 97–105.
Ghaley, B.B., Porter, J.R., Sandhu, H.S., 2014. Soil-based ecosystem services: a synthesis of nutrient cycling and carbon sequestration assessment methods. International Journal of Biodiversity Science, Ecosystem Services & Management 10 (3), 177–186. Gordon, L.J., Bignet, V., Crona, B., Henriksson, P.J.G., Van Holt, T., Jonell, M., Lindahl, T., Troell, M., Barthel, S., Deutsch, L., Folke, C., Haider, L.J., Rockström, J., Queiroz, C., 2017. Rewiring food systems to enhance human health and biosphere steward-ship. Environ. Res. Lett. 12 (10), 100201.
Hatt, S., Artru, S., Brédart, D., Lassois, L., Francis, F., Haubruge, E., Garré, S., Stassart, P., Dufrêne, M., Monty, A., Boeraeve, F., 2016. Toward a sustainable development within agriculture: a review of what agroecology suggests. Biotechnologie, agro-nomie, société et environnement 20 (S1), 2015–2224.
Herrick, J.E., Whitford, W.G., de Soyza, A.G., Van Zee, J.W., Havstad, K.M., Seybold, C.A., Walton, M., 2001. Field soil aggregate stability kit for soil quality and rangeland health evaluations. Catena 44.
Hodbod, J., Barreteau, O., Allen, C., Magda, D., 2016. Managing adaptively for multi-functionality in agricultural systems. J. Environ. Manag. 183, 379–388.
Holt, A.R., Alix, A., Thompson, A., Maltby, L., 2016. Food production, ecosystem services and biodiversity: we can't have it all everywhere. Sci. Total Environ. 573, 1422–1429. Horlings, L.G., Marsden, T.K., 2011. Towards the real green revolution? Exploring the
conceptual dimensions of a new ecological modernisation of agriculture that could ‘feed the world. Glob. Environ. Chang. 21 (2), 441–452.
Knacker, T., Förster, B., Römbke, J., Frampton, G.K., 2003. Assessing the effects of plant protection products on organic matter breakdown in arable fields—litter decom-position test systems. Soil Biol. Biochem. 35 (10), 1269–1287.
Knapp, A.K., Smith, M.D., Hobbie, S.E., Collins, S.L., Fahey, T.J., Hansen, G.J.A., Landis, D.A., Pierre, L., K.J.,Melillo, J.M., Seastedt, T.R., Shaver, G.R., Webster, J.R., 2012. Past, present, and future roles of long-term experiments in the LTER network. Bioscience 62 (4), 377–389.
Kremen, C., Miles, A., 2012. Ecosystem services in biologically diversified versus con-ventional farming systems: benefits, externalities, and trade-offs. Ecol. Soc. 17 (4), 40.
Kratz, W., 1998. The bait-lamina test. Environ. Sci. Pollut. Res. 5 (2), 94–96. Kremen, C., Iles, A., Bacon, C., 2012. Diversified farming systems: an agroecological,
systems-based alternative to modern industrial agriculture. Ecol. Soc. 17 (4), 44. Kunde, L., Kõlves, K., Kelly, B., Reddy, P., De Leo, D., 2017. Pathways to suicide in
Australian farmers: a life chart analysis. Int. J. Environ. Res. Public Health 14 (4), 352.
Lakanen, E., Erviö, R., 1971. A Comparison of eight extractants for the determination of
plant available micronutrients in soils. Acta Agronomica Fennica 123, 223–232. Landis, D.A., 2017. Designing agricultural landscapes for biodiversity-based ecosystem
services. Basic Appl. Ecol. 18, 1–12.
Lerouge, F., Sannen, K., Gulinck, H., Vranken, L., 2016. Revisiting production and eco-system services on the farm scale for evaluating land use alternatives. Environ. Sci. Policy 57, 50–59.
Lopes, T., Hatt, S., Xu, Q., Chen, J., Liu, Y., Francis, F., 2016. Wheat ( Triticum aestivum L.)-based Intercropping Systems for Biological Pest Control: Wheat-Based Intercropping for Biological Control. Pest Management Science.
Maes, J., Paracchini, M.L., Zulian, G., Dunbar, M.B., Alkemade, R., 2012. Synergies and trade-offs between ecosystem service supply, biodiversity, and habitat conservation status in Europe. Biol. Conserv. 155, 1–12.
Malézieux, E., 2012. Designing cropping systems from nature. Agron. Sustain. Dev. 32 (1), 15–29.
Mead, R., Willey, R.W., 1980. The concept of a ‘land equivalent ratio’ and advantages in yields from intercropping. Exp. Agric. 16 (3), 217–228.
Méndez, V.E., Bacon, C.M., Cohen, R., 2013. Agroecology as a transdisciplinary, parti-cipatory, and action-oriented approach. Agroecology and Sustainable Food Systems 37, 3–18.
Meyer, S.T., Koch, C., Weisser, W.W., 2015. Towards a standardized Rapid ecosystem function assessment (REFA). Trends Ecol. Evol. 30 (7), 390–397.
Nijp, J., Metselaar, K., Limpens, J., Gooren, H., van der Zee, S., 2017. A modification of the constant-head permeameter to measure saturated hydraulic conductivity of highly permeable media. Methods 4, 134–142.
Oksanen, J., 2018. Package “Vegan” Community Ecology Package.
Östman, Ö., Ekbom, B., Bengtsson, J., 2001. Landscape heterogeneity and farming practice influence biological control. Basic Appl. Ecol. 2 (4), 365–371.
Pankaj, P., Sharmistha, P., Biplab, S., 2011. Soil fertility index, soil evaluation factor, and microbial indices under different land uses in acidic soil of humid subtropical India. Commun. Soil Sci. Plant Anal. (42), 2724–2737.
Polasky, S., Nelson, E., Pennington, D., Johnson, K.A., 2011. The impact of land-use change on ecosystem services, biodiversity and returns to landowners: a case study in the state of Minnesota. Environ. Resour. Econ. 48 (2), 219–242.
Ponisio, L.C., Kremen, C., 2016. System-level approach needed to evaluate the transition to more sustainable agriculture. Proc. R. Soc. Biol. Sci. 283 (1824), 20152913. Ponisio, L.C., M'Gonigle, L.K., Mace, K.C., Palomino, J., de Valpine, P., Kremen, C., 2015.
Diversification practices reduce organic to conventional yield gap. In: Proceedings Royal Society B, vol. 282.
Porter, J., Costanza, R., Sandhu, H., Sigsgaard, L., Wratten, S., 2009. The value of pro-ducing food, energy, and ecosystem services within an agro-ecosystem. AMBIO A J. Hum. Environ. 38 (4), 186–193.
R Core Team, 2016. R: A Language and Environment for Statistical Computing. R Foundation for Statistical Computing, Vienna, Austria.
Rapidel, B., Ripoche, A., Allinne, C., Metay, A., Deheuvels, O., Lamanda, N., Blazy, J.-M., Valdés-Gómez, H., Gary, C., 2015. Analysis of Ecosystem Services Trade-Offs to Design Agroecosystems with Perennial Crops. Agronomy for Sustainable Development.
Regalado, C.M., Muñoz-Carpena, R., 2004. Estimating the saturated hydraulic con-ductivity in a spatially variable soil with different permeameters: a stochastic Kozeny–Carman relation. Soil Tillage Res. 77 (2), 189–202.
Robertson, G.P., Gross, K.L., Hamilton, S.K., Landis, D.A., Schmidt, T.M., Snapp, S.S., Swinton, S.M., 2014. Farming for ecosystem services: an ecological approach to production agriculture. The Ecology of Agricultural Landscapes: Long-Term Research on the Path to Sustainability 33.
Rodella, A., Saboya, L., 1999. Calibration for conductimetric determination of carbon dioxide. Soil Biol. Biochem. 31 (14), 2059–2060.
Römbke, J., 2014. The feeding activity of invertebrates as a functional indicator in soil. Plant Soil 383 (1–2), 43–46.
Roschewitz, I., Hücker, M., Tscharntke, T., Thies, C., 2005. The influence of landscape context and farming practices on parasitism of cereal aphids. Agric. Ecosyst. Environ. 108 (3), 218–227.
Sandhu, H.S., Wratten, S.D., Cullen, R., 2010. The role of supporting ecosystem services in conventional and organic arable farmland. Ecol. Complex. 7 (3), 302–310. Seppelt, R., Dormann, C.F., Eppink, F.V., Lautenbach, S., Schmidt, S., 2011. A
quantita-tive review of ecosystem service studies: approaches, shortcomings and the road ahead. J. Appl. Ecol. 48 (3), 630–636.
Seybold, C.A., Herrick, J.E., 2001. Aggregate stability kit for soil quality assessments. Catena 44 (1), 37–45.
Stoate, C., Báldi, A., Beja, P., Boatman, N.D., Herzon, I., Van Doorn, A., De Snoo, G.R., Rakosy, L., Ramwell, C., 2009. Ecological impacts of early 21st century agricultural change in Europe–a review. J. Environ. Manag. 91 (1), 22–46.
Strudley, M., Green, T., Ascoughii, J., 2008. Tillage effects on soil hydraulic properties in space and time: state of the science. Soil Tillage Res. 99 (1), 4–48.
Syswerda, S.P., Robertson, G.P., 2014. Ecosystem services along a management gradient in Michigan (USA) cropping systems. Agric. Ecosyst. Environ. 189, 28–35. Tilman, D., Cassman, K.G., Matson, P.A., Naylor, R., Polasky, S., 2002. Agricultural
sus-tainability and intensive production practices. Nature 418 (6898), 671–677. Wezel, A., Bellon, S., Doré, T., Francis, C., Vallod, D., David, C., 2011. Agroecology as a
science, a movement and a practice. In: Lichtfouse, E., Hamelin, M., Navarrete, M., Debaeke, P. (Eds.), 27–43. Sustainable Agriculture Volume 2 Springer Netherlands. Wezel, A., Casagrande, M., Celette, F., Vian, J.-F., Ferrer, A., Peigné, J., 2013.
Agroecological Practices for Sustainable Agriculture. A Review. Agronomy for Sustainable Development.
Zhang, W., Ricketts, T.H., Kremen, C., Carney, K., Swinton, S.M., 2007. Ecosystem ser-vices and dis-serser-vices to agriculture. Ecol. Econ. 64 (2), 253–260.