Toward a Risk Based Simulation for the Erection
of an Offshore Windmill Park
Jean-David Caprace, ESPOL, Guayaquil/Ecuador, [email protected]
Cristian Petcu, ULG, Liège/Belgium, [email protected]
Marco Velarde, ESPOL, Guayaquil/Ecuador, [email protected]
Philippe Rigo, ULG, Liège/Belgium, [email protected]
Abstract
Nowadays, EU shipyards that are facing difficulties due to the global crisis are often trying to diversify their activities. Some of them have already turned to the production of offshore windmill components. The installation and operation of offshore windmills are much more complex than onshore due to the distance and the depth of the water column. This creates problems specific to the production, installation and maintenance of offshore wind turbines. A tool for sequencing and installation simulation has been developed to assess the risks associated to the assembly of wind turbines parks via simulations of the different phases of construction considering various random phenomena such as weather conditions and uncertainties on production time.
1. Introduction
Nowadays, EU shipyards that are facing difficulties due to the global crisis are trying to diversify their activities. Some of them have already turned to the production of components of windmills (jackets, tower sections, etc.). The wind power market is growing in order to reach the European requirements in terms of green energy which also strongly favors offshore wind turbines given the limited space available for onshore wind parks.
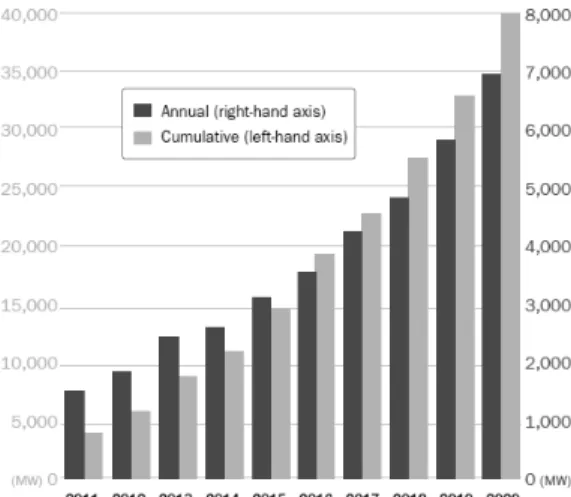
In December 2008 the European Union (EU) agreed on a binding target of 20% renewable energy by 2020. To meet this goal, the European Commission expects 34% of electricity to come from renewable energy sources. Wind market should contribute to 12% of EU electricity demand. And, with 40GW installed by 2020, offshore wind will supply 3.6% to 4.3% of the electricity production, Fig.1. The total annual installed offshore wind capacity should grow from 1.5 GW in 2011 to 6.9 GW in 2020. In terms of investments, this evolution represents an increase of €3.3 to €8.81 billion.
Fig. 1: Evolution of offshore wind energy annual and cumulative installations 2011-2020 (in MW) Source: EWEA
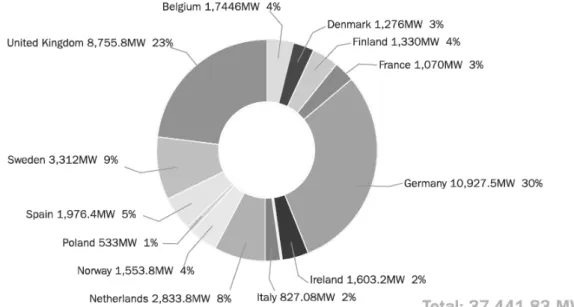
Germany and United Kingdom should dominate the offshore wind market accounting for, respectively, 30% and 23% of the total installed capacity in Europe, Fig.2. France, Italy, Spain, Poland and Norway will also enter the offshore wind market in near future.
Fig. 2: Distribution of total offshore wind capacity installed in Europe by 2020 (in MW) Source: EWEA
The installation and operation of offshore windmill is much more complex than onshore due to the distance, the depth of the seabed and marine activities. This creates problems specific to the production, installation and maintenance of offshore wind turbines.
A tool for production and installation simulation has been developed to meet the major problems encountered in the production of offshore wind turbines. The main objective of this tool is to assess the risks associated to the assembly of wind turbines via simulations of the different phases of construction considering all random phenomena such as the weather conditions and the uncertainties on production time. The advantages are that the software is able to simulate complex interactions between different actors (human and material resources, transportation, machinery, etc.). Thus, this production simulation can develop the best production strategy that minimizes the operational risks.
Different alternative procedures of the installation process can be modeled and evaluated. All the parameters of the installation process can be varied like the type of the installation vessel including its attributes or the strategies for supply or assembly. Many constraints and restrictions can be taken into consideration in the simulation model. In these special applications the weather influence is of major importance. The specificity of this model is to use real offshore weather data of the past 18 years. By evaluating different alternative scenarios the over-all installation process can be optimized with respect to shortest installation times and highest robustness of the schedule. The first results of this Discrete Event Simulation (DES) using real offshore weather data are presented and discussed in this paper.
2. Why a risk based simulation is required?
In order to explain the necessity of this type of software, we have to consider the aspects linked to logistics and to the production flow of the windmill assembly.
2.1 Different specific components
An offshore wind turbine is composed from different elements, which can be assembled either on dry land or at sea, Fig.3. These components are:
• The blades: the rotor blades for offshore wind turbines are made of composite material. Today’s wind blades are mainly made of reinforced fiber glass. For very large blades, carbon fibers have been introduced by many manufacturers in order to reduce the structure weight.
The size of the blades is increasing proportionally with the increase in the power of the wind turbine (the rotor has the weight of around 100 tons, for a 3 MW wind turbine).
• The nacelle: results from a combination between a steel lattice structure and fiber glass housing. The hydraulic, electrical and electro-mechanic internal components of the nacelle (gearbox, transformers, cooling systems, etc) are integrated progressively during the construction of the nacelle. One has to take into account the fact that the nacelle is very heavy (125 t for a 4 MW turbine). Together with the rotor, the weight of the nacelle gives big problems in terms of stability issues.
• The tower section: has the structural role of carrying the top loads to the foundation. It is made from steel sheet rings and stiffeners (longitudinal or circular, used for rigidity purposes). It is protected against the strong corrosion due to sea water.
• Wind turbine foundation, Fig.4: there are several types:
a. Mono pile foundations: they can be either concrete or pre-stressed, used for low or mid-level water depths, and having as advantage low levels of noise emission in operation, low maintenance, material availability with large-scale production;
b. Tripod foundations: designs tend to rely on technology used by the oil and gas industry. The piles on each end are typically driven into the seabed, used for deeper depths and has not been used on many projects to date;
c. Jacket foundations: can be made of a steel framework with pile foundation, used mainly for great level water depths and has the advantages of light weight and high rigidity;
d. Gravity foundations: they can be made of restrained steel pile, used mainly for lower level water depths and having the advantage of being a simple and cost-efficient construction for small depths.
(a) (b) (c) (d) Fig. 3 : Offshore wind turbine components Fig. 4: Types of foundations
All these components are produced in different locations that are why; we have to take into account a problem of logistics. Moreover the different technologies used in the case of foundations require various assembly strategies as well as different handling systems.
2.2 Complex logistics process
2.2.1 Main problem related to logistic
Up to now, no “standard” procedure has been established for transport and installation of offshore wind turbines. The different projects used different types of ship coming from oil and gas sector and civil marine sector. The availability of installation vessels is a major challenge for the expected development of offshore wind by 2020. Secondly, the installation of offshore wind turbines is extremely demanding, due to higher number of operation days and repetitive installation processes. A lot of installation vessels are not ideal for such conditions or are already used by the oil and gas industry.
Over the past years, offshore wind has fostered the creation of specialized jack up vessels to ensure the turbines can be quickly and efficiently installed, Fig.5. The record for putting up the tower, nacelle and blades of one turbine on a windmill using a jack up vessel was close to eight hours. For transport, few vessels are currently able to transport heavy substructures (gravity foundation, tripod, etc). In addition, heavy lift vessels from the oil and gas industry are not suited to serial installation of foundations, mainly because of their cost.
Fig. 5: Installation of tower, nacelle and rotor of an offshore wind turbine using a jack up vessel Source: Horns Reva
2.2.2 Installation strategies for offshore wind structures Nowadays, three installation strategies can be listed:
1. Pre-assembly at harbor;
2. Manufacture and pre-assembly at harbor; 3. Assembly offshore
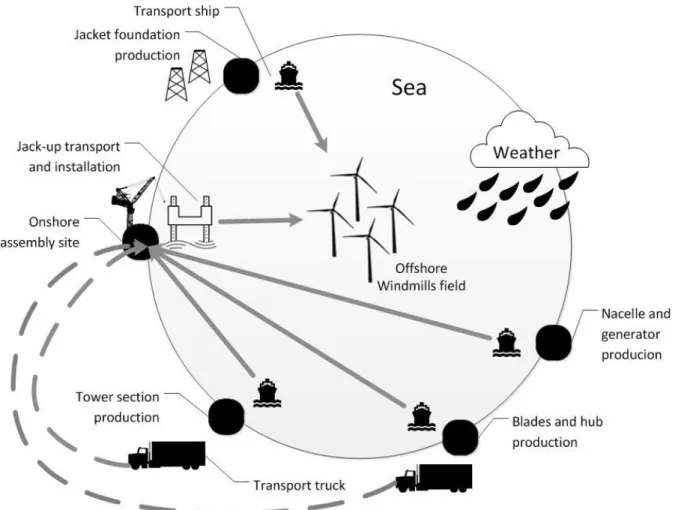
The choice of one strategy will depend on the economical balance between number and type of ships used, the distance to shore and the risk involved due to different operations, Fig.6. Note that transportation is often being realized by sea but sometimes can be done by roads.
Pre-assembly at harbor - Turbines, substructures and towers are transported by trucks and/or ships to a support harbor close to the wind park. Preparation and pre-assembly of different components are finished at this support harbor. Afterwards, the structures are transported and installed on site, by an installation vessel (jack up vessel). The support harbor has two main functions, the temporary storage
of the wind turbine components and the logistic center. The main tasks performed in this harbor are the pre-assembly of wind turbine components, the testing of parts, the quality control and the loading of the structures on the installation vessel.
Manufacture and pre-assembly at harbor - A second approach is shipping the pre-assembled turbines directly from the manufacturers to the site. Components are transported using high speed jack-up vessel shuttles.
Assembly offshore - In this third strategy, feeder vessels supply an offshore jack-up vessel to the installation site. Assembly and installation operations are then performed from this structure. The main advantage of this method is that the installation vessel does not need to be used for transport. However, an extra loading operation has to be used to load the feeder vessels or barges.
Fig. 6 : Example of a process flow of the erection of an offshore windmill park
2.2 Stochastic weather
Another aspect concerns the weather that has a major importance for all offshore operations. This phenomenon is highly random, Steinhauer (2011). It is important to be able to analyze the effects of weather uncertainties upon the process of installation of offshore wind turbines such as the delays of transport ships, waves too high in order to perform installation, etc. The jacking process of an offshore vessel can only be executed up to a certain wave height and wind speed. Work on the facade of a building can only be done up to a certain wind speed, and not when it is raining. Moreover, it is important to note that certain weather parameters can have an impact on certain process parameters. The speed of a ship depends on the wave height or the drying time for concrete depends on the air temperature.
The model should be able to take into account the effects of weather on the installation cycle, to assess the likelihood of delays of a certain process and to propose alternatives to minimize the effects of these delays. By evaluating different alternative scenarios the over-all installation process will be optimized with respect to shortest installation times and highest robustness of the schedule.
2.3 Continuous production flow
Production must be as much as possible a continuous process with no downtime for machines/operations, e.g. transport and assembly ships that are very expensive equipment’s. The project continuity is given by the meteorological input. Using the measurements of the wave height and wind speed for the specific site location we can find the probability to perform a certain process under good meteorological conditions.
2.4 Growing size of the components
It is easier to appreciate the size of the newest wind turbines with comparisons to previous generations (see Fig. 7). The latest generations of wind turbines that will soon be installed at sea have a power of 6MW, which largely outperform the currently installed offshore wind turbines, whose power does not exceed 5 MW. The current trend is to develop high power machines to increase the energy produced by the wind parks, while reducing the number of machines. The size of the turbines significantly increases the difficulty of construction and the risks during assembly at sea. Moreover, as offshore machines increase in size, more manufacturers will be relocated directly to or in the proximity of the harbor facilities to ease transportation of machines and delivery of components.
Today, the supply chain for offshore wind turbines relies on processes that already exist in onshore wind industry and offshore structures for gas and oil sector. In the future, the experience gained from offshore wind parks and the need to produce in series for large scale projects should lead to standardization and important optimization in the supply chain processes.
Fig. 7: Growing size of the turbines since 1985, Source: ECN
3. Basis of the risk based simulation
Due to the highly stochastic propensity of the phenomenon described before we decided to base our tool on Discrete Event Simulation (DES). Nowadays, more and more applications of simulations and optimizations are used in production planning to increase production performance and competitiveness of shipyards, Steinhauer et al. (2006), Kim et al. (2007), Souza et al (2008), Bentin et
al. (2008). Some authors even consider that DES is a key new technology of the millennium with a considerable expected growth rates per year, Steinhauer (2003).
3.1 Discrete Event Simulation (DES)
DES only takes points in time (events) into consideration. Such events may, for example, be an element entering a station or leaving it, or moving on to another machine. Any movements in between have little interest for the simulation itself. What is important is that the entrance and the exit events are displayed correctly. When the element enters a material flow object, the software calculates the time until it exits that object. Finally, the simulation software makes a list of all the important events where each event is programmed and executed step by step. The total time needed to run a simulation is really faster and limited only by the computer speed.
DES programs allow the mobilization of virtual plants like shipyards where product data contains all geometrical and methodical information about the ship while the simulation model includes all parameters describing the production facilities, resources (machines, humans, etc.) and processes. One of the major advantages of the production simulation is that it is possible to integrate the operating rules of each workshop and simulate the complex interactions between the different actors (human and material resources, transportation, machinery and tools, etc.). The production simulation is particularly effective to tackle phenomena such as the surface management, transport management, flow management (identification of bottlenecks), management of failures and hazards, etc. that a simple analytic workload simulation cannot integrate.
Thus, we can underline the advantages of this technology:
• We can easily vary the parameters of a system such as product features, operating procedures, decision rules, information flows, and organizational procedures and then evaluate the impacts of these changes.
• Hypotheses about how or why certain phenomena occur can be tested for feasibility so that the errors are made on the model instead of in reality.
• Simulation models often have a visual Graphical User Interface (GUI), sometimes with graphic animations. This makes them more reliable and understandable for the users and managers.
Nevertheless, some limitations must be highlighted, Smith (1999):
• Development of a simulation model requires time and very significant resources.
• Model building requires special training. It is an art that is learned over time and through experience. The ability to create a model that accurately represents the reality to be simulated is not immediately apparent. Real systems are extremely complex and some assumptions and omissions must be made about the details that will be captured in the model.
• Another limitation is the availability of data to describe the behavior of the system. It is common for a model to require input data that is unavailable.
Nowadays, DES tools are currently used in many industries including some shipyards to increase efficiency and workshop productivity, and to give computer-supported answers to the major questions: when and where to produce and with what and with which resources, depending on the availability and restrictions of resources and materials. Nevertheless, only few simulation models are able to take into account the real weather data, Steinhauer (2011).
3.2 Methodology
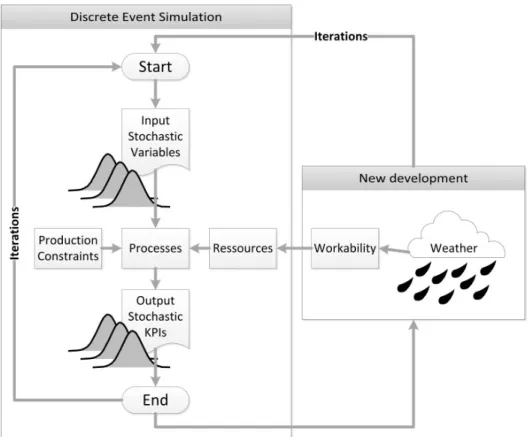
The development of the tool has been started in order to give an answer to a well-defined industrial requirement: the need to evaluate the risk of the strategic decision related to the erection of an offshore wind park before its construction. Fig.8 describes the workflow of the model, in which we can see the different elements involved in the modeling of the problem.
Fig. 8: Workflow of the risk based simulation
3.2.1 Standard DES modelling
The tool is based on the Plan Simulation DES software. The DES workflow that includes all the assembly and transport process shown in Fig. 8 has been implemented using the predefined objects available in the software’s interface.
Some stochastic input variable are applied on production processes such as transportation, assembly phases or storage. An example of a process stochastic variable is the assembly duration of a rotor (linking 3 blades with one hub). It means that a mean duration and a standard deviation of a normal distribution are given instead of a constant value. Moreover, each process can be affected by production constraints and use different resources (ships, cranes, storage areas). For instance, the assembly of the rotor requires a huge crane and cannot be done before that all the blades are available. These constraints are different from one process to another depending on the construction sequences and the work breakdown structure of the product.
Furthermore, all the parameters related to the processes, resources and constraints are included in the model, the DES software can be launched using different seeds for the stochastic generator. So, in the end, after running it for a relevant number of times, the user can integrate the output of different results and get for example the standard deviation diagram, for each Key Performance Indicator (KPI).
Two main KPIs have been considered in this simulation: cost and lead time. It has been demonstrated that both cost and lead time can vary considerably depending on the country in which the offshore wind park is located, the size of the generator, the distance to electrical grid, the sea bed characteristics and the ship owners. That is why a cost assessment module has been developed. The cost assessment of a product starting from a DES model is a quite easy task. Indeed, all individual process times of the manufacturing tasks are a result of the simulation and linked to various resources. To assess the cost of the process, we can just multiply the operating time of each resource such as the ships, cranes and surface storage by its dedicated cost rate (Euro/hour). Then, the end user will have a clear picture in terms of the expected risk on cost for the future project.
3.2.2 New development
The new development concerns the weather that has a major importance for all offshore operations, as explained before.
Due to the fact that weather conditions can vary significantly from one offshore site to another we have chosen the option to use real weather data with the following information available every 10 minutes of the last decade. Aggregation of the data will be possible per hour and per day. These measurements are related to the following parameters:
• Time step [2000-01-01 20:20:20];
• Average wind speed at the first altitude in m/s; • Average wind speed at the second altitude in m/s; • Average wave height in meters.
Weather conditions are applied to the resources through the workability module. This module defines certain criteria that say whether a resource can or cannot be used, depending on the weather conditions. For instance the huge crane used to assemble the rotor cannot be used if the wind speed overpasses 20 km/h. Additionally to these criteria we also have to define the concept of “time window” for the utilization of the resources. The time window is defined by the amount of time in which the weather parameters will allow the process to occur (under safe weather conditions). This time window is implemented for each transport resource (transport ship, jack-up, cranes etc.).
Finally, after the conventional loops of the DES we are making a second set of loops to consider the different weather data for different starting years. For instance, a project that must start in June will be first simulated in June 1994 (first year of data availability), then in June 1995, …, until June 2011. In that way all the statistical output distribution can be combined at the end of the process in only one risk indicator for both cost and lead time.
Having all these concepts in mind, the user can estimate what is the probability to start a certain process under good weather conditions, and to be able to finish it in time. Nevertheless, this methodology is only possible considering that weather information is available at any time i.e. each 10 minutes for all the past decade. That is of course not the case because some time to times the captors have been damaged, etc. In the following section we developed a methodology to generate the missing data with a Probabilistic Neural Network (PNN).
4. Generating weather missing data with PNN
The first intent has been to use a standard Multi-Layer Perceptron (MLP) neural predictor in order to generate the weather missing data. It has not been successful, because after a certain number of points the system got over-trained and the only output that can be generated was related to average values (i.e. wind speed) and not stochastic weather data. These issues are common in neural networks that must decide from amongst a wide variety of responses.
In order to overcome this problem we decided to use a Probabilistic Neural Network (PNN), Berthold et al. (1997), that has the capacity to randomly shuffle the training examples, by using a numerical optimization algorithm that does not take large steps when changing the network connections following an example. The main advantage of this algorithm is that only two rather uncritical parameters are required to be adjusted manually and there is no danger of overtraining; the algorithm clearly indicates the end of training. In addition, the networks generated are small due to the lack of redundant neurons in the hidden layers.
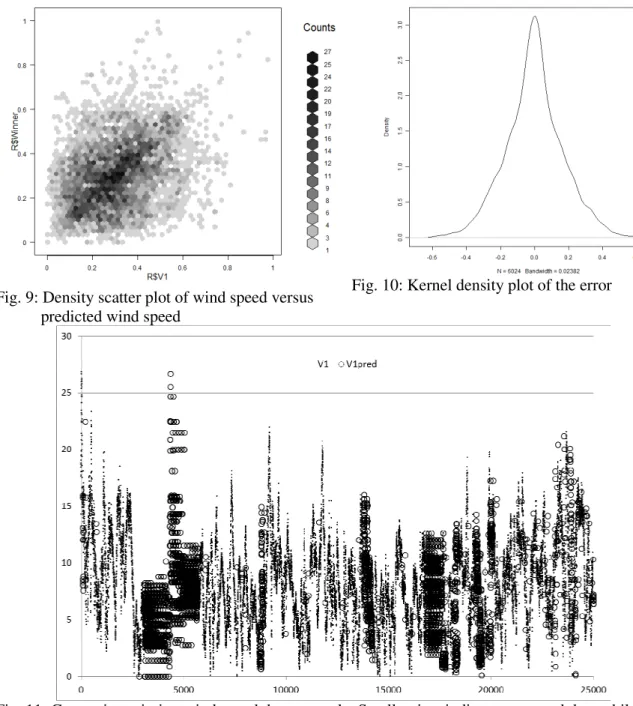
A sample of 25 000 points (174 days) has been extracted from the weather data in order to decrease the size of the problem. The model has been trained with 17 500 points while tested with 7500 points. Fig. 9 and Fig. 10 are presenting the first results obtained with the PNN model. Fig. 9 shows the
density scatter plot of wind speed versus predicted wind speed while Fig. 10 presents the kernel density plot of the error. Fig. 11 shows the generated missing data for the sample of points selected for this demonstration. Some improvements must be done to increase the quality of the model for the model used for generating missing data.
Fig. 9: Density scatter plot of wind speed versus predicted wind speed
Fig. 10: Kernel density plot of the error
Fig. 11: Generating missing wind speed data example. Small points indicate measured data while small bubbles indicate generated data.
5. Conclusions
To conclude, the concept presented in this paper aims to validate the strategies and assembly scenarios of the construction of a wind turbine park. The current developed tool will allow analyzing the impact of certain parameters on the production and assembly workflow, in order to reduce the global time of the project and its cost. By evaluating different alternative scenarios the over-all installation process can be optimized with respect to shortest installation times and highest robustness of the schedule. The risk based simulation presented in this paper will:
• Provide a fast and reliable method to simulate the fabrication of an offshore wind turbine park;
• Take into account the most important stochastic parameters linked to fabrication; • Simulate all the constraints associated to the fabrication processes;
• Determine the impact of assembly strategies and planning on the cost and lead time;
• Create a model which allows to undertake a statistic risk analysis, that has as final outcome the assessment of the risks involved in the assembly of an offshore wind turbine park;
• Create a "Decision Making" tool, able to ensure, as far as it may, a smooth chain supply and to enable a long term planning and a quick response in the short term.
6. Future work
The tool is under development and there are still plenty of improvements to be done in order to obtain a robust software:
• Improving the model of generating the weather missing data;
• Testing different scenarios for the assembly of an offshore wind turbine park (having different number of transport ships, or jack-ups etc.);
• Validating the results with industrial data;
• Improving the cost model, by taking into account all the resources with their corresponding cost per unit of time;
• Implementing the module used to combine the output distribution of cost and lead time after running the loop through the years.
Acknowledgements
The authors would like to thank Tractebel Engineering and more specifically the Renewable Energy team and their Product Manager Tina Tijsma for their assistance and support for the elaboration of the tool mentioned in the article as well as redaction of this article.
References
BENTIN, M., SMIDT, F., PARTH, S., (2008), Process modelling and simulation using CAD data and PDM in early stage of shipbuilding project, COMPIT’08, pp.200-213
BERTHOLD, M.R.; DIAMOND, J. (1998), Constructive training of probabilistic neural network, Neurocomputing, 19, pp.167-183
KIM, Y.S.; LEE, D.H. (2007), A study on the construction of detail integrated scheduling system of shipbuilding process, J. Society of Naval Architects of Korea 44/1, pp.48-54
SMITH, R.D. (1999), Simulation: The Engine Behind the Virtual World, Vol. 1 in the Simulation 2000 Series
SOUZA, C.M.; TREVISANI C.; FREIRE R.M.; COSTERMANI H.; MENDES Y. (2008), Uso da Simulação para Análise Integrada de Estratégias de Construção (in portuguese), 22º National Congress of Maritime Transportation, Shipbuilding and Offshore Construction, Rio de Janeiro
STEINHAUER, D. (2003), The virtual shipyard – Simulation in production and logistics at Flensburger, COMPIT, Hamburg, pp.203-209
STEINHAUER, D. (2011), The Simulation Toolkit Shipbuilding (STS) – 10 years of cooperative development and interbranch applications, COMPIT, Berlin, pp.453-465
STEINHAUER, D.; MEYER-KONIG, S. (2006), Simulation aided production planning in block assembly, COMPIT, pp.96-102