ORIGINAL CONTRIBUTION
White Matter Changes in Corticobasal Degeneration
Syndrome and Correlation With Limb Apraxia
Barbara Borroni, MD; Valentina Garibotto, MD; Chiara Agosti, MD; Simona Maria Brambati, PhD; Giuseppe Bellelli, MD; Roberto Gasparotti, MD; Alessandro Padovani, MD, PhD; Daniela Perani, MD
Background:Data on white matter changes in cortico-basal degeneration syndrome (CBDS) are not yet avail-able, whereas cortical gray matter loss is a feature of this condition. The structural abnormalities related to a key feature of CBDS (limb apraxia) are unknown.
Objectives:To measure selective structural changes in early CBDS using diffusion tensor imaging and voxel-based morphometry and to evaluate the structural cor-relates of limb apraxia.
Design:Patient and control group comparison.
Setting:Referral center for dementia and movement disorders.
Participants: Twenty patients with CBDS and 21
matched control subjects.
Interventions: Clinical and standardized neuropsy-chological evaluations, including assessment of limb apraxia.
Main Outcome Measures: Gray and white matter
changes in early CBDS.
Results:Diffusion tensor imaging revealed decreases in fractional anisotropy in the long frontoparietal connect-ing tracts, the intraparietal associative fibers, and the cor-pus callosum. Fractional anisotropy was also reduced in the sensorimotor projections of the cortical hand areas. Voxel-based morphometry showed a prevalent gray mat-ter reduction in the left hemisphere (in the inferior fron-tal and premotor cortices, pariefron-tal operculum, supero-temporal gyrus, and hippocampus). The pulvinar, bilaterally, and the right cerebellar cortex also showed atrophy. Limb apraxia correlated with parietal atrophy and with fractional anisotropy reductions in the parieto-frontal associative fibers (P⬍.01). The limb-kinetic com-ponent of apraxia correlated with reduction of hand sen-sorimotor connecting fibers.
Conclusions:The present integrative approach to in vivo structural anatomy combines hodologic imaging, de-scribing patterns of white matter connections between cortical areas, with neuropsychological data. This pro-vides new evidence of gray matter and fiber tract abnor-malities in early-phase disease and contributes to clari-fying the neural basis of apraxia in CBDS.
Arch Neurol. 2008;65(6):796-801
C
ORTICOBASAL DEGENERA-tion syndrome (CBDS) is characterized by higher cortical dysfunctions as-sociated with progres-sive asymmetrical akinetic-rigid syndrome and limb dystonia or focal myoclonus. One of the most typical clinical features of CBDS is limb apraxia, which is present in up to 70% of patients.1Neuroimaging stud-ies2-4help highlight the structural and func-tional abnormalities during the disease course. In the past few years, diffusion ten-sor imaging (DTI) has provided more subtle information about white matter (WM) tissue composition and has al-lowed the demonstration of fiber tracts in vivo.5-7To our knowledge, no DTI study in patients with CBDS is available.
In the present study, we applied 2 un-biased techniques for structural neuroim-aging (DTI and voxel-based
morphom-etry [VBM]) to patients with early-phase CBDS in an attempt to describe the initial gray matter (GM) and WM changes of the disease. Furthermore, to shed light on the structural abnormalities that lead to limb apraxia in CBDS, we specifically ex-plored the neuroanatomical correlates.
METHODS
PARTICIPANTS
Twenty patients with CBDS (13 men and 7 women; mean [SD] age, 62.7 [8.0] years), re-cruited from the Centre for Neurodegenera-tive Diseases and the Centre for Movement Dis-orders, University of Brescia, enrolled in the study. All the patients underwent a somatic and neurologic examination, routine laboratory ex-amination, and brain structural magnetic reso-nance imaging (MRI). The diagnostic criteria for CBDS were used for patient inclusion.1 Author Affiliations are listed at
Twenty-one healthy individuals (8 men and 13 women; mean [SD] age, 65.6 [4.1] years) were recruited among patients’ spouses and relatives to serve as control subjects. They were interviewed, assessed for neurologic or cognitive dysfunction, examined for diseases that were exclusion criteria for the pa-tient group, and underwent structural brain MRI.
All the participants were right-handed and were made fully aware of the aims of the research. Written informed consent was obtained from all the participants. This study was con-ducted in accordance with the Brescia University Hospital, Bres-cia, ethics committee regulations and conformed to the Dec-laration of Helsinki. Anamnestic and clinical data were compared between patients with CBDS and controls using the unpaired
t test or the2test. The significance level was set at P⬍.05.
Analyses were conducted using a commercially available sta-tistical software program (SPSS Inc, Chicago, Illinois).
EXCLUSION AND INCLUSION CRITERIA Stringent exclusion criteria were applied, as follows: (1) cere-brovascular disorders, hydrocephalus, and intracranial mass as documented by MRI; (2) a history of traumatic brain injury or another neurologic disease; and (3) significant medical prob-lems. The inclusion criteria were as follows: (1) fulfillment of the criteria for probable CBDS and follow-up for at least 2 years after enrolling in the study, with the diagnosis of CBDS con-firmed at the follow-up examination; (2) mild functional de-cline (basic activities of daily living [ADLs] score⬍1); and (3) onset of the first symptoms within 4 years.
CLINICAL AND
NEUROPSYCHOLOGICAL ASSESSMENT Motor impairment was evaluated by means of the motor sec-tion of the Unified Parkinson Disease Rating Scale (UPDRS-III). Instrumental and basic ADLs were assessed as well. Be-havioral and psychiatric disturbances were evaluated by means of the Neuropsychiatry Inventory and the Frontal Behavioral Inventory. Assessment of global cognitive function was per-formed according to a standardized battery (Table 1).
Apraxia was assessed using the test of De Renzi et al.8We chose
this ideomotor apraxia test because (1) it has been normalized on the Italian population; (2) it examines only intransitive ges-tures, which have been proposed to be best suited to tap ideo-motor apraxia without ideational apraxia involvement; and (3) it is performed only on imitation, which makes it possible to test nonmeaningful and meaningful actions. The test of De Renzi et al examines equal proportions of movements executed with the whole arm and hand (complex gesture) and with the hand and fingers (simple gesture), the latter allowing limb-kinetic apraxia to be evaluated. As specified in the original normative data, scores of less than 53 (of a possible 72) indicate apraxia, scores greater than 62 are normal, and scores in between are borderline.
In patients with CBDS, both arms were examined sepa-rately because motor impairment is asymmetrical, and either the left or the right arm may be involved at the beginning of the disease. Furthermore, the development of clumsiness, a stiff hand, the inability to use utensils or appliances, and the in-ability to use both hands as before disease onset were evalu-ated by means of an interview with the primary caregiver in daily contact with the patient (Frontal Behavioral Inventory, apraxia or alien hand, on a scale from 0 [none] to 3 [severe]).
MRI DATA ACQUISITION
The MRI was performed using a 1.5-T system (Symphony; Siemens, Erlangen, Germany). For VBM analysis,
3-dimen-sional magnetization–prepared rapid gradient-echo T1-weighted images were acquired using the following settings: echo time, 3.93 milliseconds; repetition time, 2010 millisec-onds; flip angle, 15°; and field of view, 250 mm. This yielded 176 contiguous 1-mm-thick sections. The DTI was performed by means of echo-planar imaging at 1.5 T with a standard head coil for signal reception. The DTI axial sections were obtained using the following settings: matrix, 128⫻128; echo time, 122 milliseconds; repetition time, 6600 milliseconds; flip angle, 15°; field of view, 220 mm; no gap (5-mm thickness); and voxel size,
1.7⫻1.7⫻5.0 mm. Three acquisitions were averaged.
Diffu-sion weighting was performed along 6 independent directions
with a b value of 1000 s/mm2. A T2-weighted image with no
diffusion weighting was also obtained (b = 0 s/mm2). MRI ANALYSIS
Preprocessing and statistical analyses were implemented using a statistical parametric mapping software package (SPM2; Well-come Department of Imaging Neuroscience, London, En-gland [http://www.fil.ion.ucl.ac.uk/spm]) running on MATLAB 6.5.1 (MathWorks, Natick, Massachusetts).9
Optimized VBM analysis was performed according to the method of Good and colleagues,10as previously published.6,7
Op-timally normalized magnetization-prepared rapid gradient-echo images were segmented into GM, WM, and cerebrospinal fluid segments. Modulated GM and WM images were smoothed with a 10-mm full-width half maximum kernel. To avoid po-tential bias from the normalization process, anatomical and gray and white matter templates—referred to a stereotactic space (Talairach)—were created, including all T1-weighted images of patients and controls. The normalized, segmented, and smoothed data were statistically tested using a general linear model based on gaussian field theory using analysis of covariance, with the total amount of GM and WM treated as a nuisance covariate to detect local areas of relative accelerated loss of GM and WM vol-ume. The statistical threshold was set at P⬍.05, false discovery rate correction for multiple comparisons, with a minimum clus-ter size of 20 voxels.
For DTI, the fractional anisotropy (FA) (an index of direc-tional selectivity of water diffusion) was determined for each voxel by using computer software (BrainVISA 1.6; SPSS Inc). A cus-tomized template was obtained by taking the average of all
par-Table 1. Neuropsychological Assessment in 20 Patients With CBDS Test Test Scores Patients With CBDS, Mean (SD) Cutoff Valuea Short story 9.3 (4.4) ⬎7.5
Raven progressive colored matrices
23.4 (7.9) ⬎17.5
Rey figure copy 24.0 (10.3)b ⬎27
Rey figure recall 10.3 (7.0) ⬎9
Phonemic fluency 26.5 (12.7) ⬎17.35
Semantic fluency 10.3 (3.7) ⬎7.25
Token test 29.7 (7.9) ⬎26
Digit span 5.5 (1.7) ⬎5
Trail Making Test A, s 163.0 (182.2)b ⬍70 Trail Making Test B, s 271.8 (177.1)b ⬍170 Abbreviation: CBDS, corticobasal degeneration syndrome. aCutoff values are in accordance with Italian normative data. bPathologic scores.
ticipants’ T2-weighted images (b=0 s/mm2), previously
normal-ized to the echo-planar imaging template in the Talairach standard stereotactic space. We calculated the normalization variables that best fit each T2-weighted image by using a customized echo-planar imaging template, and the variables were then applied to FA maps and to T2-weighted images. The T2-weighted normal-ized images were then segmented into GM, WM, and cerebro-spinal fluid. A WM binary mask was created from the WM seg-ments obtained in the previous step and was applied to each participant’s normalized FA map to include only the voxels be-longing to the WM regions in the statistical analysis. The masked normalized FA maps were smoothed with a 10-mm full-width half maximum kernel. The smoothed WM segments were then statistically tested by means of a general linear model based on gaussian field theory. The FA differences between groups were assessed using a t test statistical design (statistical threshold of
P⬍.05, false discovery rate correction for multiple
compari-sons, minimum cluster size of 20 voxels). CORRELATION ANALYSES
We conducted a linear regression analysis of VBM and FA data using SPM2, entering the following subscores from the test of De Renzi et al8: (1) sum of both limb scores, (2) sum of the
right and left simple gesture scores, and (3) sum of the right and left complex gesture scores, all as independent variables. The dependent variable was FA. Age was entered into the model as a nuisance variable. We reported findings meeting the thresh-old of P⬍.001 and also P⬍.01 (uncorrected for multiple com-parisons) based on an a priori hypothesis.
RESULTS
PARTICIPANTS
The mean (SD) value of the UPDRS-III was 20.8 (10.4) and of the Mini-Mental State Examination was 25.0 (3.6). The mean (SD) instrumental ADLs (lost) value was 1.1 (2.0), and the basic ADLs (lost) value was 0.70 (0.50). The mean (SD) disease duration was 2.0 (1.4) years.
Patients with CBDS had visuospatial (Rey figure copy), psychomotor dexterity (Trail Making Test A), and
ex-ecutive function (Trail Making Test B) deficits (Table 1). A standardized examination of language functions showed mean scores within the reference range. Behavioral dis-turbances were present in some patients with CBDS, and the most common disorder was apathy, which was pres-ent in 25% (5 of 20) patipres-ents.
The affected limb at onset was on the right side in 55% (11 of 20) patients and on the left side in 45% (9 of 20) patients. At the MRI study, most patients, despite an asym-metrical onset, showed bilateral apraxia: only 3 patients presented with right unilateral apraxia. Mean (SD) test scores on the test of De Renzi et al8were 51.0 (23.8) for the right limb and 52.6 (21.9) for the left limb. The Fron-tal Behavioral Inventory item of praxis was referred to as pathologic (scoreⱖ1) by the caregiver in 75% (15 of 20) patients.
VOXEL-BASED MORPHOMETRY
There was an asymmetrical pattern of cortical atrophy in CBDS, which was greater in the left hemisphere (clus-ter size inTable 2). In patients with CBDS compared with controls, significant clusters of reduced GM on VBM were found in the dorsolateral frontal cortex, premotor cortex, parietal operculum, parietal cortex, superotem-poral gyrus, and hippocampal uncus. Regarding subcor-tical brain regions, there was reduced GM density in the pulvinar bilaterally. The right cerebellar cortex showed GM reductions (Table 2 andFigure 1). The WM com-parison on VBM showed significant clusters of reduc-tion in only the body and the splenium of the corpus cal-losum. The opposite comparison (greater atrophy in healthy controls compared with patients) in VBM for GM and WM did not reveal voxels above the threshold.
DTI ANALYSIS
The DTI analysis revealed significant and extensive FA changes in the dorsolateral parietofrontal associative fi-bers and the intraparietal associative fifi-bers and in the
sen-Table 2. Locations of the Peaks of Regional Reduction in Gray Matter in Patients With CBDS Compared With Controls
Brain Region
(Patients With CBDS vs Controls)
Peak Coordinates, mma
t Statistic z Value Cluster Size
x y z
Left dorsolateral frontal cortex − 46 23 8 4.30 3.85
19 347
− 50 17 36 4.01 3.63
Left premotor cortex − 45 3 35 5.05 4.38
Left parietal operculum − 52 − 9 12 4.49 3.99
Left superotemporal gyrus − 57 − 18 11 4.83 4.23
Left insula − 48 − 11 3 4.39 3.91
Left uncus − 34 6 − 20 4.13 3.72
Left superoparietal cortex − 23 − 47 60 3.47 3.20 1021
Right dorsolateral frontal cortex 46 30 9 4.41 3.93
2415
Right superotemporal gyrus 51 10 − 4 5.00 4.34
Right insula 46 10 − 4 5.00 4.34
Right/left thalamus–pulvinar 8 − 31 2 5.78 4.85
2893
0 − 10 18 3.51 3.24
Right cerebellar cortex 18 − 83 − 30 4.22 3.79 3370
Abbreviation: See Table 1.
sorimotor associative fibers in the hand cortical repre-sentations, all bilaterally. The body and the splenium of the corpus callosum showed a significant decrease in FA. The left fornix fibers and the right ventrolateral parieto-frontal fibers showed significant FA reductions (Table 3
andFigure 2).
VBM AND FA CORRELATIONS WITH APRAXIA
Using VBM, we found a positive correlation between total scores on the test of De Renzi et al8(sum of both limbs) and GM density in the parietal operculum bilaterally (P⬍.001).
Regarding FA, at a high statistical threshold (P⬍.001), no correlations emerged. Based on an a priori
hypoth-esis of an involvement of frontoparietal connecting fi-bers, we lowered the threshold to P⬍.01 and found a posi-tive correlation between total scores on the test of De Renzi et al8and FA only in the left dorsolateral parietofrontal associative fibers. We further explored the correlation with complex and simplex gesture subscores: for complex ges-ture subscores, a correlation with the left parietofrontal associative fibers and intraparietal associative fibers was found, whereas for simple gesture subscores, a signifi-cant correlation with local FA value of the fibers con-necting the premotor and parietal areas bilaterally was found. The limb-kinetic component of apraxia showed a correlation with hand sensorimotor connecting fibers (Figure 3).
P
L
L
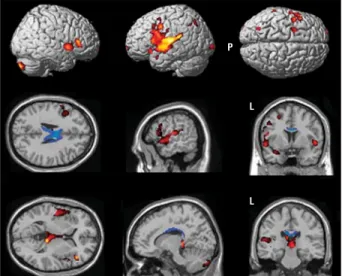
Figure 1. Regions of brain atrophy in patients with corticobasal degeneration syndrome (CBDS) relative to control subjects. Voxel-based
morphometry–identified regions of decreased gray matter (red) and white matter (blue) volume relative to age-matched controls in patients with CBDS are displayed on a healthy adult brain template (row 1). The Talairach coordinates are as follows. For row 2, x = −53, y = 0, and z = 25; and for row 3, x = 15, y = −26, and z = 13. The threshold was set at P⬍.001. Table 2 provides the coordinates. L indicates left; P, posterior.
Table 3. Locations of the Peaks of Regional Reduction in Fractional Anisotropy in Patients With CBDS Compared With Controls
Fasciculus (Patients With CBDS vs Controls)
Peak Coordinates, mma
t Statistic z Value
x y z
Dorsolateral parietofrontal associative fibers and intraparietal associative fibers
Left − 30 − 53 25 5.19 4.47
− 50 − 14 21 5.35 4.43
Right 38 − 57 27 6.47 5.26
Sensorimotor associative fibers (hand cortical area)
Left − 20 − 46 43 5.21 4.44 Right 18 − 47 37 4.72 4.15 Corpus callosum Body 4 − 4 19 4.65 4.10 Splenium − 8 − 14 22 5.13 4.43 Left fornix − 18 − 33 − 3 5.00 4.35
Right ventrolateral parietofrontal fibers 46 5 − 14 5.22 4.49
Abbreviation: See Table 1.
aThe x, y, and z values localize the areas of fractional anisotropy reduction according to the Talairach stereotactic coordinates. Only peaks with the highest significance are reported.
P L L L L z = 18 z = 23 z = 27 z = 38 z = 44 y = –17 y = –21 y = –23 y = –29 y = –37 x = –48 x = –14 x = –8 x = 12 x = 51
Figure 2. Regions of reduction in fractional anisotropy (FA) in patients with corticobasal degeneration syndrome relative to control subjects. Clusters of statistically significantly decreased FA relative to age-matched controls are displayed on a 3-dimensional rendering of a healthy white matter template (row 1) and on transaxial, coronal, and sagittal sections of a healthy FA template (rows 2, 3, and 4, respectively). The “DTI Analysis” subsection of the “Results” section provides details. The threshold was set at P⬍.001. Table 3 provides the coordinates. L indicates left; P, posterior.
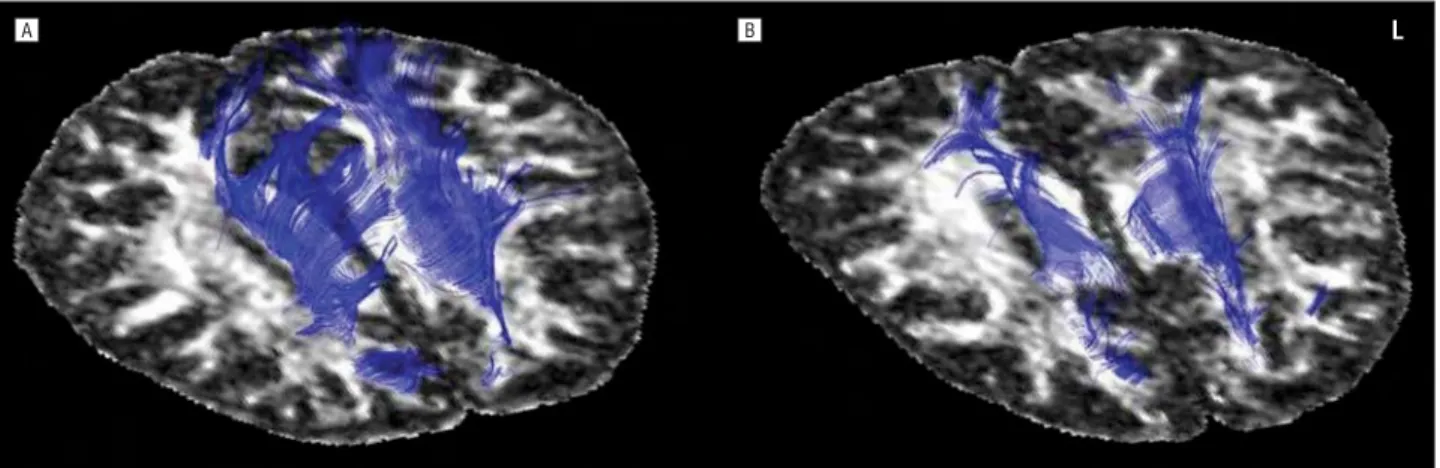
DTI AND FIBER TRACKING IN INDIVIDUAL PARTICIPANTS
Selective reduction of WM bundles in the parietal corti-cocortical connections and in the posterior corpus callo-sum is illustrated in a single patient with CBDS (Figure 4). For this purpose, a control (a 60-year-old woman with a UPDRS-III score of 0 and a Mini-Mental State Examina-tion score of 30 [of a possible 30]) and a patient with CBDS (a 64-year-old man with a Mini-Mental State Examina-tion score of 19 [of a possible 30] and a UPDRS-III score of 37 [bilateral apraxia]) were chosen. Fiber tracking was obtained using the FACT algorithm implemented in the computer software (BrainVISA 1.6).
COMMENT
In the present study, we characterized CBDS by using the combination of 2 different techniques of structural brain imaging (VBM and DTI), in an attempt to shed light on the GM and WM abnormalities in the early stage of the disease and to explore the relationship of the structural changes and upper limb apraxia.
VBM RESULTS
In agreement with previous data,3,4we showed that CBDS is characterized by bilateral asymmetrical (left-sided
preva-lence) GM reductions in frontal, parietal, and temporal re-gions and in subcortical gray structures, such as the pul-vinar, bilaterally, and in the right cerebellar cortex (Figure 1). Investigating specifically the pathologic changes as-sociated with praxic performance, we found a signifi-cant correlation between apraxia and GM atrophy at sym-metrical loci in the parietal operculum. The VBM results suggest that in CBDS, the dysfunction could be consid-ered at the level of decoding the inner representation of movements.11The hypothesis of an involvement of the parietal operculum in praxis was advanced in neuroim-aging experiments of visually guided movements and men-tal transformation of the body in space12and also in neu-ropsychological studies of patients with cerebrovascular disease during elaboration and maintenance of the work-ing representation of the gesture to perform.13
The frontal cortex is the other most prominent region of atrophy reported in the literature,3and the finding of selective atrophy in the left dorsolateral frontal and dor-sal premotor cortices is likely to be related to complex defi-cits in voluntary movement. As for the subcortical struc-tures, the atrophy in the pulvinar may further account for apraxia in patients with CBDS. In fact, several lines of evi-dence indicate that the pulvinar is part of a distributed net-work subserving visuospatial attention.14
The finding of cerebellar atrophy contralateral to the prevalent left-sided cerebral GM reduction might be re-lated to the mild and moderate abnormalities usually documented in the cerebellum and to a distant effect pos-sibly related to retrograde fiber degeneration.
DTI RESULTS
The DTI allows the precise identification of fibers, and it has been successfully applied to other neurodegenera-tive diseases, such as progressive supranuclear palsy and frontotemporal dementia.6,7The present DTI analysis re-vealed a significant reduction in the frontoparietal con-necting fibers and the intraparietal associative fibers and in the sensorimotor fibers of the hand cortical represen-tations. The commissural connections (the body and sple-nium of the corpus callosum) were involved as well.
The present findings fit well with autopsy data in CBDS that report a wide burden of WM abnormalities
signifi-+36 L
+38 +40 +42
+44 +46 +48 +50
Figure 3. Correlation of the limb-kinetic component of apraxia with fractional anisotropy reduction of hand sensorimotor connecting fibers. Statistically significant clusters are displayed on a healthy adult brain template. The threshold was set at P⬍.01. L indicates left.
B
A L
Figure 4. Diffusion tensor imaging in a representative control subject (A) and a patient with corticobasal degeneration syndrome (B) illustrates the selective fiber tract changes. The parietal corticocortical connections and the posterior corpus callosum are displayed and the severe fiber tract reduction in the patient is shown. L indicates left.
cantly greater than those observed in progressive supra-nuclear palsy and Pick disease.15The present study pro-vides new hints into the WM correlates of limb apraxia in CBDS. The degeneration of specific fiber tracts in the as-sociative parietal and frontoparietal connecting bundles can explain ideomotor apraxia. A fludeoxyglucose F 18 posi-tron emission tomography study in CBDS specifically at-tributed the visuoimitative upper limb apraxia to a func-tional impairment of the parietofrontal neural network.2
The bilateral degeneration of the sensorimotor fibers in the hand areas for sensorimotor representations (Figure 3) might be the neural basis for motor distur-bance consistent with the difficulty in performing indi-vidual finger movements. Interference at the level of de-coding the innervatory patterns of movements might, thus, result in limb-kinetic apraxia.
Correlating specifically the structural changes with praxic performance, we found a significant correlation between apraxia scores and reduced FA in the left dor-solateral parietofrontal associative fibers and the intra-parietal associative fibers. The correlation analysis, there-fore, confirms that ideomotor apraxia resides in left hemispheric structural changes according to the classic neuropsychological theories.
We also demonstrated that these fiber bundles are sub-serving mostly complex gesture performance, whereas simple gesture performance correlates with FA reduction in fibers connecting the parietal and premotor areas bi-laterally. The present DTI evidence of an impairment of left dorsolateral parietofrontal associative fibers refers to ideomotor apraxia as the classic disconnection syn-drome.16Three sets of fiber connections have been pro-posed as those underlying praxis (the dorsolateral pari-etofrontal, the dorsomedial paripari-etofrontal, and the ventrolateral parietofrontal fibers), as well as interhemi-spheric fibers located in the body of the corpus callosum (Leiguarda and Marsden17provide a review). According to the present results, we suggest that the dorsolateral pa-rietofrontal fibers and the interhemispheric fibers are prin-cipally involved in causing ideomotor apraxia in CBDS even in the early stages of the disease.
Accepted for Publication: December 1, 2007.
Author Affiliations: Departments of Neurology (Drs
Bor-roni, Agosti, and Padovani) and Neuroradiology (Dr Gas-parotti), University of Brescia, Brescia, Italy; Vita-Salute San Raffaele University, Istituto di Ricovero e Cura a Carattere Scientifico San Raffaele, and Istituto di Bioimmagini e Fi-siologia Molecolare, Consiglio Nazionale delle Ricerche, Mi-lan, Italy (Drs Garibotto and Perani); the Memory Aging Center, Department of Neurology, University of Califor-nia at San Francisco (Dr Brambati); and Ancelle della Carità Hospital, Cremona, Italy (Dr Bellelli).
Correspondence: Daniela Perani, MD, Vita-Salute San
Raf-faele University and Istituto di Ricovero e Cura a Carat-tere Scientifico San Raffaele, Via Olgettina 60, 20132 Mi-lan, Italy (daniela.perani@hsr.it).
Author Contributions: All authors had full access to all
of the data in the study and take responsibility for the integrity of the data and the accuracy of the data analy-sis. Drs Borroni and Garibotto equally contributed to this study. Study concept and design: Borroni, Garibotto, Agosti,
Padovani, and Perani. Acquisition of data: Borroni, Gari-botto, Agosti, Bellelli, Gasparotti, and Padovani.
Analy-sis and interpretation of data: Borroni, Garibotto, Agosti,
Brambati, and Perani. Drafting of the manuscript: Bor-roni, Garibotto, and Agosti. Critical revision of the
manu-script for important intellectual content: Agosti,
Bram-bati, Bellelli, Gasparotti, Padovani, and Perani. Statistical
analysis: Borroni and Garibotto. Obtained funding:
Pado-vani and Perani. Study supervision: Borroni, Agosti, Bram-bati, Bellelli, Gasparotti, Padovani, and Perani.
Financial Disclosure: None reported.
Funding/Support: This study was supported by
Pro-grammi di Ricerca di Rilevante Interesse Nazionale 2005 (Dr Borroni), Ministero dell’Università e della Ricerca 60% 2005-2006 (Drs Borroni and Padovani), the Sixth Euro-pean Program (Drs Garibotto and Perani), the Centre for Behavioural Disturbances and Neurodegenerative Dis-eases Ente Universitario Lombardia Orientale (Dr Pado-vani), and project LSHB-CT-2005-512146 from Diag-nostic Molecular Imaging.
Additional Contributions: We thank the patients and their
families for the time and effort they dedicated to this re-search. Marina Zanetti, PhD, helped with neuropsycho-logical assessment, Paola Scifo, MS, provided technical assistance in MRI data analysis, and Stefano Cappa, MD, provided a critical review of the manuscript.
REFERENCES
1. Lang AE. Cortical-basal ganglionic degeneration. In: Calne DB, ed.
Neurodegen-erative Disease. Philadelphia, PA: WB Saunders Co; 1994:877-894.
2. Peigneux P, Salmon E, Garraux G, et al. Neural and cognitive bases of upper limb apraxia in corticobasal degeneration. Neurology. 2001;57(7):1259-1268. 3. Boxer AL, Geschwind MD, Belfor N, et al. Patterns of brain atrophy that
differ-entiate corticobasal degeneration syndrome from progressive supranuclear palsy.
Arch Neurol. 2006;63(1):81-86.
4. Josephs KA, Whitwell JL, Dickson DW, et al. Voxel-based morphometry in au-topsy proven PSP and CBD. Neurobiol Aging. 2008;29(2):280-289. 5. Conturo TE, Lori NF, Cull TS, et al. Tracking neuronal fiber pathways in the living
human brain. Proc Natl Acad Sci U S A. 1999;96(18):10422-10427. 6. Padovani A, Borroni B, Brambati SM, et al. Diffusion tensor imaging and voxel
based morphometry study in early progressive supranuclear palsy. J Neurol
Neu-rosurg Psychiatry. 2006;77(4):457-463.
7. Borroni B, Brambati SM, Agosti C, et al. Evidence of white matter changes on diffusion tensor imaging in frontotemporal dementia. Arch Neurol. 2007;64 (2):246-251.
8. De Renzi E, Motti F, Nichelli P. Imitating gestures: a quantitative approach to ideo-motor apraxia. Arch Neurol. 1980;37(1):6-10.
9. Friston KJ, Holmes AP, Worsley KJ, Poline J-B, Frith CD, Frackowiack RSJ. Statistical parametric maps in functional imaging: a general linear approach. Hum
Brain Mapp. 1994;2(4):189-210.
10. Good CD, Johnsrude IS, Ashburner J, Henson RN, Friston KJ, Frackowiak RS. A voxel-based morphometric study of ageing in 465 normal adult human brains.
Neuroimage. 2001;14(1, pt 1):21-36.
11. Soliveri P, Monza D, Paridi D, et al. Cognitive and magnetic resonance imaging aspects of corticobasal degeneration and progressive supranuclear palsy.
Neurology. 1999;53(3):502-507.
12. Decety J, Perani D, Jeannerod M, et al. Mapping motor representations with posi-tron emission tomography. Nature. 1994;371(6498):600-602.
13. Sirigu A, Daprati E, Pradat-Diehl P, et al. Perception of self-generated move-ment following left parietal lesion. Brain. 1999;122(10):1867-1874. 14. Nadeau SE, Roeltgen DP, Sevush S, et al. Apraxia due to a pathologically
docu-mented thalamic infarction. Neurology. 1994;44(11):2133-2137.
15. Forman MS, Zhukareva V, Bergeron C, et al. Signature tau neuropathology in gray and white matter of corticobasal degeneration. Am J Pathol. 2002;160(6):2045-2053.
16. Catani M, ffytche DH. The rises and falls of disconnection syndromes. Brain. 2005; 128(10):2224-2239.
17. Leiguarda RC, Marsden CD. Limb apraxias: higher-order disorders of sensori-motor integration. Brain. 2000;123(5):860-879.