LIBRARY
LORY
CATION ADSORPTION ON CLAY SURFACES
William L'Amoureux Robert Rice Massachusetts Institute of Technology
Submitted in Partial Fulfillment of the Requirements for the Degree of
BACHELOR OF SCIENCE from the
Massachusetts Institute of Technology
(1953)
Signature of Author Signature redacted
nm N Signature redacted
Head of Department
Department of Chemical Engineering
Mass. Institute of Technology
Cambridge 39, Massachusetts
Professor Earl B. Millard
Secretary of the Faculty
Massachusetts Institute of Technology
Cambridge 39, Massachusetts
Dear Sir:
This thesis entitled "Cation Adsorption on Clay Surfaces" is hereby submitted in partial fulfillment of the requirements for the degree of Bachelor of Science in Chemical Engineering.
Respectfully submitted,
Signature redacted
ACKNOWLEDGMENTS
The author is particularly indebted to Professor Alan S. Michaels for his guidance and interest during the course of the thesis program, His criticisms and suggestions aided greatly in the interpretation and understanding of the results obtained.
Thanks are also due Professor T. William Lambe of the Soil Stabilization Project for his generosity in supplying the materials and equipment necessary for the successful completion of the studies on adsorption.
TABLE OF CONTENTS
Page
i. SUBMARY , 0 inane oie as ausiammas vis ou owes wos suse sis eo dss oss 1
31, ISEB ODUC TION. ou oo sna sis Tus v sina sisi nda daisies sisisieiniein eee oes 2
l. PUI DOSE, oa 200 sn aitinn sos sone donee sitions oneiensiess ss . 2a Pat WOT, sass iis aa saison vie soe oie ss oie eo sene veers 3. Proposed Study and Anticipated ResultS.esseeessos . T11., PROCTENIIRE 0s 05.9.5 5.5 5.5 330s Bs 94 2.5595 sib sin a wdenisiie ise rns 13
l. Base Exchange Capacity of Kaolinit@sseessesssssss 13 2. Adsorption of Ferric Iron by RKaoliniie...seesee 13
3. Adsorption of Hyamine 1622 by Kaolinite..sssssess 1h
IY. SE LS 4.60.09 0 ainisiis sinis in sie viele sins os uidais hidiiniseioinie vases ssnis 15
Ve. DISCUSSION OF BSnose snes nas sassenus sess se veniesessss 2
1s» Adsorobion of Ferric Irof...ssssreessssssssrens 2h
2+ Adsorption of Hyomine 1630...+vvresssessssvsnsoss 25
3. Error AN IS Se saassssassdesessnssseasns sons ores 25
bh, Mechanism of Adsorption on the Kaolinit€... 26
5. Relationship Between Adsorption and
Punlsion Solidi fieation..svsssessssssssses 29
vi, CON Ol SI OS nossa nies tsdonsse senses ssssessssnesssenesisnes 32
¥Irl. RONDAONS cu vrsinns ss sns sasassdo ass de ses esses sssns 33
viii. AD Ee uncsnnsvassnso spss ss se tosses sssesioesssssssesss 3h
A ANALYTICAL PRO URES. vs sn 0sa0 ss sansessnseaes sores 35
l. Determination of Base Exchange Capacity
of RO in EB. sinnnsnssnanssnaesssasaries 35
2. Colorimetric Determination of Iron....sseees 395
3. Determination of Hyamine 1622...00:0000s00 3
B SAMPLE CA LAT ION ss srsnsasnvdaasnssennseessenssne hl
C LOCATION OF ORIGENAL DATA. ..usvvseessssviassssvesy U2 D SOT, ANALY SES a uvis non vienasisinine sn nessses senses sves ee h3
LIST OF TABLES
Table Title Page
1 Base Exchange Capacity as a Function of
Grinding BRE, cv v0 009090 srs smivassiviaio se dee sls 7
Iz Adsorption of Fet+t by Kaolinite (L188 Hour
Time 0 19
TIT Adsorption of Fe*** by Kaolinite (No
Time $80) ss aiaie 0 sinner a a a 20
IV Adsorption of Fe**t by Kaolinite (Acidified
BAYILLONY , or sans os svanpsieaivhws sa dviie dns 21
V Adsorption of Hyamine 1622 by Kaolinite....seoeess 21
Vi Per Cent Adsorption of Fe**t by Kaolinite, .e0esses 22 VII Per Cent Adsorption of Hyamine 1622 by Kaolinite... 22
VIII Adsorption of Hyamine 1622 (Qualitative
LIST OF FIGURES
Figure Title Page
3s $31icon Telraheluol.. ses svissrersnvssvansvesssnves HN
5 Hydrated S11ica Sheet. cous isusssnusaissnsvenes oH
Aluminum Octahedroni. asses vvnvnsssdnsdsasnsssesnans|5
| Bibbaite Sheek... dhvbsnvsssvenveisssnnasssvdscsresins 5
; Baolinite {Side VieW)....ievvsssvssvnaessansasnnse: 5
5. Adsorption of Tet by slay. iiic sibs tndvasonsiviae 8
2. Oil in Falter Bmulsibniv. cesses svnsaviasnnssassnaes 119
E. Electrostatic Bonding of Emulsion and Clay...sss.. 10 3. Adsorption Isotherms for Ferric Iron...c.scsvisvns 16
10. Adsorption Isotherm. sssssensnssnnisnsnsenssenren 0g
11. Par Cenl Adsorplion of CotionS...csevesnnsvasess LB 12. Mechanism of Iron Bonding with Clay SurfaceS... 27 13, Colorimetric Iron Analysis, Calibration Curve... 37
1. SUMMARY
A problem of increasing importance at the present time is that of soil solidification. Among methods developed to effect the solidification is one using various resin emulsions (20). It has been found that pretreating the soil with cations, such as Fe***, markedly influences the strength of the solidified soil-emulsion mix,
The purpose of this thesis was to investigate the adsorption of ferric iron and a quaternary ammonium halide by clay particles, with the objective in mind of finding the relationship between the adsorption mechanism and the strength of the emulsion solidified soil,
The adsorption was measured by calculating the difference in concentration of cation solutions before and after their addition to
weighed amounts of clay.
It was found that in the adsorption of the ferric iron and the quaternary ammonium halide, the maximum amount of either cation ad-sorbed is less than the amount that could be picked up as calculated by the base exchange capacity of the clay. For the ferric iron, it was also found that if the clay-solution mix was allowed to stand for 118 hours, there was a greater amount of ferric iron adsorbed than when the solution was in contact with the clay for only a short time.
The conclusion reached was that aggregation of the clay takes place, forming shielded regions where no ion exchange can be carried out, thus keeping the clay from adsorbing the maximum amount of cation that it should be able to adsorb. The greater adsorption of iron over
a period of time was held to be due to diffusion of the ferric ions through the outer portions of the clay aggregates into the interior,
where they could then be adsorbed by the previously unaffected clay.
Recommendations made in the light of these conclusions were that the effects of aggregation be measured by calculating the adsorption under high speed mixing of the clay. This would break up any
aggre-gates as soon as they were formed and allow the calculation of
ad-sorption effects with aggregation eliminated as an influencing factor, It was also recommended that the emulsion stabilization technique be
applied to the clay so as to find if there are relations between the
adsorption of pretreatment chemical by the clay and the optimum
II. INTRODUCTION
l. Purpose
Both in war and in peace, the foundation of any nation is quite literally the soil upon which it rests. No operation of any sort can be conducted that is not ultimately based upon the physical properties, either structurally or chemically, of the earth around us. The specific problem of soil solidification is encountered in many varied fields. Not only is it of vital importance to the military, where transportation is a pressing factor, but it is of primary interest in many civilian uses, such as oil-well drilling, road-building, foundation supporting, and
air field construction. Whereas much work has been carried on in the past from the aspect of civil engineering, very little has been done to achieve an understanding of the relationship between the physical and chemical properties of soil. Only in recent years has there come an appreciation of the value of knowledge concerning this relationship; and only lately have these properties been utilized in soil
solidifica-tion (19).
The clay minerals, such as kaolinite and montmorillonite, are found in varying amounts in many of the soils encountered. It has been found that these clays, even when comprising a small fraction of the total soil weight, markedly influence the soil properties. Thus, it can be seen that by attacking the problem of soil
solid-ification through the study of the clay minerals, one can be reasonably certain that any experimental results obtained will give a fairly clear picture of soil behavior under similar circumstances. The purpose of
of kaolinite with respect to ferric iron and a quaternary ammonium
halide called Hyamine 1622,
2. Past Work
In the investigation conducted, the material studied was the clay mineral kaolinite. It is felt that a brief outline of the nature of this clay will prove to be helpful. Kaolinite has the
chemical composition Alp04°25105°2H,0. The crystal structure, as
determined by x-ray diffraction, has been shown to be more compli-cated than the chemical analysis would indicate. It is easier to visualize the nature of this structure by first showing the basic groups that combine to form the final crystal lattice.
The silicon of the clay is found combined with oxygen to form the silicon tetrahedron, which has a net negative charge of = l. This is because the silicon atom shares a total of four electrons, while the attached oxygen atoms require a total of eight electrons
for saturation.
oO oxygen + silicon
Figure 1. Silicon Tetrahedron.
These silicon tetrahedra, being unbalanced, are found only in the form of more complex but electrically balanced structural units called hydrated silica sheets. They may be considered as condensed tetrahedra in which the vertex oxygen atoms are replaced by hydroxyl grourc,
0 oxygen
» silicon
® hydroxyl
Figure 2, Hydrated Silica Sheet.
The aluminum of the kaolinite is found combined with six hydroxyl groups to form an octahedron. This has a net negative charge of -3 due to the hydroxyl groups present requiring a total of six electrons to achieve saturation while the aluminum can share only three electrons.
®
e aluminum
© hydroxyl
G oO
Figure 3. Aluminum Octahedron.
The aluminum octahedra, being electrically unbalanced, are
found combined in the form of a somewhat condensed sheet called the
Gibbsite layer.
) e¢ aluminum
© hydroxyl 7 t
© Qo wr “ - &
Figure li. Gibbsite Sheet.
Kaolinite can be considered a combination of the hydrated silica sheet and the gibbsite sheet, being formed in layers com-posed of a hydrated silica sheet combined with a somewhat distorted
gibbsite through a sharing of oxygen bonds (3, 11, 12).
e aluminum
+ silicon © oxygen
© hydroxyl
Figure 5. Kaolinite (Side View).
From a consideration of the crystal structure, it can be seen that the kaolinite is neutral electrically only if the sheet
is infinite in extent in all directions along its plane. Since this is an impossibility, the particles of kaolinite possess unsaturation
along the edges, counteracting the unbalanced charges at these edges
by adsorption of ions. This ion adsorption could be thought of as taking place in the following manner: The Si-0-Si groupings of the
clay (see Figure 5) are ruptured when the sheet is broken, yielding
an Si-0~ and an Sit* group. The Si-0~, possessing a negative charge, is able to attract cations present in the surrounding water so as to balance its charge. The sit onthe other hand, attracts a hydroxyl grouping, giving rise to the form Si-OH, with the HY that was
formerly associated with the water molecule forming a counterion of the diffuse double layer around the entire clay particle. It is
of course possible that the water molecule could split so as to
counterbalance the charges of both the positive and negative sites on the clay, but this is of no importance, since the HT is still replaceable by other cations in solution,
The cations, such as gr, Na™, and ga’? that surround the particles
of clay are exchangeable depending on the conditions. The number of cations that can be adsorbed by the clay determines what is called the base exchange capacity (BEC), or the number of milliequivalents of a cation adsorbed by a unit weight of clay (L).
However, besides the unsaturated edges and corners of the clay particle, there exist several other sites that could possibly serve for the adsorption of ions. On the surfaces of the crystal lattices there exist planes of oxygen atoms affiliated with the silicon in the interior, as well as hydroxyl groups associated with the aluminum,
This can be seen from Figure 5. It is quite possible that the
hydroxyl groups attached to the aluminum could undergo the reactions
A1-OH ==A1-0" + H', with the hydrogen being exchangeable by other
cations in the solution.
With respect to the silicon, we could have:
Oa - OH OH i gr 0” H'
51 8% + HH = 51 BL = Si Si ’
with the hydrogen ions so formed being similarly exchangeable.
Both of the above mechanisms of formation of exchange sites on
the clay surface are without a doubt a function of the pH of the
solu-tion. The A1-OH group would require an alkaline solution to promote
its dissociation, while the Si-0-Si group would require an even more
basic media, since it must form not only the Si-O" HY grouping but it must also break the silicon-oxygen bond in the creation of the
Si-OH (21).
A further consideration of the factors affecting the adsorption of ions will show that as the particle size decreases for a given
weight of kaolinite, the adsorptive capacity or base exchange capacity
will increase, due to the increase in number of edges of the clayand therefore the number of sites available for ion exchange. This is shown by the following table of base exchange capacity as a function
of degree of grinding (and hence, particle size) (13).
TABLE I: Base Exchange Capacity as a Function of Grinding
Clays: BEC:
100 mesh 8.0
Ground two days £7.5
Ground three days 70.4
The particles of kaolinite used in this investigation may be considered to be square platelets having, on the average, sides
8,04 long and a thickness of 0.024 (4 is one micron, or 0,001
milli-meter) (18). The analysis of the clay will be found in appendix D.,
At this point, a short description of the role played by the clay particles in soil solidification using anionic emulsions should prove helpful. The theory of the mechanism of the physical changes
taking place is as follows: To the clay (or soil) is added a tri-valent cation, such as Fet**t, which is adsorbed by the clay particles. It is possible that since the cation carries more positive charge than is needed at any one site on the clay, it not only neutralizes the net negative charge of the site, but by virtue of its polyvalent nature, gives the particle a net positive charge, so that the clay is now cationic, as shown in Figure 6.
Clay 2 eT ae Clay ( (=» Fef™
Figure 6. Adsorption of Fe*** by Clay.
This pretreatment with polyvalent cations is not affected by the presence of ions already adsorbed at the exchange sites, for the
ad-sorbed ions usually found in clays are HY, Na’, or ost, which are
exchanged by the trivalent iron by virtue of its greater positive
valence (1h).
Practically all of the emulsions now made commercially are stabilized anionically, that is, the stabilizing agent causes the emulsion droplets to behave as if they were negatively charged.
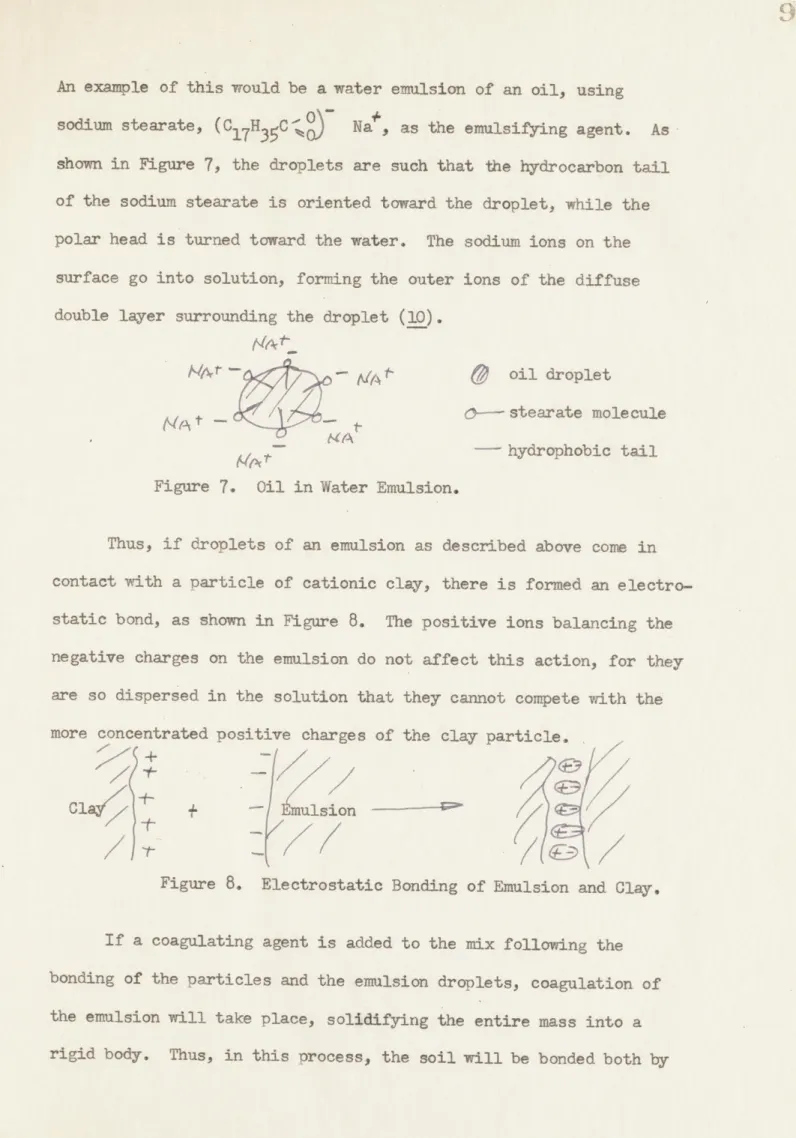
An example of this would be a water emulsion of an oil, using
sodium stearate, (0,050) Na’, as the emulsifying agent. As
shown in Figure 7, the droplets are such that the hydrocarbon tail of the sodium stearate is oriented toward the droplet, while the polar head is turned toward the water. The sodium ions on the surface go into solution, forming the outer ions of the diffuse
double layer surrounding the droplet (10).
Nets ~~ MAE {J oil droplet
—— stearate molecule Mat =: nl
‘“ — hydrophobic tail
Figure 7. 0il in Water Emulsion.
Thus, if droplets of an emulsion as described above come in
contact with a particle of cationic clay, there is formed an
electro-static bond, as shown in Figure 8. The positive ions balancing the
negative charges on the emulsion do not affect this action, for they are so dispersed in the solution that they cannot compete with the more concentrated positive charges of the clay particle.
7
Clay Sram ee oT Lf
Figure 8, Electrostatic Bonding of Emulsion and Clay.
If a coagulating agent is added to the mix following the bonding of the particles and the emulsion droplets, coagulation of
the emulsion will take place, solidifying the entire mass into a rigid body. Thus, in this process, the soil will be bonded both by
the electrostatic bonds between the soil particles and the emulsion
and by purely physical incorporation within the solidified emulsion,
The major drawback in solidifying soil by this method is that the pretreatment chemical and the coagulating agent are similar, both being polyvalent cations such as aluminum sulfate. The
co-agulating agent solidifies the soil-emulsion mix by neutralizing
the net negative charge of the emulsion droplets, breaking down the repulsion that exists between them and causing them to coalesce in
a solid mass.
Therefore, the problem in soil solidification using anionic emulsions is that while a sufficient quantity of pretreatment chemical must be added to change the charge of the sail particles, it must be
insured that there is no excess. An excess of chemicalwould act as
a coagulating agent, solidifying the emulsion as soon as it is added
and preventing the formation of the electrostatic bond.
In the investigation of soil solidification using the method
described herein, two polyvalent cations, int and ret, are being
used. Another pretreatment chemical for this process is a cationic quaternary ammonium halide with the trade name Hyamine 1622 (2h).
This compound, a monovalent cationic detergent, does not act as a
bonding agent by establishing electrostatic bonds, since it does
not possess the excess positive charge required. It has the simplified
form g + where Q" is a grouping of hydrocarbon functions attached
attracted to the negative exchange sites on the particles. This serves to coat the particles with an organophilic layer, which makes the soil oil-wettable. Thus, when the emulsion is added, the Hyamine pretreatment gives better adsorption between the soil and the emulsion. Upon coagulation of the mix, this improved contact between the soil and emulsion results in a stronger and
more uniform solidified structure.
3. Proposed Study and Anticipated Results
From the preceding discussion of soil solidification, certain results might be expected. Since soils have maximum values for their base exchange capacity, it is reasonable to expect that no more pretreatment chemical is needed than the amount necessary for
the maximum adsorption. Any cation in excess would be not only unnecessary but possibly harmful in that it could cause local coagulation of the emulsion before mixing were complete, giving poorer strength to the solidified structure of soil and emulsion.
Therefore, if it were possible to determine the adsorption characteristics of soils encountered, the emulsion solidification could be most effectively carried out. The soils would be pre-treated by adding only as much chemical as needed for optimum
soil-emulsion bonding.
Since there is no such thing as a standard soil, it was
decided to measure the adsorption effects of ferric iron and
Hyamine 1622 on the clay mineral kaolinite. As mentioned previously, small amounts of such clay often greatly influence the characteristics
of the soil of which they are a part. It is thus possible that the behavior of the kaolinite used will shed light on the matter of how soils in general will behave in the pretreating procedure of emulsion solidification.
In order to investigate the adsorption characteristics of kaolinite, experimental work was carried on from February through May of 1953 in the Soil Solidification Laboratory of the Department of Chemical Engineering at the Massachusetts Institute of Technology.
Attempt was made to determine the minimum concentration of
pretreatment chemical (both ferric iron and Hyamine 1622) which
when added to kaolinite, will give the maximum adsorption on the
III. PROCEDURE
1. Base Exchange Capacity of Kaolinite
The base exchange capacity of the kaolinite used was determined by the method outlined in Appendix A. The value obtained is in
sub-stantial agreement with that determined previously by other workers (21).
The value determined is 5,37 milliequivalents of cation per 100 grams of kaolinite, with an error of about *19%.
2. Adsorption of Ferric Iron by Kaolinite
To 25,00 gram weights of dry kaolinite in 250 ml centrifuging
bottles are added 150,0 ml portions of standard solutions of ferric iron, the solutions varying in their concentration of iron.
The clay-solution mix is then shaken thoroughly to allow for complete mixing, the equilibrium rate for ion exchange being almost
instantaneous (15). After mixing, the mixture is centrifuged at
1800 rpm until the clay settles out , following which the supernatent liquid is removed from each bottle.
Aliquot portions are taken from the solutions and tested for concentration of the ferric iron, using a colorimetric analysis (6, Appendix A). The difference between the total amount of ferric iron added and the total amount left after mixing represents the amount adsorbed. From the milliequivalents of chemical adsorbed per unit weight of clay and the concentration of chemical remaining in solution,
the adsorption isotherm can be plotted and drawn. It should be men-tioned that the samples of clay used were small with respect to the
clay carrying chemical out of solution by any means other than direct adsorption on the clay particles.
3. Adsorption of Hyamine 1622 by Kaolinite
The adsorption of Hyamine 1622 by the kaolinite was carried out using the same procedure as for ferric iron in part 2. The only difference between the procedures was that the Hyamine was added in total volumes equalling 100,00 ml rather than 150,00 ml,
The concen tration of Hyamine was calculated in all cases by the
IV. RESULIS
The complete set of data taken in the adsorption calculations is tabulated in Tables II through VII. The original work was conducted using 25.00 gram weights of kaolinite in all cases, but all data as tabulated herein is converted to a basis of 100.00 grams to conform
with the customary system of presentation. Figure 9 gives the data
of Tables II through IV in graphical form. Figure 10 is a plot of the data of Set Number Two of Table III and of Table V. Figure 11 represents the data of Tables VI and VII.
Since the experimental procedures as outlined in Section IIT are not quite those that were used for all runs, but represent the technique that was finally adopted and considered most accurate, some mention should be made of the modifications adopted. The
original technique consisted of placing the clay in 500 ml
vol-umetric flasks, adding the number of milliequivalents of cation desired, filling the flask to the mark with distilledwater, shaking, and allowing the clay to settle. lieasurements were then
taken as desired and the equilibrium concentration calculated on the
basis of amount of cation remaining and total volume of solution, the volume being 500,0 minus the volume of the clay added, The revised system consisted of that outlined in the Procedure, and
was the method used to measure the adsorption of ferric iron in
Set Two of the immediately tested samples, and for the adsorption of Hyamine 1622. The volumes of solution used were as indicated in the procedures. The adsorption isotherms calculated using the revised method are shown in Figure 10,
1b
. : oa { HERE Fo
$i i 7 oo pr rrE EH E B ~ wrt spell EEE
- = pray 24 = -4 rrr rrr rT ie as HHiBTa TET os cl Heep WHR
Ed 1 44 i” 2 bt HH ; 2 ZH = 1s TE St Sei. de WE . 5 > phn og pe . SHH i iz - Z a: HHH ; 3 + a 3 THT HHH ! rt : N= WTR AN TT SERRE WRN RE SY RRDRTM To i] ! Hl
HER Dynes LOND IOUTHERNS FOR HERALIL ION Cee TH
2 : . ) ri. HE HH
cw de ed fe 2 E23 Hr ee T 0 1] HH : SHE
Heh Ste BAIE/SR LL Rig Bo 5
rE eh re A ph
+ 1: 5 -: ppd Hi —- ; Steel |rt = wo + a TEE T= (ion - il i 1 1 — oT 1H : godt HC y =p rr HEE rrr HoT 2RO Ee a eg
44S | OITe 4 3 RED | |.EP Se f
ER: WY LAL 4 oJ er 1 Sh 0€ o
i Hour Tims Lag. Set ©
® HO TnaayWAN
i Terie sts Pani py Sek - Ems nine Cl it al Us 4 “a bl [182 4 Sw a
2 E tt SH HEHE HTT I] 5
= fetty a i BL. a = N ~ ble of rion Ca [a a = AFF + ms i med LE El he Testl deg LIC » [148 |a a sdb ES
sf Casas oln..hS tone
tos HHH ' LELLLe0 Q0LMely £0 OBL ; 7
2 ; 7 ’ a : wel i Hae of I~ . yo IV ™NG © a ” 3+, + Hd righy ” + LJ i : 1 fi hd 2 1 Tv 1 J L \
HL / TN
. ho 2 N J. Hy \ . a ONC : Ny + ‘ hb INE . \ = 52 a Ni: 2 Tm E ox NT wr t ot I TIN | I Hm \ i rH Zz : T N . A Hh 7 ES , HN rf RRR f i: Thm iN PE # HT Se (uy +H =f) : be ar Eh fiHE Wh,
st LL TEE / Sr : yr Cy PHD Hl . Fo. -LE ; = HT | r SH 1. !fe HE
al ; HH. a = ooyl Hira ata = Z SO wy de o a = air abt E , Hm RT Z : x sal - “r—o =4 ay = : ) Ly i = CT —0 em ph 2 I ik, Tos 1 we pr EEEEE EE 2 1 EET SteerBT 4 eT 4
-J ~ +++ I =f y ~ oh
HEE ; |+ re 4
r 0
, fis 5} 5 4 - + te +:A
FER a 2vo HH 4 } Ja +
FHA:
tir He = ;
rs PO hey as +t Atri hd Ai pend HH, peti mbt blebs arpa dg pt I. +
' Ta | 3 rrr fo LTE +f tn tt mterfeste t + He 4 a=3 ans: y rr gee TE ee pr egy ete tr pS TL
¢ | 10x10™2 +E yg yl seam
oo FAERIE, HT Pet HT4 ml ww I
y } 3 r=
. 5 lo oy : | a tana ann | Sith me geld 13s TUTTI wile la tape mS Sr oy
Han 1 © P1om To ae € ntrat " Oo A MB A Fa tt of 1 Ler (1 MEX Fe | = Mi jE 10” 7y. Ho HH
+ =
xs Tf- tT
Fox: fay
Ts
HHH i [l n
opp 3 De sh yr ] Lin ye Base Fixe hang ol Canged br of K aolinite- : : 5
HEHE m .. Hasned lines HageHXChARge MAPA Of PEC IMIS Cos SORE a creel
SHEE + CRGSTEORERS 8 Se ARE iy
HH un tg oh 2k : ; rere PEPE PH He «os - ig A Sn EE tL Sole x ~HIHHD: LN pup fmnnE Ha
: TE PET 1 HEH HEH EH 1
Tr : HH T rr Ems H 3 I Sig rr } +
my IE He
v - TE ir = ie TH oo Exdas III FE Tre ire, EE 4 | )8 kie©| : =~ th Ee
. =x } Ie ee wiv oy hts: Lym : Se he oT HT 7 t= 3 Zoe per pe fe = rt i J fA Fo 8 HF 2 HERTS ay al, BEET oeJed : FH -35 HH LerTT TT U, . Bi RoR itor 3
ws HHH | EENEERARE EEA € yi / HHH HHH "rr rr y HP HEE HH ERE EH> vi rm ee 4 SE 5
rps “ B Wire Te TH : en ISL : = so= i : - op , = -Fi o A Be .
HHL reat | iy
i. _. 2a 2 BE r RTE TH! Ka HE I 2 CUT5 = rT SRT =
TI I rr Ee) Epo i od A A doar votI A ture Ht Li Er ppirria . ; To ot inks _
Ir LEGEND ted ¥ deity lbly Mra He a 2
+ Saks WE : : Si TH+ Z: z oo Lr rr x = : 3 _
: , A Tsotherm for yamine 1622, immediate testing. Bot a at HL
i LC) ails 3 { [3 =a Bad I XE ED 2 UTES CL 24 LSD eS in x ~ 3 hal Jo allan a WS Se - iin oe hd od h
Ee Serna. Siidatinn. o )
. & art . Nn Sh . Nene a, I : .
5| awn) lll 3% gr
iF! ry |] 1 ! fete Ee Fir ) a Fel | +5 3
‘ v r A gga LX : Lg ped LL F110] ~
Tle 0 Teatherm for Ferrie Tra 11 TA =y : ) 4 HH % sh O Isotherm 1or rerr: 8 1rod, Liisa } , a or =-U 1 Su { 4, ¢ Sn ie He - on bbe TT
1.0 Had, wT BEER
if ry } oe Y=®7m=31-12oo)ete
TE 5wi
3 AMS ADDR AR | Te
f+ HEC nT re dy At oh [ADSORPTION ISOTHE AMS
ir wre TE eae tes ] 0
; 13 : oo . MWeRs 1 5/15/53 |
: - - oo PL : ) —— - ee Ne ca
Er re ren eed Cor
6 - ] oo ETre Thotedei=t TVET ey my A PES SE ET Th ' Toe pryTeno ffi mmm mb embed h Hr
10 ) } r. . mn i iPTT 3 Feet ETt TR Th, 7.
. oo Lit dT - . x EE i i is a o . as
’ Lo 2 taal|itTaEdhyn|Habe}NESBA»BTMROaLergb%i
riumConcent:ationtime10°, Millfequivalents| (MEQ) of Cation/Lit ghee
‘RB
FO rE 1 Y TTT St rp CHEN
I pee oo. 1 | ) ETON HAR AAP TANE HEHE HEE
SEENENNS Ha CT Trees 1 DER HEN ADCSORPETON NE oH ONO - HH: - RE COHN A a ANE orl TH
HH ; HEH ; EEG REN THERA LUN FTTH 4 He Sh Thon- i rat At! : — TY Sc : / ey LA - =r
HH 3 ~ mr a —— TRE arr Ao rT tei + f SSS an
EH yt WW. Roi sass | Miso oo. Sans
ort x We TH Fy fd Sy LE ES Fr IT T Ht : HH
ITH 1 @ dbe [1 Te ef i HH 6 IEE RENEE En TT
HHH - \ Ere er TE PrP ro rr ~ HHT=k . Xx I thr Err rr IT
-HH ) TF Tr a am -HH
Fri H TT HR Lo mum
EE 1 v tit Lie rot FH et it Lan 0 1]
Io rere LH ATT HE HT ee : HH TT mi HEE ER EE HEEET Hd. gen
CT : —— rrr TEE i I : - 3 EF TOT mH 5 BI Tr . LL TT mp er on chy eh HAH
A hh HE el HE A Ada
JA A Tr Sy Sgt Tey Les 5 CLA wm ae em] LOO or kaolinite,
HH a Hyamine 1622 (LOO ml se I Ly
EH : A TT she 4 real mr OY 1 nda)
a A AHHH, Ly Ts S00 m) eat «7 LOO Fm Kaolinite
: i _ +1 on H 1 HEY TT Fay 1€ LYON QUO RL oO LIL g 7 ZR RD 3 Hr Fo' i in 1 Hy H+ HHH © Ang & 2 CREE TTL a i i
HH at = RAE oo a EE HEH el
SlyLIp5gtHooooHaitCHHEHHo
rari 1 : : eid 1 ST : re nH Ch
Tug 1 y Sr TTT 1 BE RIL] ToEREARRESEEREE
— + = : } = =i FTTH 7 | = TTT, HH HEHE HHH + HHH
) rr] br FH Tir
0 Ter \ ent Th pet ’ tar ebb HEH
: ' He ee EH 11 TI
Sn EE
1 , bie } : + {ithAh "EEE
Ar {=} Le sorte 3 +1 ++ A - obey 1 + + gtMERE GE 4 A
Cole ee 1 . pr - nt + i SEE ' tr HH Han: g =r at 1! Ti. ry 4-4 =2 DoH. apd oo HAH alto
: 3 He TF He . I | Hr ope a - 11 i - HHH bette T= . NT H+ 1 15 rere hrf Darl -= thr ry -=-= 1 Be mf — Shaw, \ fe 7 i et pil gE 1 \ 11 3 5 no = a ! * edb et ST v 7 : : 5 Lh tre ] ne A 4 HHL] +t od T+ TN “i dE N 7 - ar . +15 1% 5 ddd ; HH IN Ly REY f ' Xt . 1 I: +N ) ~a HHH i ed hy Coolie 1 or Li; a 4 | ++ : a pris AN g :
len Lor HT = A Tri ty ==
J ? 2 Co rast HIE
HE 3 bp TX FETE : TI
He Te TH Go =\ + + ce dl hE. Hh 1 pH Ha TINE TIT HT TT tri 7
HH oi rr ++] Hi 11 Co 44 Cre Hit RE ii 1 ~+ER HTH = Ho Te 2 3 Fr HY ! tr HEH bt TN By Do HEHE I I oT i) Ne, SEE HE . 5 HH TL LL = STE . all, Wt Ir I 1 HEEERENES
os iE X HINTH atelerrkPHEH
Bi ¥ ne It EEE5 =] 14 3 TN go det ATELY 6 Si ! DOANE ANNES MEEE
Ho ou a) NT eee Anne] HT er +1 9 TIN 44 Sheed ppl
Shad Hr dhe aH ING fa RH Shh
: PDL HT TET Ea ™N- so 105 HHH r Lot E WG EEE Tots : 1H eta 7 N- , Ee Hn ah HC [Ir Is { ty A Io ana HH } TE wh 1 “ores HHH +r. On. ot i ps, is TT thy : Ie hr HE bs TIN a RT ey Het im, 2% NT TD . 1] i iL esa i fro Th VT - "2 HHa = FT ~ -H i ERaREEL Nr i to 5 hr : . HH rr I 1 + ye GERRT ER] 8 aes — 5 HN Why Sl : 3 i 3r ; 1 rh ekki Fans HE Ti a ) Ct pH i rr i 8 8 Hy 8 HHH HHH T i Hr HH go SIN: SOE 4 1 ttt 3 Th t : HH i 5) ES I3 = SE LING IN; iF rt rH FN TN. 1 Th FH S38 Hyeodh ey; Hh 7 INT "Na i; HHH fr ™N + INC iRREE SRR = = HH Ti ar * Pie toy . HHH 1 . TT % HHH . Hog om HEE me > Th HH TNT HTS HHis od HHH =I = J + HHH\o Cop 1 SL + ass vp fiat fe rH i G FT Tee 1 HHH i Et TT + Frith ; HE Co 4 pH~ 2p. ot {HHH 3a | Ty rrr LH 7 or HEE HHH : a Hy ER HH HHH HH
HH aan ar Sadr bhp i SEE HH as EH] HHH LL eH is tet 5 igh - + ) i + ; HHH HT 4 HH J
. Mt oo oo rrr CER tr ee pa A) 5 Ht oot 1 89 HH
arms ERS Eer en Het HEE EEE HHH Z EHH TH
HE tin EASE EE
THE 1 TTT H ttre “HITT ESSE ESS tH gait rr er He He
HHH Hi Hy HE HH HH HE i FER BESEEEAEENEASENI BONEN USERS RENNER HHH Hhsean : . th : ! HL T Tn
3 ET at Cony RL tit . TH 0 HH HHH 1
+ LITII 1 IT bt fai Edi viet]
HE MET Ee pra ma a A EE pnALledper100dmof|Kdelinite
THEE p Ag VE =] ip Bgulvailents of tation AUREC 388 dh sebabusns: basses RT
: ty. TH EE RTE HT A nia FH THT 3 IT] 8 FH rTsessed 80 H- 1 Hr THT if Ly, HHH TP HEHE Te HH ry HH HHH HT Raaaasansaanh opis! 2 HH 1 HE HH RE © TE TY It hE ] ' +++HHH t HH pm IEE SERS SAREE AEEEE ERNE REARS ANS 0] J iT
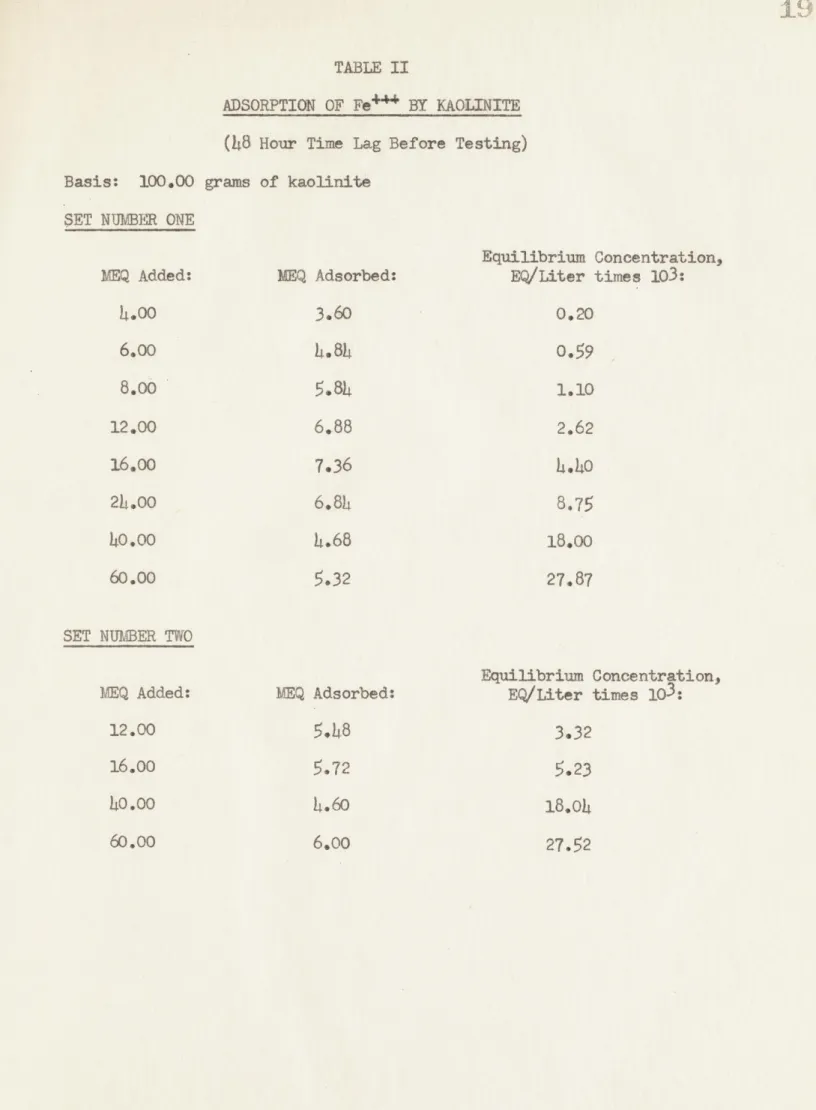
TABLE II
ADSORPTION OF Fe'** BY KAOLINITE
(48 Hour Time Lag Before Testing)
Basis: 100,00 grams of kaolinite SET NUMBER ONE
Equilibrium Concentration,
MEQ Added: MEQ Adsorbed: EQ/Liter times 103:
11.00 3.60 0,20
6.00 La 8hL 0.59
8.00 5.8L .L.W
12,00 6.88 2.62
16,00 736 L.LO
2L1,00 6.8 8,75
140.00 1.68 18,00
60.00 5.32 27.87
SET NUMBER TWO
Equilibrium Concentration,
MEQ Added: MEQ Adsorbed: EQ/Liter times 103:
12.00 5.48 3.32
16,00 B72 5.23
10.00 1.60 18.0L
60.00 6,00 27.52
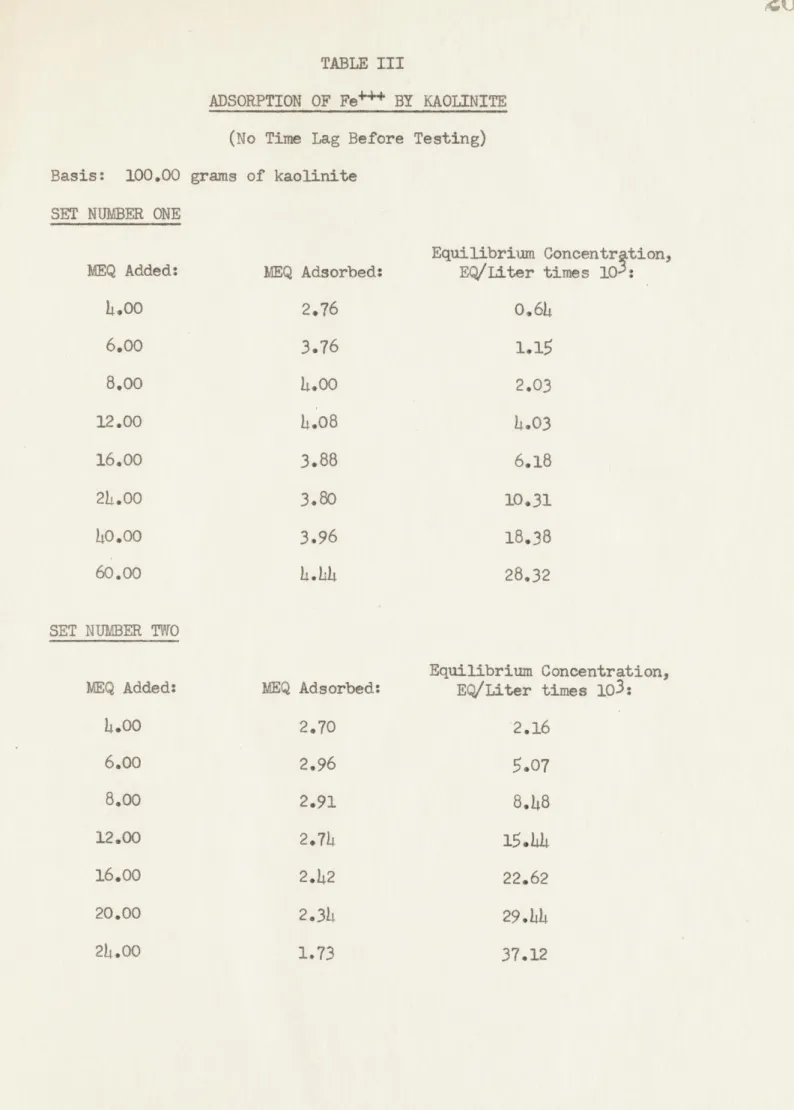
TABLE III
ADSORPTION OF Fe*** BY KAOLINITE
(No Time Lag Before Testing)
Basis: 100,00 grams of kaolinite SET NUMBER ONE
Equilibrium Songentr gion,
MEQ Added: MEQ Adsorbed: EQ/Iiter times 10-:
1,00 2.76 0.6L
6.00 3.76 1.18
8.00 1.00 2,03
12,00 1.08 1.03
16.00 3.88 6.18
21.00 3.80 10.31
10.00 3.96 18,38
60.00 hhh 28.32
SET NUMBER TWO
Equilibrium Concentration,
MEQ Added: MEQ Adsorbed: EQ/Liter times 103:
1.00 2.70 2.16
6.00 2.96 5.07
8.00 2.91 8.18
12,00 247k 15.Lh
16,00 2.42 22.62
20,00 2.3 29.Lk
211,00 1.73 37.32
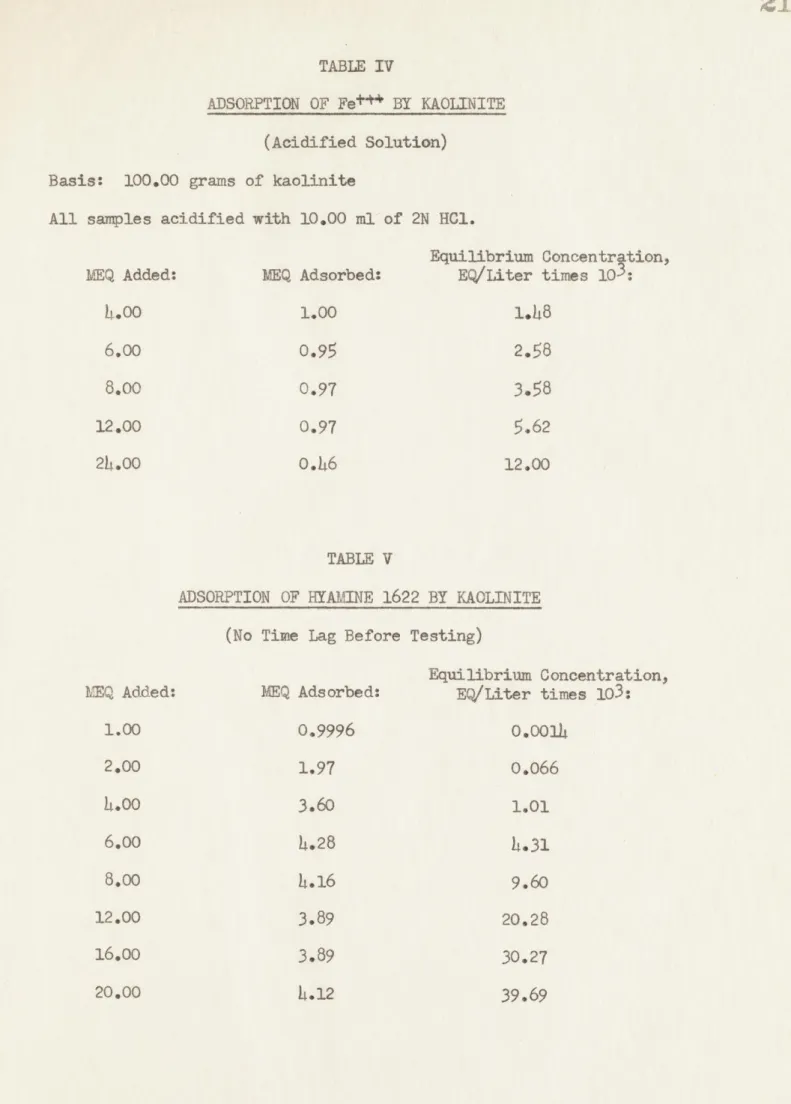
TABLE IV
ADSORPTION OF Fet**BY KAOLINITE
(Acidified Solution)
Basis: 100,00 grams of kaolinite
All samples acidified with 10,00 ml of 2N HCI.
Equilibrium Joncenirgtion
MEQ Added: MEQ Adsorbed: EQ/Liter times 10°:
11,00 1.00 1.48
6.00 0.95 2.58
8.00 0.97 3.58
12,00 0.97 5.62
211,00 0.46 12,00
TABLE VADSORPTION OF HYAMINE 1622 BY KACLINITE
(No Time Lag Before Testing)
Equilibrium Concentration,
VEQ Added: MEQ Adsorbed: BQ/Liter times 103:
1.00 0.9996 0,001
2,00 1.97 0,066
1.00 3.60 1.01
6.00 he28 ha31
8,00 h.16 9.60
12.00 3.89 20,28
16,00 3.89 30.27
20,00 L.12 39,69
TABLE VI
PER CENT ADSORPTION OF Fet*+ BY KAOLINITE
(No Time Lag Before Testing)
Basis: 100,00 grams of kaolinite
(Values given are for Set Two)
MEQ Added: % Adsorbed:
1.00 6746
6.00 L9.2
8.00 36.4
12.00 2248
16.00 15.1
20,00 11.7
21.00 2
(Vol. of soln. for all samples =600,00 ml)
TABLE VII
PER CENT ADSORPTION OF HYAMINE 1622 BY KAOLINITE
(No Time Lag Before Testing)
MEQ Added: % Adsorbed: 1.00 99.9
2.00 9847
);,00 89.9
6,00 Ti.2
8,00 52,0
12,00 32.4
16,00 2he3
20,00 20.6
TABLE VIII
ADSORPTION OF HYAMINE 1622
Below are qualitative observations that were made with respect to the appearance of the clay-water mix when it was subjected to centrifuging to settle the particles from the solution. The scale of turbidity
is purely arbitrary and is given only for sake of comparison,
Appearance of solution after MEQ Added: % Adsorbed: addition of Hyamine:
1.00 99.9 Clear
2,00 98.7 Milky
11,00 89.9 Turbid
6.00 71.2 Thick8.00 52.0 Very Thick
12,00 32.6 Very Thick
16,00 2ha3 Between Turbid and Thick 20.00 20.6 Between Milky and Turbid
Note: The first, second, third, and eighth samples were centrifuged
for 3 hours @ 1500 rpm before settling was essentially complete. The fourth, fifth, sixth, and seventh samples were centrifuged for 5 hours @ 1800 rpm before settling was essentially complete.
V. DISCUSSION OF RESULTS
1. Adsorption of Ferric Iron
In the adsorption of ferric iron on kaolinite, the results obtained indicate the following: In the samples that were allowed to stand for L8 hours before testing, the amount of ferric iron
ad-sorbed for any run was greater than that for the runs that were
tested immediately, as shown in Figure 9. There are two possible explanations for this greater adsorption. It is possible that the adsorption of the iron by the clay is one that is not instantaneous but is a function of time, the adsorption increasing for greater periods of contact time between solution and clay. The other
possibility is that the iron is not leaving the solution due to ad-sorption alone but also due to formation of insoluble ferric hydroxide by hydrolysis or of iron complexes on the surface of the clay. Either
of these would cause more iron to be taken from solution than would
be removed by adsorption alone. It was thought that acidification of the solution would tend to nullify the effectiveness of these latter reactions, so adsorption of iron over a 8 hour time interval was measured when the solution was markedly acidic (pH of 1). As
shown in Figure 9, the subsequent adsorption was greatly reduced,
in fact far below the value for samples tested under any other conditions. However, this does not prove anything conclusive about the adsorption over intervals of time, since the acid evidently not only prevented hydrolysis but also decreased the adsorption of iron by building up a greater amount of Ht ions than of Fet++ ions, thus
affecting the adsorption relationship.
the isotherms are noticeably lower, and at no point do they indicate
adsorption greater than the base exchange capacity of the clay. The
lower of the two curves for immediate testing (see Figure 9) was the one calculated by the revised procedure. The difference in the heights of these curves is possibly explained as follows: The revised
procedure involves a solution volume of 150,00 ml per 25,00 grams of clay, while the original procedure involved a volume of L90 ml per 25.00 grams of clay, Thus, for the same original amount of ferric iron added, the original method gave a concentration of the iron that
was three times as dilute. From a consideration of the solubility
product of ferric hydroxide and the hydrolysis equilibrium of ferric iron, it can be found that for equal time intervals, the more dilute solution has the greater per cent of iron going out of solution as the essentially insoluble ferric hydroxide. Therefore, in the time the iron is in solution and mixed with the clay, the original pro-cedure has the greater chance of losing iron as the hydroxide and having this loss ascribed to adsorption by the clay. For this
reason, the lower of the two curves was considered the most reliable and was therefore the one on which the curves for iron adsorption in
Figures 10 and 11 were based.
2. Adsorption of Hyamine 1622
The adsorption isotherm for Hyamine 1622, calculated by testing
the solutions immediately after mixing with the clay, is shown in Figure 10. It indicates a maximum adsorption value at almost ex-actly the same equilibrium concentration as the maximum for iron adsorption. However the value of this maximum is larger than that for the iron pickup. The relative magnitudes of these maxima are shown with respect to the calculated value of the base exchange
capacity of the kaolinite. From this it would appear that the greatest amount of either cation that could be picked up by the clay, while of a definite value, is nevertheless lower than the maximum that could supposedly be adsorbed as indicated by the base
exchange capacity.
Figure 11 shows the relationship between the amount of cation added and the per cent of this quantity that is adsorbed by the clay.
It can be seen that on addition of amounts of cation equal to the
base exchange capacity of the clay, the per cent adsorption is about 5L% of the total for the iron and about 78% of the total for the hyamine.
3. Error Analysis
Insofar as error of measurements is concerned, the results for
iron analysis are accurate to about t j%, while those for Hyamine 1622 analysis are accurate to about£1%. Over the range of interest, which is the range up to the equilibrium concentration at which maximum ad-sorption takes place, the total error does not become greater than
*10%, but for large values, where the amount adsorbed is calculated
as a small difference between two large numbers, the error becomes
appreciable.
i, Mechanism of Adsorption on the Kaolinite
From the results of the adsorption calculations for ferric iron and Hyamine 1622 on the kaolinite used, the following explanation would seem reasonable in picturing the mechanism of the adsorption. As originally postulated (see page 8), it was believed that the iron adsorbed on the clay particles would be picked up to the extent of one
atom of iron for every negative charge available on the crystal lattice of the clay. This would therefore have meant that the clay would adsorb three milliequivalents of iron for every one
milli-equivalent of a monovalent cation that it could pick up, or an
amount of iron equal to three times the clay's base exchange capacity. However, as found in the actual adsorption measurements, the number
of milliequivalents of iron adsorbed was less than the base exchange
capacity of the clay. Similarly, in the adsorption of Hyamine 1622,
an amount should have been adsorbed equal to the base exchange capac-ity of the clay, since the Hyamine is only a monovalent cation.
Here again, the expected amount was not adsorbed.
In the case of the iron, the most probable explanation for what happens is that the iron not only is adsorbed at one site on the clay, but also bonds with a second exchange site on another particle, as shown in Figure 12.
Clay’ Fett + ©) Clay —
Figure 12. Mechanism of Iron Bonding with Clay Surfaces.
However, even if the above picture were true, it would not be a complete explanation for the limited adsorption of the iron,
If the complete charge on every iron molecule were utilized as
depicted, the total adsorption would still be equal to at least the base exchange capacity of the clay, since that is the number of milliequivalents of iron that could be adsorbed. However, in the process of exchanging the ions present on the clay particles, an accompanying phenomenon that is known to occur is aggregation of
the clay. This aggregation is due to the breakdown of the forces
keeping the clay particles dispersed, namely the negative charges
on the surfaces. Since the ferric iron has counterbalanced these charges, the forces of repulsion are decreased to the point where the clay can flocculate. The aggregation of the clay is most likely
furthered by the clay to clay bonding of the ferric iron, which
would "cement" the particles in the formation of the aggregates. It is thus possible that these aggregates would have their exchange sites in the interior shielded by the outer portions of the aggregate, pre-venting the adsorption of iron on these blocked out sections. This mechanism would account for the further limitation on the adsorption
of the ferric iron when it is added to the clay.
The Hyamine on the other hand, while it could not bond the clay particles by electrostatic charges, nevertheless could cause aggrega-tion. This is by virtue of the fact that it has coated the clay particles with an organic detergent, which would make the particles have a greater affinity for each other than for the surrounding water. Thus we could again have this shielding mechanism as a means of pre-venting the clay from adsorbing the maximum amount of Hyamine. That aggregation of the clay treated with Hyamine took place is shown by the observations recorded in Table VIII, where the quality of the clay-water mix was seen to be greatly affected by the relative amount of Hyamine added. When added in increasing quantities, the Hyamine caused progressively greater cloudiness in the solution. This indi-cates that the Hyamine discharged the repulsive forces between the clay particles, causing them to form aggregates that increased the cloudiness or turbidity of the solution.
An alternative to the proposed aggregation theory can be found by considering the mechanism of the ion exchange on the clay particles. The base exchange capacity of the kaolinite was calculated using a
cation other than those of ferric iron and Hyamine 1622, namely Mgt
(Appendix A). It is quite conceivable that the exchange capacity
calculated for one cation is not at all the same as that for others,
being different due to factors such as size and valence. Thus, while one cation, being quite small, would be adsorbed to a great extent by the clay, another of larger dimensions might by virtue of its size be prevented from effecting as complete an exchange, since it could not come in contact with many of the exchange sites available to the
smaller cation. This would mean that the calculated maximum values
on the adsorption isotherms were not less than what they could be, but represent the true maximum that could be adsorbed under any con-ditions.
In the light of the proposed mechanisms, it is possible to ex=-plain the greater adsorption of iron by the clay when the time of contact between solution and clay is greater. Over longer periods of time, the ferric ions in the surrounding water have a chance to diffuse through the outer surfaces of the aggregates and become ad-sorbed on the available exchange sites in the interior. Or, if the second mechanism presented is the more significant one, then the time effect on adsorption could be ascribed to gradual rearrangement of the molecules on the exchange sites, resulting in a more closely packed surface having more cation adsorbed than originally.
5. Relationship Between Adsorption and Emulsion Solidification
attention is being focused on an emulsion entitled 1257-15C, an isomerized glyceryl ester of rosin produced by the American Resinous
Chemicals Company (1). From the work done, the following facts have
been found: In preparing the soil by adding the pretreatment chemical to it and stirring by hand, following which the emulsion is added and coagulated, an optimum amount of ferric iron pretreatment was found that was equal to 1.20 millequivalents per 100 grams of dry soil. This gave a tensile strength to wet test bars of 123 psi. On the other hand, by mixing the same pretreatment chemical with the soil
by means of a high speed Waring Blender, the optimum pretreatment
quantity was found to be only 0.Lh8 milliequivalents per 100 grams
of dry soil, and the wet strength was raised to 559 psi (20).
This means that for high speed agitation of the soil-emulsion mix, greater bar strengths were obtained at an optimum pretreatment level less than that for hand mixing. In the light of the previously proposed adsorption mechanism, this would indicate that to a certain
extent, the high speed mixing might possibly be breaking up the
aggregates formed by the ferric iron, causing the iron to be more completely and effectively adsorbed, and giving a more dispersed
soil mass and more uniform bonding with the emulsion,
A further fact of interest with respect to the emulsion solid-ification is that of four pretreatment cations used’ every one was found to have for its optimum quantity a value less than the base ex-change capacity of the soil used (20). This is a reasonable result
The chemicals used were: Hating1022, ferric sulfate, aluminum
sulfate, and "Quilon", the trade name for an isopropanol solution of stearato chromic chloride,
in the light of the adsorption relation shown in Figure 11, where it
can be seen that when cations are added to a soil or clay, they are
not completely adsorbed unless added in small quantities. Thus, if the amount of cation added is too large, its fraction unadsorbed is correspondingly large, and is left in solution to coagulate the emul-sion (see page 10). This indicates that the upper value that is placed on the most effective amount of pretreatment chemical is that point at which there is a sufficient amount of chemical left in solution to harm the uniformity of the soil-emulsion bonding by local coag-ulation of the emulsion.
As previously mentioned, it is possible that flocculation of the clay or soil particles is cutting down the quantity of chemical that can be most effectively adsorbed. Therefore, in adding the pre-treatment chemical to soil before emulsion solidification, there is
a strong possibility that high speed agitation of the soil during
addition would break up the aggregates as soon as they were formed
VI, CONCLUSIONS
The results of this investigation lead to the following conclusions:
In the adsorption of the two cations studied, ferric iron and Hyamine 1622, the maximum amount of either cation adsorbed is less than the amount that could be picked up as calculated by the base
exchange capacity of the clay.
For the adsorption of ferric iron, if the clay-water mix is allowed to stand for 118 hours, there is a greater amount of ferric iron adsorbed than when the solution is in contact with the clay for only a short time.
It is concluded that the most likely cause of the observed
adsorption effects is aggregation of the clay particles, which
forms shielded regions where no ion exchange can take place. The greater adsorption of iron over a period of time is held to be due to diffusion of the ferric ions through the outer portions of the aggregates into the interior, where they can then be adsorbed on the
previously unaffected clay.
This theory of aggregation is considered to be the means of explaining the results of tensile tests on emulsion stabilized soils,
where high speed agitation with pretreatment gives better tensile
strength to wet test bars than does hand mixing. This indicates that
the high speed mixing is breaking up poorly pretreated soil aggregates
and causing more effective adsorption of the pretreatment chemical,
VII. RECOMMENDATIONS
On the basis of the conclusions reached with respect to the mechanism of cation adsorption by clay particles, it is recommended that adsorption of the cations used in this investigation be studied
when the clay-water system is under high speed agitation. This would
serve to break up any aggregates that might be formed and show whether it was indeed aggregation causing the limited adsorption of ferric
iron and Hyamine 1622,
When the adsorption characteristics of the clay have been in-vestigated, it is recommended that the emulsion stabilization tech-nique be applied to the clay, so as to find the relation between the adsorption of pretreatment chemical and the optimum strength of the solidified clay-emulsion mix.
From the results of this work, it should then be possible to determine if there are any definite relationships between the ad~-sorption characteristics of the clay and the most effective pretreat-ment level for emulsion solidification of the clay. If there is indeed
found to be correlation, it is further recommended that work be con-ducted to see if the relationships so obtained have a parallel in the
solidification of soils by resin emulsions. This work, if successful, would do much to eliminate the present "trial and error" system of studying soil solidification, and would allow the studies to be based on known and valid relationships.
APPENDIX A
ANALYTICAL PROCEDURES
1. DETERMINATION OF BASE EXCHANGE CAPACITY OF KAOLINITE
The technique developed is an adaptation of the method suggested
by Perkins (22), and is based on procedures developed by the Bersworth
Chemical Company (2).
SATURATION PROCEDURE:
Weigh out 25,00 grams of the kaolinite to be tested. Place in a 250 ml centrifuge bottle, add 175 ml of 1N magnesium acetate and
shake thoroughly. Centrifuge the mixture, decant the supernatent
solution and add another volume of the magnesium acetate solution, Repeat this procedure at least six times to insure saturation. If five or six spherical glass beads are added initially, it will be
found easier to redisperse the closely packed clay following each
centrifuging and decantation.
Following the saturation, wash the clay by addition of distilled water to remove excess magnesium acetate solution, centrifuging and
adding more water until the supernatent liquid no longer shows the presence of magnesium. The clay may be considered as washed when the wash water no longer turns red upon addition of buffer solution and several drops of Inhibited Versenate Indicator.
ANALYTICAL PROCEDURES
Place the 25.00 gram sample of saturated clay in a 500 ml vol-umetric flask and add 150.00 ml of 0,05N sodium versenate solution. Shake for several minutes, then add distilled water to dilute to the mark. Shake again. After the clay has settled, remove a 100.00 ml
aliquot and place in a 250 ml erlenmeyer flask. To the flask add 20 ml of buffer solution and three drops of Inhibited Versenate In-dicator. Titrate to the first red tint with 0,05N magnesium acetate.
The difference between the amount of sodium versenate solution a dded
and that remaining (as found by the titration) is the number of
milli-equivalents of cation adsorbed by the clay sample. When multiplied
by four to adjust to a basis of 100,00 grams, this will be the base
exchange capacity of the clay.
REAGENTS
Inhibited Versenate Indicator (Bersworth Chemical Company) »
Magnesium Acetate, C.P,.
Sodium Versenate (Bersworth Chemical Co.), Analytical Reagent.
Buffer Solution. Mix 1 part of 1.0M NH) Cl and 5 parts of 1.0 M NH),OH, to obtain a solution whose pH is just
2. COLORIMETRIC DETERMINATION OF IRON 0
ANALYSIS:
Prepare a standard solution containing 10 mg of iron per liter.
To do this take exactly 0.0863 gm of FeNH)(S0))2° 12 Hy0 and dissolve
in 20 m1 of 3N hydrochloric acid. Dilute the solution somewhat and add O,1IN KMnO), to the cold solution until a slight excess is shown by the pink color. This is to make sure that all the iron is in the ferric state. Transfer the solution to a liter volumetric flask, dilute to the mark, and mix by pouring back and forth at least four times into a large beaker which is dry at the start.
Prepare standard samples by adding to a 100 ml volumetric flask 20 m1 of 2N HCl and 20 ml of 1N KCNS and varying volumes of the standard iron solution. Dilute to the mark with distilled water and mix thoroughly. Measure the per cent light transmission on the electrophotometer as a
function of iron concentration (using a blue filter). From the range of values covered, construct a calibration curve as in Figure 13. Measure unknown iron concentrations by following a similar procedure,
recording percentage light transmission for each unknown and reading
the iron concentration from the calibration curve. Solutions having quantities of iron in excess of the range covered by the colorimetric procedure can be diluted to give appropriate concentrations. The results are accurate to about 4% of the actual iron content. For details of
operation of the electrophotometer, see reference ().
REAGENTS:
Ferric Ammonium Sulfate, C.P.
Hydrochloric Acid, Reagent Grade.
Potassium Permanganate, C.P,
a : y To ; - = . : frre STEER
TT 11 rr ; Corry
| ™ HebghtHEE FHA HEE
| - 3 SEESNSEIUAnE ERE y ; pt + 1 I 7 3 Pr rE eer b # a - HS AE rrr irrrrr ty ig * on Trrkyn EE rt rr re EE v a Lore — = - HEBES = Err sei . mrt crt Ee be pT PIEPER EE WE - oo : me roa } . } i EH EE x A A - 0 A
+H Tn | COLOR TMETRIC TRON ANAT VS TR = EEESEN
i A AJL J LL LIL Lo ko \L- y CAFE BAY W ER Ie BE Xe rt
¥ Ea8s a HHH
HE 5 COAT TRR AT TON HRY R HH
ot CH eA EDINA LD AON TORN E, AEELr edd dpi ee VS Ye EEE
5 SE 0 0 1 CL 5 LL 0 i iT o E my Bodog TL]
: gH 7 . eat —t Ft
1 Fi REA ES ea ee HEE
IRE eG Oa rire ioe of|1BOPRL
Fr ®7 | ee|TAY=ZY2d[T&T]dA411
PAE oA Eee Pet Te 2 } i ;l Ed ah : : uv iE Fe o + 1 : 3 os we T +s t Co HH , Se 5 Anh df to | & Ba — ii 1 T +r . 1 a = Rt ] i : ; y fr! £1 i Hs TH 1 Oo eo ii : 1 0 &, tt m= CT Ben 7 -mE . ! ~N : Sasss . SSI B48 eed i EY > ; Hh + ik rg | He = H,
HE | -at ih.BEER Io CR
BREN , SEE i > wm Er HE : be pt: HH 2 . \ 1 rae ~ 1% 3 IH oy 5 11 Hig 3 LH. Fs 1] £ 5 ith 111d 3 EE - =e I} Ig i a 2 7 i WR td ‘ a - =
BW.111
Tie fr i tli BE oe = HR | “Hogi r HH . I + or. has - He rrr oo i “1 i Fores a rH Hn f Br F i oO. | EE + He tp oh : < Poa: . NI] isean’; Rhum CHL fet INE :
Hn i : Cis
nl el ti ENT CHEE
1] 158. it oH = grizte IN He I EEE LAS yg ||] a HHH i HH |]FEL HH : SHES HHH ep rte TF | oe HE gf i HHH Hey fEEaE INCH 1 HEE HE HH EN HEH en nn
Lg Jest SNH HE
DEE : FT r Tri © boassan
HE hr ahh Co HN BH
Sg i Hed EHH
Ho HEHE HN ; Hr eTHp HEE Ter Hr SMH HiHEE
TT ERE or : sanen FEE TR ET
He + i - a LH nr BH
le HG i i FETT iT err
Tr rr Ee Ht Or HE Fi
Fit 2 tt ae + - I] SNH gene y TIT ITd Ie EEL oe CENCE T te rT
TT ST ne El INSTT wot Ori
BEEP 7 3 xT ; COPING pL rrr eeaE Le Nid = bidet
PIE 1 ut 5 SHE Vir
HE HE Eiesct HHH
Eo fe ow ac eg sEEEEEEd
TE BE CHENG HE
He SARE tt reo apg TR py ie HHH ; HT Be TH eT gEEsses Had HHH 4: i : ING HHHHe i HHH Le = PNG 1131] en Err FON PE 0 Eh TT - FSI a HHH HH EE :2 HHH ORETH HHH HHH HHH HH shi i HHT , > i 1g NN
-An® min She J Th HH HN0 Er Ter A Fel } ; 4. THEE. ESEOENS weaues : b rt eer
Frid rea ii rir yr]
i Err rtrd HHH
; IHL] HEH HHH
ae rr he
| EN | PTT] :
FHF eh HE ver pot pee le RITE
S LIIhy, aml EE ’ Sie hes I Ee errr rrr
oH BB CHELES oo agg, srg i Fat daa Er 3 ET
= 8, Sipe dc BET TEE HE >
TN rT 11] & i 3 . ] ] La HHT Fa rir ere
“+1 4 1 + + 4 +
-FO HE Gt hldna ie SEL Emi
A pol=tt hd [1 Fi tL } RECs Ty ret TH HTH o vp eer HA= 1} i x Be pe > EE 8 L HH Ctl grim nr HHH seREREER
3a I] 1 1% 1 ta 3 Fera CER THe yd Apt +a rr rie HoH
J+ - 3 E . : Tri ITT I i
: tiie tid HE THE abt FHmerfd 8 Tetra : tat H = \ oo bra Tr pet LPL TA
of” dt : it hh v=3 Yin ) ETT SW rrp
} i Ay : rr Ae er Ta ar ; sori Cr
i i : . 3x gpusnnaps
wt + ! HE
franglo AEE Eee Sar
1 Te 4 § | oo EE 3 y am . x : apa] FEET
Loong Lo Sm oe pee bro CRT
5 it HH Lop oe TE rr 3: Nh: 2 EER CHEE HH rere EERHEA EE HHT
BE ET en waa IF LTT verted Tit i 7 I rt tH we XE TERT
rr A HHRE l =~
HH :
I Tt rah aT fi IA HHH TIT ey 11] 1 HIE FT YT ry) RAL] Fi 3
Hr HEE HR ; rE rr Ege ali £) ]
! PH SH fv Hp gO ee 80 Eee ye 4p RHEE
Lr A = i id <I: I i] & mane U3] HH Fit “HHH EE eR HER A ti 144 HHH HE HH : 2 art mi Hi 17 Er rr rrr or er TT
HHH : i yal HHH RHEE Hg HR HE HH
0 0 hE i Dis am |. 13 Ld adie tL 1 ne HESABLISEANIRANADROPRENSEEAUE SEBAE8R pe HH
HHH . i REOEAAEARGTINERER IS" com EY 3 TE wre SHIENENSEANNGANSASE PF 9tRERASEE REAP ASH AL \DORGCARDEE ANADU NDS
133 HHH RCO TT. AEST. S | AYE Ha HH BS 3 ya|[apds=ag—.{TVdames(gal|THEY+71HHHri41
Urs HH AIS LAN Nr Ul & Taf Bt © WEE LSS ae ay: SLI FILET Rak 8 CITT ERC an | LL od uASEERLREn NeNENEREEFr {i -1] = a LH er 2 3 HA | & nas dd fr dy ar TE yy A Tr TI i Tt LTT Ty
I ITI riTo brett a pide : HEEEREDEAbAEEEEY td EE A Ee eR
HHH HH HH RH Lad Sue ARTE ry HET
3. DETERMINATION OF HYAMINE 1622 (PROCEDURE B) (23)
SCOPE:
This procedure is suitable for assaying most Hyamine 1622
products by selecting the proper size aliquot. Reproducibility
and accuracy is 1,0%.
Triton X-100, sodium carbonates, sodium orthophosphates,
tetrasodium pyrophosphate, sodium tripolyphosphate, sodium meta-silicate, and salts of ethylene diamine tetra acetic acid do not interfere,
PRINCIPLE:
Bromphenol blue indicator forms a salt with Hyamine 1622:
(QF + (ID) ee (QH@D)
Hyamine Bromphenol
Blue
This salt is soluble in the lower ethylene dichloride layer and colors it blue. At the end-point the Aerosol OT displaces the bromphenol blue to form an undissociated salt with the hyamine.
(Q*ID)” + (01) a (AHOT)” + (DY
The released indicator cation is soluble in the upper aqueous layer and the endpoint is indicated when the upper layer turns violet.
APPARATUS:
Bottles, 200 ml., glass stoppered, narrow mouth.
Burettes, 50 ml,
Flask, volumetric, 1 liter, 2 liter.
Graduated cylinders, 25 ml,
Pipettes, 10 ml, 20 ml.
REAGENTS:
Aerosol OT, 0,0010N solution. Dissolve 0.8890 gm of Aerosol OT
pellets (American Cyanamid Co., dioctyl ester of sodium sulfosuccinic
acid) in hot water, cool to room temperature and dilute to 2 liters.
Bromphenol Blue, Indicator grade (Lamotte Chemical Co.), 0.1%
solution in 1:1 alcohol and water. Store in a dark bottle fitted with a dropping pipette.
3. DETERMINATION OF HYAMINE 1622 (CONT.)
Hyamine 1622, 0,0010N solution. Dissolve 0.9310 grams of
Hyamine 1622, containing less than 0.5% water, in distilled water
and dilute to two liters.
Sodium Carbonate, C.P,
Sodium Sulphate, C.P.
Salt solution. Dissolve 100 gm of sodium sulphate and 10 gm of sodium carbonate in distilled water and dilute to one liter.
PROCEDURE:
A. Standardization of Aerosol OT.
1. Pipette duplicate 20,00 ml portions of the standard
hyamine solution into separate 200 ml glass stoppered bottles.
2, Add 25 ml of salt solution and 15 ml of ethylene dichloride to each bottle,
3, Add exactly three drops of bromphenol blue solution to each titration bottle.
Li. Titrate the contents of each bottle with Aerosol OT solution, At first add the titrant in one ml increments and shake the stoppered bottle vigorously for 10 seconds after each addition. Let the bottle stand for 10 seconds after each shaking and note the appearance of the upper layer. As the end-point is approached, as indicated by the tendency of the upper layer to break rapidly, add smaller increments of Aerosol OT solution,
5. The end-point is reached when one drop of titrant produces a violet color in the upper (aqueous) layer. The addition of 1-2 drops of Aerosol OT solution in excess should, after shaking, result in the transfer of all the color to the upper layer.
6. Record the volume of Aerosol solution used for each aliquot. T« Calculate the milliequivalents of Hyamine 1622 per
milli-liter of Aerosol solution as follows:
MEQ Hyamine 1622/ml AOT = 0,0200/volume AOT used in titration.
B. Determination of Hyamine 1622
1. Pipette duplicate aliquots of Hyamine 1622 solution into
separate 200 ml glass stoppered bottles.
2, Add 25 ml of the salt solution and 15 ml of ethylene dichloride to each bottle.
3. DETERMINATION OF HYAMINE 1622 {CONT.)
3. Add exactly 3 drops of the bromphenol blue solution to each bottle.
Li. Titrate the contents of the bottles with standard Aerosol OT solution as described in steps L-6 of standardization procedure.
5. If the unknown hyamine solution is too concentrated, dilute
appropriately before taking aliquots for testing.
6. From the standardization calculations for the Aerosol OT solution, calculate the milliequivalents of Hyamine 1622 for each
APPENDIX B
SAMPLE CALCULATION
l., Adsorption of Ferric Iron
(Data is for Run 3, Set 2 of the immediately tested samples.) Basis: 25,00 grams of kaolinite.
Total volume of solution: 150,00 ml.
Milliequivalents of Fe*** added: 2,000
Milliequivalents of Fet++* left: 1,272
MEQ of Fet*¥ adsorbed: 0,728
Equilibrium Concentration = ne = 0,008L8
Per Cent Adsorption = 22728x100=36.
er Cen sorption=toesx136.4%
2. Adsorption of Hyamine 1622
The calculations for the adsorption of Hyamine 1622 are exactly the same as those for the adsorption of ferric iron.
APPENDIX C
LOCATION OF ORIGINAL DATA
The original data for this thesis are located with Professor A. S. Michaels of the Department of Chemical Engineering at the
APPENDIX D SOIL ANALYSES
1. ANALYSIS OF "PEERLESS" KAOLIN (25)
$10, LL.98%
Cal TraceMgO Trace
110, 1.0%
Na,0 0.07
K50 0.12
Ignition Loss 13.51
Total 99.83%
2. ANALYSIS OF FORT BELVOIR SANDY CLAY (16)
Quartz L0%
Kaolinite 25%
Hydrous Oxides
of Iron and Aluminum
Note: The "Peerless" kaolin above was the clay used in the ad-sorption calculations for this thesis.
The Fort Belvoir Sandy Clay is the soil that is currently being used in the studies on emulsion stabilization of soils.
APPENDIX E LITERATURE CITATIONS
(1) American Resinous Chemicals Corp., Letter of August 1h, 1952,
addressed to William Rice, Chemical Engineering Department,
Room 12-132, Massachusetts Institute of Technology, Cambridge
39, Massachusetts.
(2) Bersworth Chemical Company, "The Versenes", Tech. Bulletin No.2,
Fourth Edition, p. 5, Section III, Framingham, Mass. (1952).
(3) Brindley, G. W., "X-Ray Identification and Structures of Clay
Minerals", 32-85, London, The Mineralogical Society (1951),
(L) Cornell University, "Final Report-Soil Solidification Research",
Volume IT, V1-V17, Ithaca, New York (1951).
(5) Daniels, F., "Outlines of Physical Chemistry", 523-565, New York,
John Wiley & Sons, Inc. (1948).
(6) Fisher Scientific Company, "A Manual of Colorimetric Analysis
with the A.C. Model Fisher Electrophotometer!, 1-16, New York (1951).
(7) Hall, W, T. and Treadwell, F. P., "Analytical Chemistry", Volume II,
Fifth Ed., 156, New York, John Wiley & Sons, Inc. (1947).
(8) Hauser, E. A., "Colloidal Phenomena", 89-116 and 238-2L2, New
York, McGraw-Hill Book Company, Inc. (1939).
(9) Ybid., n. 128,
(10) Thid., p. 137.
(11) Hauser, E. A., "Colloid Chemistry in Ceramics", Journal American
Ceramic Society, 2k, 179 (19L1).
(12) Hauser, E. A., "Colloid Chemistry of Clays", Chemical Reviews,
37, (1915).
(13) Kelly, W. P. and Jenny, H., "The Relation of Crystal Structure to Base Exchange and Its Bearing on Base Exchange in Soils", Soil
Science, Ll, 367-382 (1936). ‘
(14) Kunin, R. and Myers, R. J., "Ion Exchange Resins", 25, New York,
John Wiley & Sons, Inc. (1951).
(15) Ivid., p. 35.
(16) Lambe, T. W. and Martin, R. T., "Composition and Engineering
Properties of Soil", Massachusetts Institute of Technology,
Cambridge 39, Massachusetts, December, 1952.
(17) Langmuir, I., Journal American Chemical Society, 38, 2267 (1916)
and LO, 1361 (1918).
(18) Lin, C. S., personal communication.
(19) Massachusetts Institute of Technology, "Final Report-Phase I,
Soil Solidification Project", Cambridge, Mass. (19L8).
(20) Massachusetts Institute of Technology, "Monthly Reports, April,
1952 to May, 1953", Soil Solidification Project, Cambridge,
Mass,
(21) Michaels, A. S., personal communication.
(22) Perkins, A. T., "Determination of Cation Exchange Capacity of
Soils by use of 'Versenate'", Soil Science, Vol. 7h, No. 6,
Lh3-Lh6 (1952).
(23) Rohm and Haas Company, "Assay of Hyamine Containing Products",
Philadelphia, Pa.
(24) Rohm and Haas Company, "Hyamines 1622 and 10X", Bulletin,
Philadelphia, Pa,
(25) R. T. Vanderbilt Company, Letter of December 1, 1952, addressed
to Professor T. W. Lambe, Department of Civil Engineering, Massachusetts Institute of Technology, Cambridge, Mass.
Note: Reference (19) is particularly valuable in that it is a Literature Survey on the material related to soils, soil
chemistry, and soil solidification. The monthly reports
listed in reference (20) are at the present time being compiled into the yearly report of the Soil Solidification Project and should be found in a more orderly arrangement when this report