Simulating Supercapacitors: Can We Model Electrodes As Constant Charge Surfaces?
16
0
0
Texte intégral
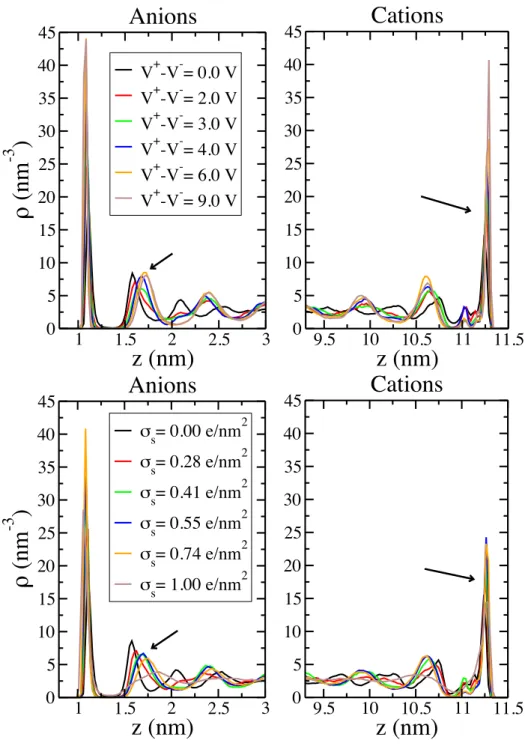
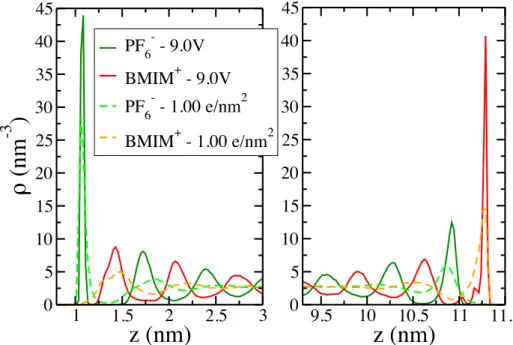
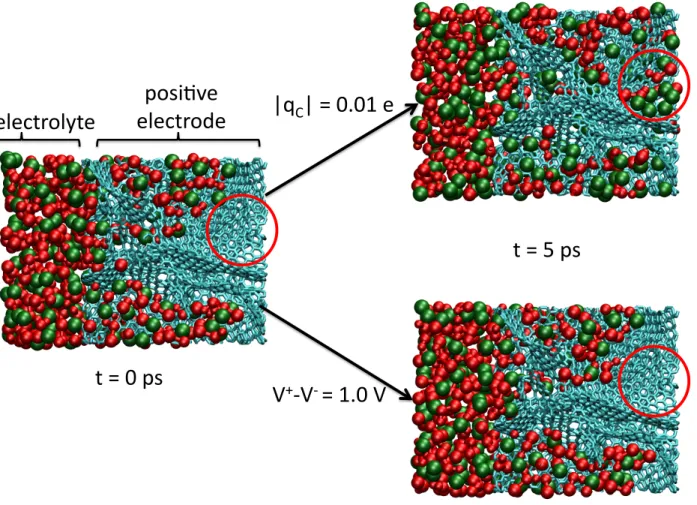
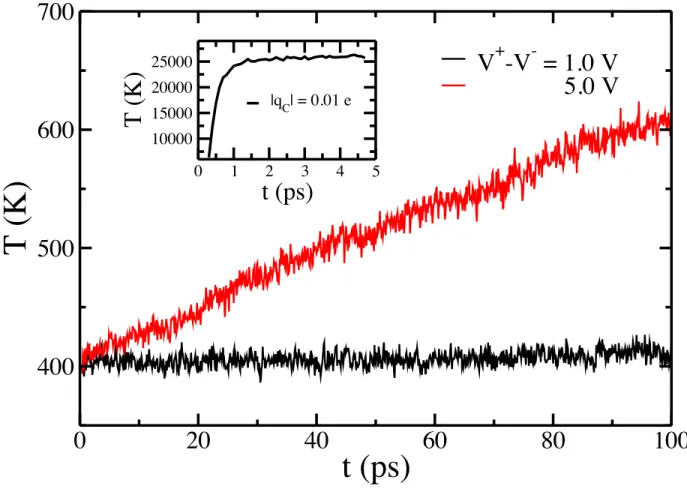
Figure
Documents relatifs
[r]
[r]
[r]
C’est obtenu par la superposition d’une source placée au (-a,0) et d’un puits avec la même intensité au (+a,0), et puis en prenant la limite de fonction de courant pour a
A 321 (1985) 23-30], which he used to calculate the isotope shift constant for a uniform nuclear charge distribution, to obtain it for a diffuse nuclear charge model.. The two
[r]
2) Envoi doublé. Par préaution, on hoisit d'envoyer le même message deux fois.. a) A ve quelle probabilité le i-ième symbole du premier message reçu
b- Théorie : Le réglage de la fréquence (sans modifier le rapport cyclique) est possible par exemple en utilisant une boite à décades pour le condensateur de l’intégrateur. Mais
