HAL Id: hal-03202575
https://hal.archives-ouvertes.fr/hal-03202575
Submitted on 20 Apr 2021HAL is a multi-disciplinary open access archive for the deposit and dissemination of sci-entific research documents, whether they are pub-lished or not. The documents may come from teaching and research institutions in France or
L’archive ouverte pluridisciplinaire HAL, est destinée au dépôt et à la diffusion de documents scientifiques de niveau recherche, publiés ou non, émanant des établissements d’enseignement et de recherche français ou étrangers, des laboratoires
Phosphate defects and apatite inclusions in coral skeletal
aragonite revealed by solid-state NMR spectroscopy
Harris Mason, Paolo Montagna, Laura Kubista, Marco Taviani, Malcolm
Mcculloch, Brian Phillips
To cite this version:
Harris Mason, Paolo Montagna, Laura Kubista, Marco Taviani, Malcolm Mcculloch, et al.. Phosphate defects and apatite inclusions in coral skeletal aragonite revealed by solid-state NMR spectroscopy. Geochimica et Cosmochimica Acta, Elsevier, 2011, 75 (23), pp.7446-7457. �10.1016/j.gca.2011.10.002�. �hal-03202575�
Phosphate defects and apatite inclusions in coral skeletal aragonite revealed by solid-state 1
NMR spectroscopy 2
Harris E. Mason1†*, Paolo Montagna2,3‡, Laura Kubista1, Marco Taviani3, Malcolm McCulloch4§,
3
Brian L. Phillips1
4
1Department of Geosciences, Stony Brook University, Stony Brook, New York 11794-2100
5
2 Lamont-Doherty Earth Observatory Columbia University, 61 Route 9W, Palisades, NY 10964
6
3Istituto di Scienze Marine (ISMAR), Consiglio Nazionale delle Ricerche (CNR), Via P. Gobetti
7
101, 40122 Bologna, Italy 8
4Research School of Earth Sciences, Australian National University, Canberra, ACT 200,
9
Australia 10
*corresponding author email: [email protected]
11 12
†Present address: Physical Life Sciences Directorate, Lawrence Livermore National
13
Laboratory, Livermore, CA 94550, USA.
14
‡Present address: Laboratoire des Sciences du Climat et l’Environnement, Gif-sur-Yvette, 91198,
15
France 16
§Present address: University of Western Australia School of Earth and Environment Rm 138
17
M004 ARC Centre of Excellence in Coral Reef Studies 18
Crawley, Western Australia 6009 19
20
Abstract 21
Recent development of paleo-nutrient proxies based on the Phosphorus/Calcium (P/Ca) ratio in 22
tropical- and deep-water corals (also known as cold-water corals) illustrate the necessity for 23
understanding the processes by which P is incorporated into the coral skeletal aragonite. Here 24
we apply single- and double-resonance solid-state nuclear magnetic resonance (NMR) 25
spectroscopy to determine the speciation of P in coral aragonite. The results show that the 26
majority of P occurs as phosphate defects in the aragonite structure, but in many samples a 27
significant fraction of the P occurs also in crystalline hydroxylapatite inclusions. Quantification 28
of the amount of hydroxylapatite indicates that its presence is not related simply to external 29
environmental factors and that it can occur in varying abundance from different parts of the same 30
corallite. Since there is currently no model available to describe the relationship between 31
dissolved inorganic phosphate and incorporation of apatite inclusions into carbonates, careful 32
screening of samples which contain only phosphate in the aragonite structure or selective 33
microsampling could improve proxy development. 34
35
Keywords: coral, phosphate, aragonite, NMR spectroscopy, apatite, 31P, 1H, 19F
1. INTRODUCTION 37
It has been recently proposed that P/Ca ratios in the aragonite skeleton of corals record 38
the concentration of ambient dissolved inorganic phosphorus (DIP), which, when combined with 39
U-series chronology, could prove to be a useful paleo-nutrient proxy (Montagna et al. 2006; 40
Anagnostou et al., 2007; LaVigne et al., 2008; LaVigne et al., 2010; Anagnostou et al., 2011). 41
The amount of bioavailable phosphate in the photic zone of the surface ocean serves as a limit to 42
primary productivity in some ocean basins. Since export of biomass to deep waters may act to 43
drawdown atmospheric CO2 (Broecker, 1982; Volk and Hoffert, 1985; Sarmiento et al., 1998),
44
knowledge of past oceanic P concentrations is important to estimate the contribution of the 45
“biological pump” to the levels of atmospheric CO2. Montagna et al. (2006) noted that laser
46
ablation inductively coupled plasma mass spectrometry (LA-ICPMS)-derived P/Ca ratios for 47
aragonite septa from a variety of recent Desmophyllum dianthus coral samples were linearly 48
related to the DIP concentration of the waters from which they were collected. This correlation 49
was used to reconstruct paleo-nutrient data from a ~11 190 yr old sample. Unlike other trace 50
elements used as paleo-environmental proxies, such as Ba, Sr and Cd, P cannot substitute simply 51
into the aragonite crystal structure and its form in the coral aragonite is unknown (Dodge et al, 52
1984). The P speciation can be reasonably expected to influence the relationship between DIP 53
concentration and aragonite P/Ca. 54
Geochemical models of trace element incorporation in calcite and aragonite typically rely 55
on thermodynamic treatment of incorporation of the trace element into the mineral structure 56
(Cohen and McConnaughey, 2003; Gagnon et al., 2007; Gaetani and Cohen, 2006). Phosphate 57
co-precipitation, sorption, and desorption studies at phosphate solution concentrations less than 58
100 M and near neutral pH suggest that inorganic phosphate incorporation in calcite can be 59
modeled by adsorption and subsequent incorporation of protonated phosphate groups (House and 60
Donaldson, 1986; Hinedi et al., 1992; Millero et al., 2001). It has also been shown in certain 61
cases that calcite with 60-100 g/g P can contain crystalline Ca-phosphate inclusions that are 62
difficult to detect by microanalytical methods, suggesting that surface precipitates can form and 63
be subsequently encapsulated by continued crystal growth (Mason et al., 2007). Crystalline Ca-64
phosphates can be difficult to nucleate and models that could account for the formation of such 65
P-rich precipitates via heterogeneous nucleation on calcium carbonate surfaces (Koutsoukos and 66
Nancollas, 1981) have yet to be fully explored. Therefore, to model the co-precipitation of 67
phosphate with calcium carbonate minerals it is desirable that phosphate is incorporated as a 68
structural constituent. 69
Solid-state 31P nuclear magnetic resonance (NMR) spectroscopy is one potential
70
technique from which information on the distribution of P in coral aragonite might be obtained. 71
The 31P NMR chemical shift is very sensitive to the bonding environment surrounding P and has 72
distinct, often characteristic values for crystalline phases. 31P NMR techniques, primarily in the
73
liquid state, have been used extensively to determine P-speciation in soluble extracts from soil 74
samples and from marine sediments and particulate matter (for a review of these 31P studies see
75
Cade-Menun, 2005, and Turner et al, 2005 for a review of extraction methods). Such methods 76
yield high resolution of organic P-species and are required for NMR investigation of materials 77
containing significant concentrations or paramagnetic ions (which cause severe linebroadening in 78
NMR spectra), but require harsh chemical treatments to separate various P fractions. In 79
addition, only a fraction of the P is extracted from the solids (typical recovery 30-60%), with 80
some P remaining in the insoluble residue (Ahlgren et al, 2007). Considering that coral 81
aragonite typically contains low concentrations of Fe and Mn, and bulk P concentrations just 82
within the NMR detection limit, it might be amenable to investigation by in situ solid-state 31P
83
NMR methods. 84
Here we present a survey of solid-state 31P NMR spectra of coral skeletal material that
85
illustrates the potential of the technique for determining the speciation of P in such materials, and 86
in other carbonate minerals as well. We use a variety of solid-state NMR spectroscopic methods 87
to characterize inorganic phosphate in a synthetic aragonite/phosphate coprecipitate and show 88
that the phosphate occurs within 3.2 Å of several carbonate groups, indicating that it is 89
incorporated in the aragonite structure. The similarity of these data with those obtained for coral 90
skeletal material provides strong evidence that structural phosphate defects are the principal P-91
species in coral aragonite. Many coral samples also yield a 31P NMR signal characteristic of 92
crystalline apatite that can represent a significant fraction of the bulk P, but the origin of which is 93
uncertain. These results support the use of P/Ca ratios for paleo-environmental proxies, but also 94
suggest that the proxy relationships might be improved by selecting samples lacking apatite 95 inclusions. 96 97 2. EXPERIMENTAL METHODS 98 2.1. Sample Preparation 99 2.1.1. Coral Samples 100
Subsamples of coral skeleton were selected from modern and subfossil corals lacking any 101
visible Fe-Mn-rich crust, checked under a binocular microscope and using thin sections under 102
plane and cross-polarized light. No major visible alterations (e.g. diagenetic alteration or 103
bioerosions) were evident. The P/Ca ratios and the P concentration for the coral samples were 104
obtained using LA-ICPMS following the procedures of Montagna et al (2006) and through 105
solution ICPMS (see method below). 106
The sampling methods differed among the various coral species. 107
Desmophyllum dianthus and Flabellum sp.: fragments of the largest septum S1 were 108
carefully removed by a diamond tipped saw attached to a dentist drill. Other subsamples 109
were cut from the thecal wall and all the fragments of septa attached to the theca were 110
mechanically abraded away using the same dentist drill. This allowed us to obtain 111
samples representative of both the septum and the thecal margin. Two subsamples of 112
Desmophyllum dianthus septa were crushed to pass a 250 µm analytical sieve and 113
subjected to chemical cleaning; one was placed in a bleach solution (6% NaClO) and 114
agitated for four days and another was treated using a method similar to those prescribed 115
by Shen and Boyle (1988), Cheng et al (2000), and LaVigne et al. (2008) which are 116
designed to remove sorbed metals and metal oxide coatings. 117
Lophelia pertusa: pieces of the thecal wall were obtained by cutting single corallites 118
transversally. The part corresponding to the intersection between the wall and the septa 119
(inside edge of the theca) was abraded and septa were completely removed. 120
Madrepora oculata: a piece of the coral was collected by cutting a corallite transversally. 121
This coral portion contains both the thecal wall and the septa (“whole coral” reported in 122
the text). 123
Porites sp.: a small rectangular parallelepiped was removed from a 7 mm slab previously 124
obtained by cutting a coral core along the axis of growth. The subsample was taken at a 125
distance of 12 cm from the top of the coral core in order to avoid the remnants of coral 126
tissue. 127
128
2.1.2 Synthetic aragonite/phosphate coprecipitates 129
Aragonite/phosphate co-precipitation was undertaken using a seeded constant addition 130
method adapted from Zhong and Mucci (1993) and described by Reeder et al. (2000). The 131
aragonite seeds were synthesized by pumping separate solutions of 0.2 M CaCl2 and 0.2 M
132
Na2CO3 using a dual syringe pump at a rate of 300 μl/min into a constantly stirring initial
133
solution containing 7 mM CaCl2, 7 mM NaHCO3, and 50 mM MgCl2 which was being bubbled
134
with air. Each solution contained 0.1 M NaCl as background electrolyte. The aragonite seeds 135
were identified as pure aragonite by powder X-ray diffraction and analyzed by scanning electron 136
microscopy (SEM) to determine the average dimensions and morphology of the crystals, 137
revealing blocky crystals typically 3 μm wide by 4 to 10 μm long grouped into ball-shaped 138
clusters 40 to 50 μm in diameter. For phosphate co-precipitation, the same procedure was used 139
except 0.1 g of aragonite seed material was added to the initial growth solution, the 140
concentrations of reactants in the syringes were 0.1 M, and NaHPO4 was added to the carbonate
141
syringe such that the phosphate concentration of the syringe ranged from 50 to 100 μM. A 0.1 M 142
NaH13CO
3 solution replaced the Na2CO3 syringe to synthesize a 13C-enriched sample. This
143
sample was prepared for 31P/13C double resonance NMR experiments where the low (1.1%) 144
natural abundance of the NMR active 13C nucleus prevents observation of spectroscopic effects.
145
Periodically, solution was drawn from the growth solution to analyze total carbonate and reactive 146
phosphate concentrations, from which we determined that the phosphate concentration ranged 147
from 1 to 3 M during crystal growth. After 4 to 5 h of reaction time the solid was collected, 148
filtered, and dried for 2 hrs in a 60° C oven. The P concentrations of the overgrowths were 149
calculated from the difference of phosphate added to the solution and that remaining in solution 150
at the end of the experiment (from measured reactive phosphate concentration and total solution 151
volume), estimating the mass of calcium carbonate precipitated from the amount of Ca added to 152
the growth solution. Powder X-ray diffraction indicates that all synthetic coprecipitates were 153
composed dominantly of aragonite, but that some contain as much as 9% calcite (Milliman and 154
Bornhold, 1973; Morse et al, 1985). 155
156
2.2 Laser ablation ICPMS analysis 157
The P/Ca ratios and the P concentrations were obtained following the analytical method 158
by Montagna et al. (2006, 2007). We used a high sensitivity pulsed laser ablation system, 159
coupled with a Fison PQII ICPMS with enhanced sensitivity. This laser ablation system housed 160
at RSES (Canberra) uses a LambdaPhysik LPX 120i argon fluoride 193nm excimer laser. All the 161
coral samples were scanned at 20 m/s using a 20 m wide and 220 m long rectangular laser 162
beam mask with the laser pulsing at 5 Hz and an energy of 50 MJ. Before acquisition, surface 163
contamination was removed by pre-ablating the coral surfaces twice, with a 230 m diameter 164
spot followed by the same rectangular slit used for the analysis. A pressed powder coral disc and 165
the NIST glass standard 612, chosen for its P concentration comparable to the coral samples, 166
were analysed before and after each run on the samples, together with the acquisition of the 167
background (gas blank) for 60s, allowing correction for long-term machine drift during analysis. 168
The precision for 31P, calculated as the RSD (1 /mean) of 60s acquisition on the NIST 612 was
169
~ 6%. 170
The P concentrations of Desmophyllum dianthus and Flabellum sp were obtained both on 171
the outer faces of the S1 septum and on the thecal wall, whereas Lophelia pertusa was only 172
analysed along the theca. It was not possible for the Porites coral to discriminate between the 173
theca and the septa and the P concentration represents an average over these skeletal portions. 174
175
2.3 Bulk solution ICPMS analysis 176
Analyses of 31P and 43Ca were determined by inductively coupled plasma mass 177
spectrometry (ICP-MS) using the multi-collector Axiom in single collection mode at Lamont-178
Doherty Earth Observatory and following the standard addition method (Vandecasteele and 179
Block, 1997) to correct for the matrix effect. 180
For some of the samples analysed by 31P NMR, a precisely-weighted amount of coral
181
powder was dissolved in double distilled HNO3 and further diluted in 1% HNO3 for the analysis
182
by ICPMS. Procedural blank solutions were made with the same vials and acid used for the 183
treatment of the samples. The analysis was carried out in two separate sessions: in the first 184
session the concentration of P was measured in solutions with a final dilution factor of ~2000. 185
The solutions were further diluted to a dilution factor of ~6000 and analysed for calcium 186
concentration during a second analytical session. 187
A multi-element stock standard mixture was prepared gravimetrically with 1% HNO3 and
188
High-Purity Standards (Charleston, SC; 1000 ± 3 g mL-1 in 0.05% HNO
3 v/v for P; 1000 ± 3 g
189
mL-1 in 3% HNO
3 v/v for Mg and Sr; 10 g mL-1 in 4% HNO3 for Ca), mixed in appropriate
190
concentrations to match the typical composition of coral skeletons. Two four-point standard 191
curves were prepared by adding increasing volumes of the stock solution to six pre-cleaned vials 192
containing a constant volume of the unknown solutions (sample “G15606 S” and “DD Chile S-193
ct”) and 1% HNO3. The first point of each standard curve consists of one unspiked original
194
sample. A third three-point standard curve was obtained by adding increasing amounts of a stock 195
solution containing solely P (High-Purity Standards) to pre-cleaned vials having a constant 196
volume of the unknown solution (sample “G16505 S”) and 1% HNO3. The results of the two
197
standardization methods were compared to verify the quality of the measurements. 198
A drift correction was performed by analysing an indium spiked mixed solution every five 199
samples and using a linear interpolation for all the elements. All the working solutions were also 200
spiked with indium as an internal standard to further correct for the instrumental drift. The 201
standards and unknown solutions were introduced to the plasma by a self-aspirating nebulizer 202
with an uptake rate of ~ 30 L min-1 in conjunction with a Cetac Aridus desolvating system.
203
Analytical reproducibility based on the RSD (1σ mean) of ten analyses of the Porites coral 204
standard JCp-1 (Geological Survey of Japan; run as an unknown) are ~ ±9.5% for P/Ca and P 205
concentration. Procedural blank for P, which was subtracted from the sample raw counts, was 206 typically < 20%. 207 208 2.4. Solid-state NMR spectroscopy 209
The 31P single pulse magic angle spinning (SP/MAS) NMR and 31P{1H} cross
210
polarization (CP) MAS NMR spectra were collected on a 400 MHz Varian Inova spectrometer at 211
operating frequencies of 161.8 and 399.8 MHz for 31P and 1H, respectively. Samples were
212
contained in 7.5 mm outside diameter (o.d.) Si3N4 rotors and spun at 5 kHz. The probe and rotor
213
assemblies yielded no detectable 31P NMR signal after several days of acquisition. However,
214
standard ZrO2-based rotor sleeves can give a broad, weak 31P signal in the orthophosphate region
215
(here taken to be the 31P spectral region from -5 to 12 ppm; Turner et al, 1986). The 1H SP/MAS
216
NMR and 1H{31P} rotational echo double resonance (REDOR) spectra were obtained using a
217
Chemagnetics probe assembly configured for 4 mm (o.d.) rotors and modified to yield very low 218
1H background signal. The 31P{1H} Heteronuclear Correlation (HetCor) spectra were obtained
219
using a probe configured for 3.2 mm (o.d.) rotors and were collected as a total of 100 220
hypercomplex points in t1 with a 10 μs increment, corresponding to a 100 kHz spectral window 221
in the 1H dimension. A Carr-Purcell-Meiboom-Gill (CPMG) type acquisition was implemented
222
to shorten the time needed to perform the HetCor experiment. The 19F{31P} REDOR, 31P{13C} 223
SP/REDOR, and 1H→ 31P{13C} CP/REDOR spectra were collected on a 500 MHz Varian
224
Infinity Plus spectrometer at operating frequencies of 125.7, 202.3, 470.2, and 499.8 MHz for 225
13C, 31P, 19F and 1H respectively. The 19F{31P} REDOR spectra were collected using a
226
Varian/Chemagnetics T3-type probe configured for 3.2 mm (o.d.) rotors and to give a very low 227
19F background. The 31P{13C} SP and 1H → 31P{13C} CP/REDOR spectra were collected using
228
a Varian HXY probe configured for 4 mm (o.d) rotors. The 31P MAS NMR spectra are
229
referenced with respect to 85% phosphoric acid using hydroxylapatite as a secondary reference 230
set to 2.65 ppm. The 1H MAS NMR spectra are referenced with respect to tetramethylsilane
231
using hydroxylapatite as a secondary reference set to 0.2 ppm. The 19F spectra were referenced
232
with respect to CCl3F (C6F6 = 142 ppm).
233 234
3. RESULTS AND DISCUSSION 235
3.1. 31P SP/MAS and 31P{1H} CP/MAS NMR
236
3.1.1 31P SP/MAS NMR of Coral Samples 237
We obtained solid-state 31P NMR spectra for both aragonitic azooxanthellate and 238
zooxanthellate coral samples having P contents ranging from 16 to 319 µg/g (Fig. 1; Table 1), 239
including septa and thecal wall portions as well as whole coral samples. The 31P{1H} CP/MAS 240
and 31P SP/MAS spectra of a Desmophyllum dianthus septum (DD LM99-124) are presented in
Figure 2 and illustrate the typical spectral profile observed for most samples. These spectra can 242
be described by a sum of two Gaussian peaks centered at 31P chemical shifts (δP) of 2.7 and 4.0
243
ppm which have full-widths at half maximum (fwhm) of 1.7 and 6.4 ppm, respectively. Both 244
peaks occur in the chemical shift range typical for orthophosphate species (Turner et al., 1986; 245
Kolowith et al., 2001; Cade-Menun, 2005). Given the very low surface area of these samples 246
and that the NMR signal arises from the entire sample volume, the peaks correspond mainly to P 247
contained within the sample interior and cannot be attributed solely to surface adsorbed species. 248
One possibility for the host of the P would be Fe-Mn oxide crust that may not have been 249
removed from the surface abrasion techniques employed. However, any P occurring in Fe-Mn-250
oxides would not be observable under our experimental conditions, owing to extreme peak shifts 251
and broadening of the 31P resonance that would result from magnetic interactions with unpaired
252
electrons (Grey et al., 2010). Therefore, we can rule out P associated with Fe-Mn oxides as the 253
source of the observed 31P NMR signal.
254
3.1.2. 31P{1H} CP/MAS NMR of Coral Samples 255
The two observed peaks exhibit distinct variation in 31P{1H} CP/MAS intensity with 256
contact time (CP kinetics), which allows them to be separated easily depending on the 257
acquisition conditions (Fig. 2). The CP kinetics in the simplest cases can be described by a sum 258
of two exponential functions, in which intensity increases at short contact times with a time 259
constant TPH and then decreases at longer times with a time constant T1 ,H (Kolodziejski and
260
Klinowski, 2002). TPH relates to the spatial proximity of P to H, and T1 ,H to the relaxation of the
261
1H nuclei, usually reflecting dynamical processes. The peak at δ
P = 2.7 ppm (Fig. 2a) is
262
dominant at long contact times due to a relaxation time of associated 1H (T
1ρ,H > 10 ms) that is
263
long compared to that for the peak at δP = 4.0 ppm (T1ρ,H = 1 ms). We assign this peak at P =
2.7 ppm to crystalline apatite, because its spectral characteristics closely match those reported 265
previously for this phase, including its chemical shift, narrow width (characteristic of a highly 266
ordered crystalline phase), and long 1H → 31P CP time (T
PH = 5 ms) and T1 ,H (Rothwell et al.,
267
1980; Belton et al., 1988; Kaflak et al., 2006). The broad peak at δP = 4.0 ppm dominates at
268
short contact times (Fig. 2c) because of its much shorter 1H → 31P CP time (T
PH = 0.4 ms). This
269
short TPH value indicates that the P represented by the δP = 4.0 ppm peak are in close spatial
270
proximity to rigid structural H (separations less than 4 Å). The two peaks fit to the CP/MAS 271
spectra also describe the quantitative SP spectra, indicating that they represent the P distribution 272
in the sample. With few exceptions, the spectra of the other deep-water corals are similar, 273
differing only in the total signal intensity observed and relative proportion of that signal which is 274
attributed to apatite. The chemically cleaned subsamples of Desmophyllum dianthus produce 275
spectra which can be fit with peaks having the same chemical shifts and widths as those observed 276
for the untreated samples. This result indicates that the P distribution in the cleaned samples is 277
essentially similar to that in the same samples which had only undergone surface abrasion 278
although the signal intensity is much reduced (Fig. 3). 279
3.1.3. Identification of additional minor P-species 280
Two other samples examined contain P environments not found in most of the other 281
deep-water coral specimens. Spectra of a Madrepora oculata sample (MO CORAL2 75) contain 282
a narrow peak at P = -0.6 ppm (1.1 ppm fwhm), in addition to the broad peak near δP = 4 ppm
283
common to all of the coral aragonite examined (Fig. 1g). The small width of the peak at -0.6 284
ppm suggests that it could arise from a crystalline inorganic phosphate phase (Rothwell et al., 285
1980; Belton et al., 1988; Mason et al., 2007), but the chemical shift is also consistent with 286
phosphate esters (Cade-Menun, 2005) although such organic-P usually produces broader peaks 287
in solid-state 31P NMR spectra. The origin of this peak was not investigated further, but its
288
presence illustrates that other P-containing materials could be present in coralline aragonite. The 289
Porites sp. (PO FR2004) sample we examined yields spectra containing a distinct peak at δP =
290
22.5 ppm (3.0 ppm fwhm), in addition to the broad peak near 4 ppm (Fig. 1h). This 22.5 ppm 291
chemical shift falls outside the range for phosphate, but is diagnostic of phosphonate (Glonek et 292
al., 1970; Kolowith et al., 2001, Cade-Menun, 2005), which contains C-P bonds and indicates the 293
presence of organic P in the sample. The Madrepora and Porites samples were not physically 294
cleaned, representing the whole coral skeleton and the sampled areas may include remnant 295
cellular material from either the coral polyp, products of bioerosion or endosymbionts (the latter 296
refers only to Porites), although phosphonates are known to adsorb strongly to calcite surfaces 297
(Sawada et al., 2003; Kan et al., 2005) and could interact similarly with aragonite and become 298
occluded during crystal growth. Since the NMR methods applied here cannot differentiate 299
between organic matter occluded in the aragonite, and that of remnant cellular material, we did 300
not explore these samples further. 301
3.1.4. 31P NMR of Synthetic Aragonite/phosphate coprecipitates 302
A broad peak near δP = 4 ppm that is similar in both chemical shift, width, and CP
303
kinetics behavior to the broad peak observed for the coral samples dominates 31P NMR spectra 304
of synthetic aragonite precipitated from solutions containing 1 - 3 μM DIP (Fig. 1 i-j). The 305
synthetic samples range in P concentration from 100 to 700 g/g but their NMR spectra showed 306
no significant differences other than corresponding variations in signal intensity. The 31P 307
CP/MAS spectra of these aragonite/phosphate coprecipitates also contain small, narrow peaks at 308
δP = 11.4 and 8.4 ppm that are not apparent in the quantitative 31P SP/MAS spectra (Fig. 1 i,j),
suggesting they arise from phosphate associated with H in minor unidentified crystalline phases. 310
A peak for apatite-like orthophosphate was not observed for any synthetic sample. 311
3.2. 31P{1H} HetCor NMR of Coral samples
312
Since the source of P in the synthetic samples is known we can assign the resulting NMR 313
signal at P = 4 ppm to inorganic phosphate. However, the source of the δP = 4 ppm peak in the
314
coral samples cannot be inferred simply by comparison of the 31P data because organic
315
phosphate esters can give NMR peaks in the same 31P chemical shift region (Teleman et al.,
316
1999; Paytan et al., 2003; Cade-Menun, 2005). Distinction between organic and inorganic 317
phosphate can be aided by 1H NMR of the H associated with P, since the 1H chemical shifts of
318
organophosphate aliphatic H, which range from δH = 2.0 to 4.0 (Teleman et al., 1999), differ
319
from those typical of HPO4 groups and structural H2O, in the 4.0 to 12.0 ppm range (Yesinowski
320
and Eckert, 1987). We used 31P{1H} HetCor methods to selectively observe the 1H spectra of
321
only those H located near P, by detecting the 1H from which magnetization is transferred during 322
1H → 31P CP. The 31P-detected 1H spectrum for a sample containing no apatite (DD G16505 S)
323
shows a narrow peak at δH = 5.5 ppm that is underlain by a broad peak centered near 7.5 ppm
324
(8.2 ppm fwhm) with a broad spinning sideband pattern (Fig. 4a). Neither peak occurs in the 325
chemical shift range for aliphatic H in organophosphates (Teleman et al., 1999), but are 326
consistent with assignment to molecular water undergoing restricted motion (5.5 ppm) and either 327
rigid structural water or weakly H-bonded hydrogen phosphate (7.5 ppm). The synthetic 328
aragonite/phosphate coprecipitate yielded a 31P-detected 1H spectrum (Fig. 4b) that is similar to 329
that of the coral aragonite, containing a narrow peak at H = 6 ppm and a broader peak centered
330
near 8 ppm with a substantial spinning sideband pattern. Acquisition of these HetCor spectra 331
required over one week of spectrometer time each, making it impractical to collect such data for 332
all of the coral samples. Considering that the broad peak near +4 ppm (the main signal in 31P
333
NMR spectra of the coral and synthetic samples) exhibits the same CP kinetics behavior in all 334
samples and that the CP kinetics depends on the nature of H near P, it is reasonable to infer that 335
the hydrogen environments observed in these HetCor spectra represent those associated with P in 336
all samples which yield a similar 31P NMR signal . 337
3.3. REDOR NMR 338
3.3.1. 31P{13C} REDOR NMR of synthetic aragonite/phosphate coprecipitates 339
The similarity of both the 31P and (31P-detected) 1H NMR data for the coral aragonite to
340
those for the synthetic aragonite/phosphate coprecipitate provides strong evidence that the nature 341
of the phosphate is the same in both, i.e. orthophosphate. Based only on these NMR data, 342
however, occurrence of phosphate as a substitution defect in the aragonite structure cannot be 343
distinguished from a separate amorphous Ca-phosphate phase, since the latter yield similar 344
spectra (Rothwell et al., 1980; Kaflak et al., 2006). A test for the presence of phosphate as 345
defects in the aragonite structure can be obtained from a 31P{13C} REDOR NMR experiment,
346
which depends on atomic-scale spatial proximity between 31P and 13C nuclei (within a few Å). 347
For this experiment we used an aragonite/phosphate coprecipitate synthesized with 13C-enriched
348
carbonate because REDOR detects proximity to only the NMR-active 13C isotope, the natural 349
abundance of which (1.1%) is too low to yield a detectable REDOR effect for the very weak 31P
350
signal. The REDOR experiment compares two 31P spectra, a control spectrum (S
0; Fig. 5a,c),
351
containing signal from all P in the sample, and a REDOR spectrum (S; Fig. 5b,d) obtained in a 352
similar manner as for S0, except that dephasing pulses are applied at the 13C frequency to
re-353
introduce 31P/13C dipolar coupling, causing a decrease in signal intensity for P located near 13C. 354
Simulations of the REDOR experiment indicate that no significant decrease in the 31P peak
355
intensity should occur for P located farther than 5 Å from 13C. 356
The REDOR results at a 6.7 ms dephasing period show a large REDOR fraction 357
[(S0-S)/S0] = 0.7 for the broad peak near δP = 4 ppm. This value is similar to but somewhat lower
358
than the maximum REDOR fraction (0.90) that could be expected for phosphate in the aragonite 359
structure, estimated using the SPINEVOLUTION software (Veshort and Griffen, 2006) with a 360
P/C configuration corresponding to substitution of phosphate for a carbonate group in the 361
aragonite structure (6 C surrounding a central P at a distance of 3.2 Å; Fig. 6). A REDOR 362
fraction smaller than this maximum value would be expected to result from structural disruption 363
around a phosphate defect that would lead to fewer adjacent carbonate groups and/or longer P-C 364
distances. However, multiple short (< 4 Å) P-C distances are required to explain this P/C 365
REDOR result, which would seem possible only if the phosphate occurs in the structure of the 366
carbonate phase. Similar REDOR results were obtained whether SP or CP excitation of 31P was
367
used (cf. Fig. 5a,b and c,d), strongly suggesting that much of the phosphate in aragonite is 368
associated with H, and hence that H-bearing species play a role in accommodating the defect. 369
3.3.2. 1H{31P} and 19F{1H} REDOR NMR of coral samples 370
To determine the nature of the crystalline apatite inclusions that occur in some coral 371
specimens, 1H{31P} and 19F{31P} REDOR NMR experiments were applied that would identify
372
signals from H or F located in close proximity to P. Fluorapatite is a significant sink for 373
phosphate in marine sediments (Kim et al., 1999) whereas biogenic apatite is composed 374
primarily of carbonate-substituted hydroxylapatite (Elliot, 2002). The 19F NMR spectrum for the
375
Flabellum sp. theca sample (Fig. 7) is complex with multiple peaks. None of these peaks can be 376
assigned to fluorapatite, which would occur at a chemical shift near -102 ppm (Braun and Jana, 377
1995), nor to any other phase for which 19F NMR data have been reported in the literature. In
378
addition, no 19F{31P} REDOR effect was observed for any 19F peak, further indicating that no 379
significant fraction of the F is associated with P, and hence that the apatite detected by 31P NMR
380
does not correspond to fluorapatite (Fig. 7). The 1H{31P} REDOR data (Fig. 8) were obtained
381
for a Desmophyllum dianthus theca wall sample (DD CHILE Coral A). The control spectrum 382
contains peaks at δH = 4.8 and 1.5 ppm that do not exhibit decreased intensity in the REDOR
383
spectrum, but which correspond well to signals assigned to water molecules and structural 384
hydroxyl in a previous NMR study of calcium carbonate minerals (Gaffey, 1995). A very small 385
peak occurs near δH = 0.2 ppm that is near the chemical shift reported for hydroxylapatite
386
(Yesinowski and Ekert, 1987), but which is marginally above the noise. This peak is clearly 387
absent from the 1H{31P} REDOR spectrum (cf. Fig. 8a and b), indicating proximity to P and
388
consistent with assignment to hydroxylapatite. These observations support the idea that the 389
narrow peak in 31P{1H} CP spectra (Fig. 2a) arises from hydroxylapatite inclusions.
390
Hydroxylapatite can also contain significant amounts of F; however, the hydroxyl peak in a 391
mixed OH,F apatite would be expected to occur at a more positive chemical shift of about 1.2 to 392
1.4 ppm (Yesinowski and Ekert, 1987). 393
3.4. Quantification of the 31P NMR signal 394
3.4.1. Relative hydroxylapatite content 395
Since acquisition of quantitative 31P NMR spectra is extremely time-consuming, and impractical
396
at P contents less than about 200 µg/g, we developed a relationship between relative intensities 397
in 31P SP/MAS and 31P{1H} CP/MAS spectra as a means to estimate the proportion of
398
hydroxylapatite. Ideally the relative abundances of P corresponding to the peaks at P = 2.7 and 4
399
ppm would be derived through the careful integration of 31P SP/MAS NMR spectra. However, 400
the low concentration of P in the samples and the long experimental relaxation delays (100’s of 401
seconds) needed for quantitative results required almost 4 days of continuous spectrometer time 402
for some samples. Acquisition of a 31P{1H} CP/MAS NMR spectrum takes less than half the
403
time to obtain similar signal to noise ratio but the results are not quantitative without careful 404
analysis of CP kinetics (Kolodziejski and Klinowski, 2002), which can be time-consuming. 405
Therefore we estimated the relative abundance of apatite in the aragonitic coral skeletons from 406
CP/MAS spectra using a correlation between SP/MAS and CP/MAS intensities similar to that 407
described by Mason et al. (2007). The integrated intensity ratio of the peaks at 4 and 2.7 ppm 408
was determined from a SP spectrum acquired under quantitative conditions for a sample that 409
contained a high fraction of P in apatite (Desmophyllum dianthus septa sample: DD LM99 124). 410
These integrated intensities are proportional to the number of P in the respective environments, 411
meaning that 35 5% of the P in this sample occurs in apatite (peak at 2.7 ppm; Table 1). A 412
correction factor for CP/MAS spectra was then obtained by comparing this SP integrated 413
intensity ratio with that obtained from a CP/MAS spectrum of the same sample (1 ms contact 414
time). This correction factor was applied to the integrated intensity ratios obtained from 415
CP/MAS spectra of the other samples (1 ms contact time), yielding estimates for the percentage 416
of the 31P-NMR detected P that occurs in apatite (Table 1, last column).
417
3.4.2. P concentrations in the solid 418
For several samples we independently measured P content using solution ICPMS in 419
addition to the LA-ICPMS analyses (Table 2). The solution ICPMS data provides an accurate 420
measure of the bulk P content of these samples and any disparity with the LA-ICPMS data was 421
attributed to the former method, which only analyzes the outer septal layers that may not 422
accurately reflect the bulk P content which is detected by NMR (Montagna et al., 2009; 423
Anagnostou et al., 2011). We also estimated the bulk P content for several samples from NMR 424
data for comparison to the solution ICPMS results. The 31P{1H} CP/MAS NMR intensity of a 425
sample of known bulk P content (synthetic aragonite containing 530 µg/g P as determined from 426
the synthesis method) was compared to that for the unknown, collected under identical 427
acquisition conditions (5 kHz spinning rate, 2 ms contact time, 2.0 s pulse delay) and scaled by 428
mass and number of acquisitions. The synthetic aragonite yielded no detectable signal for apatite 429
in CP/MAS spectra collected under conditions (10 ms contact time) that would favor its 430
observation. We assume that the CP kinetics for the phosphate species are reasonably consistent 431
among samples. Using this method we estimate 77 ±12 µg/g P for the DD-CHILE-TW, 200 432
±28 µg/g P for the LP COBAS 109, and 126 ±18 µg/g P for the DD-CHILE-S samples. The 433
concentrations for the two former samples agree well with the solution ICPMS analyses (Table 434
2). A portion of the sample DD-CHILE-TW that was chemically treated using the method 435
designed to remove surface sorbed metals and metal oxides (DD-CHILE-TW-ct) showed a 54% 436
reduction of P content to 35±5µg/g P. However, its 31P CP/MAS NMR spectral profile did not
437
differ significantly from that of the untreated material (cf. Fig 3). These results suggest that both 438
the CP/MAS NMR spectra and the solution ICPMS methods are detecting the same pool of P, 439
and that there is no significant fraction of P undetected by NMR. Furthermore, although the 440
chemical cleaning procedure appears to preferentially remove aragonite around phosphate 441
defects, there does not appear to be a significant difference in the bonding environment of the 442
remaining phosphate. 443
3.4.3. Absolute hydroxylapatite content 444
Combining the relative abundance of hydroxylapatite derived from NMR with absolute 445
P-contents from solution ICPMS data on the same sample, the amount of hydroxylapatite can be 446
estimated (Table 2). The result is a wide range of hydroxylapatite contents with no obvious 447
relationship to environmental factors such as depth and DIP. Nor do the concentrations of 448
hydroxylapatite correlate with the absolute P content determined from solution ICPMS. For 449
example, solution ICPMS data indicate DD G16505 TW contains only 22 µg/g P, but a large 450
percentage, 31%, occurs in hydroxylapatite. Moreover, there seems to be no clear correlation 451
between the apatite content and the preservation state of the corals (i.e. alive or fossil). 452
3.5. Nature of P in coral aragonite 453
Previous studies have suggested that the majority of P present in coral skeletons exists as 454
organic P-species (Dodge et al., 1984; Shotyk et al., 1995; LaVigne et al., 2008; Anagnostou et 455
al, 2011). This conclusion is based primarily on the results of various extraction procedures 456
relying on assumptions about the solubility and availability of organic versus inorganic P-457
species. Since many studies assume that the acid-insoluble fraction contains only organic P, the 458
presence of relatively insoluble Ca-phosphates and possibly adsorption of phosphate onto 459
insoluble particles upon release by aragonite dissolution could skew the results of such an assay. 460
The results of the present study clearly show that the principal P-species present in most coral 461
aragonite samples closely resembles spectroscopically that produced by simply incorporating 462
dissolved inorganic phosphate during aragonite crystal growth. 463
The chemical cleaning methods employed here were originally designed to remove oxide 464
coatings and metals not incorporated into the aragonite structure. We do observe a substantial 465
decrease in the P concentration of the chemically treated samples. However, we attribute this 466
result to preferential dissolution of phosphate-rich regions, rather than the removal of P 467
associated with Fe-Mn or other metal oxide minerals. The NMR-derived P concentrations for 468
untreated samples are in reasonable agreement with those obtained by solution ICPMS methods 469
for the same samples. If a significant pool of P was associated with Fe-Mn crusts a large 470
discrepancy between these values would be expected due to the inability of the NMR methods 471
employed here to observe P associated with ions having unpaired electrons (Grey et al, 2010). 472
Montagna et al. (2009) and Anagnostou et al. (2011) have shown that the outer surface of 473
coral septa produce higher LA-ICPMS derived P concentrations than the interior portions. 474
Montagna et al. (2009) attributed these differences to the presence of P rich species such as 475
hydroxylapatite in the outer septal surface. Since the NMR methods applied here are bulk 476
techniques, we cannot differentiate between P contained in P rich outer layers and that contained 477
within the less P rich internal microstructures. Given the results of Montagna et al. (2009), the 478
observed drop in the NMR derived P concentrations after the application of the chemical 479
cleaning methods could be attributed to the removal of defect and P rich portions of the coral 480
aragonite which are more susceptible to dissolution. 481
3.6. Implications for further studies of P proxies in coral 482
A robust relationship between P/Ca ratio of coral aragonite and DIP suitable for use as a 483
paleo-nutrient proxy would seem possible only if P occurs in the aragonite structure as phosphate 484
defects. Simple trace element partitioning models developed for inorganic carbonates have been 485
applied to surface and deep-water coral aragonite (Gaetani and Cohen, 2006; Sinclair and Risk, 486
2006; Gagnon et al., 2007), with the assumption that the coral polyp precipitates aragonite 487
extracellularly from a calcifying fluid located between the polyp and the previous skeletal 488
aragonite (Cohen and McConnaughey, 2003). This fluid consists of seawater, which is 489
supersaturated respect to calcium carbonate through an enzymatic input of Ca2+ and removal of
490
2H+ (Cohen and McConnaughey, 2003). At least three processes could lead to P incorporation 491
into coral aragonite, including encapsulation of surface precipitates, occlusion of organic matter, 492
and co-precipitation of dissolved inorganic phosphate as a substitution defect in the aragonite 493
likely initiated as a surface-adsorption complex. Of these, only in the latter could it be expected 494
that equilibrium is established between surface adsorbed phosphate and dissolved phosphate in 495
the aqueous phase as required for a linear partition coefficient (Rimstidt et al., 1998; Curti, 496
1999). Standard methodology used for proxy development such as LA-ICPMS, ion microprobe 497
and and x-ray adsorption spectroscopy (XAS) cannot yet provide the molecular-scale spatial 498
relationships between P and carbonate necessary to test whether P occurs in the aragonite 499
structure. The results obtained in the present study suggest that co-precipitation of phosphate is 500
the dominant process of P incorporation in deep-water corals lending support for the use of P/Ca 501
as a proxy. However, many of the studied samples also contain significant amounts of apatite 502
that could cause systematic error in proxy relationships, but which is easily detected using the 503
methods described here. Given the limited number of samples studied here, and the results 504
showing the incorporation of organo-P-species in some samples, screening of additional coral 505
samples may also be warranted. Taking into account possible contamination by crystalline 506
inclusions, careful selection of the coral portion to be analyzed (e.g. Montagna et al., 2009; 507
Anognastou et al., in press) should make it possible to obtain a more robust P/Ca vs. DIP 508
calibration, useful for paleo-nutrient reconstructions. 509
510
Acknowledgments: 511
This research was supported by the U.S. NSF (EAR-0819838), and instrumentation provided by 512
NSF CHE-03-21001. P. Montagna acknowledges financial support from the Marie Curie 513
International Outgoing Fellowship. Coral collection was funded by CNR grants, ESF 514
Moundforce and EU Hermes projects; Bruno Briano (Savona, Italy) and Günter Försterra kindly 515
supplied corals from offshore Madagascar and the Chilean fiords, respectively. Ship time of RV 516
Urania provided by CNR is gratefully acknowledged. This is ISMAR-Bologna scientific 517
contribution n. 1688. H.M. was supported through a U.S. Dept. of Education sponsored GAANN 518
fellowship (P200A060248). 519
520 521
This work performed under the auspices of the U.S. Department of Energy by Lawrence Livermore National Laboratory under Contract DE-AC52-07NA27344.
References 522
Ahlgren J., Brabandere H. D., Reitzel K., Rydin E., Gogoll A., and Waldeback M. (2007) 523
Sediment phosphorus extractants for phosphorus-31 nuclear magnetic resonance 524
analyses: A quantitative evaluation. J. Environ. Qual. 36, 892-898 525
526
Anagnostou E., Sherrell R. M., Adkins J. F., and Gagnon A. C. (2007) Phosphorus, barium and 527
boron in the deep-sea coral Desmophyllum dianthus: Preliminary calibrations. Geochim. 528
Cosmochim. Acta 71, A22. 529
530
Anagnostou E., Sherrell R. M., Gagnon A., LaVigne M., Field M.P., McDonough W.F. (2011) 531
Seawater nutrient and carbonate ion concentrations recorded as P/Ca, Ba/Ca, and U/Ca in 532
the deep-sea coral Desmophyllum dianthus. Geochim. Cosmochim. Acta 75, 2529-2543 533
534
Belton P. S., Harris R. K., and Wilkes P. J. (1988) Solid-state 31P NMR studies of synthetic
535
inorganic calcium phosphates. J. Phys. Chem. Solids 49, 21-27. 536
537
Braun M. and Jana C. (1995) 19F NMR spectroscopy of fluoridated apatites. Chem. Phys. Lett.
538
245,19-22. 539
540
Broecker, W. S. (1982), Ocean geochemistry during glacial time, Geochim. Cosmochim. Acta, 541
46, 1689– 1705. 542
543
Cade-Menun B. J. (2005) Characterizing phosphorus in environmental and agricultural samples 544
by 31P nuclear magnetic resonance spectroscopy. Talanta 66, 359-371.
545 546
Cheng H., Adkins J., R. Edwards R.L., and Boyle E.A. (2000) U-Th dating of deep sea corals 547
Geochim. Cosmochim. Acta 64, 2401-2416. 548
549
Cohen A. L. and McConnaughey T. A. (2003) Geochemical perspectives on coral 550
mineralization. Rev. Min. Geochem. 54, 151-187. 551
552
Curti E. (1999) Coprecipitation of radionuclides with calcite: estimation of partition coefficients 553
based on a review of laboratory investigations and geochemical data. Appl. Geochem. 14, 554
433-445. 555
556
Dodge R. E., Jickells T. D., Knap A. H., Boyd S., and Bak R. P. M. (1984) Reef-building coral 557
skeletons as chemical pollution (phosphorus) indicators. Mar. Pollut. Bull. 15, 178-187. 558
559
Elliott J. C. (2002) Calcium phosphate biominerals. Rev. Mineral. Geochem. 48, 427-453. 560
561
Gaetani G. A., and Cohen A. L. (2006) Element partitioning during precipitation of aragonite 562
from seawater: A framework for understanding paleoproxies. Geochim. Cosmochim. Acta 563
70, 4617-4634. 564
565
Gaffey S. J. (1995) H O and OH in echinoid calcite: A spectroscopic study. Am. Mineral. 80, 566
947-959. 567
568
Gagnon A. C., Adkins J. F., Fernandez D. P., and Robinson L. F. (2007) Sr/Ca and Mg/Ca vital 569
effects correlated with skeletal architecture in a scleractinian deep-sea coral and the role 570
of Rayleigh fractionation. Earth Planet. Sci. Lett. 261, 280-295. 571
572
Glonek T., Henderson T. O., Hilderbrand R. L., and Myers T. C. (1970) Biological 573
phosphonates: determination by phosphorus-31 nuclear magnetic resonance. Science 169, 574
192-194. 575
576
Grey, C. P.; Kim, J.; Middlemiss, D. S.; Chernova, N. A.; Zhu, B. Y. X.; Masquelier, C., Linking 577
local environments and hyperfine shifts: a combined experimental and theoretical 31P and
578
7Li solid-state NMR study of paramagnetic Fe(III) phosphates. J. Am. Chem. Soc. 2010,
579
132, 16825-16840. 580
581
Hinedi Z. R., Goldberg S., Chang A. C., and Yesinowski J. P. (1992) A 31P and 1H MAS NMR 582
study of phosphate sorption onto calcium carbonate. J. Colloid Interf. Sci. 152, 141-160. 583
584
House W. A. and Donaldson L. (1986) Adsorption and coprecipitation of phosphate on calcite. 585
J. Colloid Interf. Sci. 112, 309-324. 586
587
LaVigne M., Field, M. P., Anagnostou, E., Grottoli, A. G., Wellington, G. M., and Sherrell, R. 588
M. (2008) Skeletal P/Ca tracks upwelling in Gulf of Panama coral: Evidence for a new 589
seawater phosphate proxy. Geophys. Res. Lett. 35, L05604. 590
591
LaVigne M., Matthews K.A., Grottoli A.G., Cobb K.M, Anagnostou E., Cabioch G., and 592
Sherrell R.M. (2010) Coral skeleton P/Ca proxy for seawater phosphate: Multi-colony 593
calibration with a contemporaneous seawater phosphate record. Geochim. Cosmochim. 594
Acta 74, 1282-1293. 595
596
Kaflak A., Chmielewski D., Gorecki A., Slorarczyk A., and Kolodziejski W. (2006) Efficiency 597
of 1H→31P cross-polarization in bone apatite and its mineral standards. Solid State NMR
598
29, 345-348. 599
600
Kan A. T., Fu G. M., and Tomson M. B. (2005) Adsorption and precipitation of an 601
aminoalkylphosphonate onto calcite. J. Colloid Interf. Sci. 281, 275-284. 602
603
Kim D., Schuffert J. D., and Kastner M. (1999) Francolite authigenesis in California continental 604
slope sediments and its implications for the marine P cycle. Geochim. Cosmochim. Acta 605
63, 3477-3485. 606
607
Kolodziejski W. and Klinowski J. (2002) Kinetics of cross-polarization in solid-state NMR: A 608
guide for chemists. Chem. Rev. 102, 613-628. 609
610
Kolowith L. C., Ingall E. D., and Benner R. (2001) Composition and cycling of marine organic 611
phosphorus. Limnol. Oceanogr. 46, 309-320. 612
613
Koutsoukos P. G. and Nancollas G. H. (1981) Crystal growth of calcium phosphates: epitaxial 614
considerations. J. Cryst. Growth 53, 10-19. 615
616
Kumarsingh K., Laydoo R., Chen J. K., and Siung-Chang A. M. (1998) Historic records of 617
phosphorus levels in the reef-building coral Montastrea annularis from Tobago, West 618
Indies. Mar. Pollut. Bull. 36, 1012-1018. 619
620
Mason H. E., Frisia S., Tang Y., Reeder R. J., and Phillips B. L. (2007) Phosphorus speciation in 621
calcite speleothems determined from solid-state NMR spectroscopy. Earth Planet. Sci. 622
Lett. 254, 313-322. 623
624
Millero F., Huang F., Zhu X. R., Liu X. W., and Zhang J. Z. (2001) Adsorption and desorption of 625
phosphate on calcite and aragonite in seawater. Aquat. Geochem. 7, 33-56. 626
627
Milliman J. D. and Bornhold B. D., (1973) Peak height versus intensity analysis of X-ray 628
diffraction data. Sedimentology 20, 445-448 629
630
Montagna P., McCulloch M., Taviani M., Mazzoli C., and Vendrell B. (2006) Phosphorus in 631
cold-water corals as a proxy for seawater nutrient chemistry. Science 312, 1788-1791. 632
633
Montagna P., McCulloch M., Mazzoli C., Silenzi S. and Odorico R. (2007). The non-tropical 634
coral Cladocora caespitosa as the new climate archive for the Mediterranean Sea: high- 635
resolution (~ weekly) trace element systematics. Quaternary Science Review, 26, 441- 636
462. 637
638
Montagna P., McCulloch M., Taviani M., Trotter J. and Silenzi S. (2009) An improved sampling 639
method for P/Ca as a nutrient proxy. Geochem. Cosmochim. Acta 73, A895. 640
641
Morse J. W., Zullig J. J., Bernstein L. D., Millero F. J., Milne P., Mucci A., and Choppin G. R. 642
(1985) Chemistry of calcium carbonate-rich shallow water sediments in the Bahamas. 643
Am. J. Sci. 285, 147-185 644
645
Paytan A., Cade-Menun B. J., McLaughlin K., and Faul K. L. (2003) Selective phosphorus 646
regeneration of sinking marine particles: evidence from 31P-NMR. Mar. Chem. 82, 55-70.
647 648
Reeder R. J., Nugent M., Lamble G. M., Tait C. D., and Morris D. E. (2000) Uranyl 649
incorporation into calcite and aragonite: XAFS and luminescence studies. Env. Sci. 650
Technol. 34, 638-644. 651
652
Rimstidt J. D., Balog A., and Webb J. (1998) Distribution of trace elements between carbonate 653
minerals and aqueous solutions. Geochim. Cosmochim. Acta 62, 1851-1863. 654
655
Rothwell W. P., Waugh J. S., and Yesinowski J. P. (1980) High-resolution variable-temperature 656
31P NMR of solid calcium phosphates. J. Am. Chem. Soc. 102, 2637-2643.
657 658
Sarmiento J. L., Hughes T. M. C., Stouffer R. J., and Manabe S. (1998) Simulated response of 659
the ocean carbon cycle to anthropogenic climate warming, Nature 393, 245–249. 660
661
Sawada K., Abdel-Aal N., Sekino H., and Satoh K. (2003) Adsorption of inorganic phosphates 662
and organic polyphosphonate on calcite. J. Chem. Soc. Dalton Trans. 3, 342-347. 663
664
Sinclair D. J., and Risk M. J. (2006) A numerical model of trace-element coprecipitation in a 665
physicochemical calcification system: Application to coral biomineralization and trace-666
element 'vital effects'. Geochim. Cosmochim. Acta 70, 3855-3868. 667
668
Shen G.T. and Boyle E.A. (1988) Determination of lead, cadmium, and other trace metals in 669
annually-banded corals. Chem. Geol. 67, 47-62. 670
671
Shotyk W., Immenhauserpotthast I., and Vogel H. A. (1995) Determination of Nitrate, Phosphate 672
and Organically Bound Phosphorus in Coral Skeletons by Ion Chromatography. J. 673
Chromatogr. A. 706, 209-213. 674
675
Teleman A., Richard P., Toivari M., and Penttilla M. (1999) Identification and quantitation of 676
phosphorus metabolites in yeast neutral pH extracts by nuclear magnetic resonance 677
spectroscopy. Anal. Biochem. 272, 71-79. 678
679
Turner G. L., Cade-Menun B. J., Condron L. M., and Newman S. (2005) Extraction of soil 680
organic phosphorus. Talanta 66, 294-306 681
682
Turner B. L., Smith K. A., Kirkpatrick R. J., and Oldfield E. (1986) Structure and cation effects 683
on 31P NMR chemical shifts and chemical-shift anisotropies of orthophosphates. J. Magn. 684
Reson.70, 408-415. 685
686
Vandecasteele C. and Block C.B. (1997). Modern methods for trace element determination. John 687
Wiley & Sons Ltd, West Sussex, England. 688
689
Veshtort M. and Griffin R. G. (2006) SPINEVOLUTION: A powerful tool for the simulation of 690
solid and liquid state NMR experiments. J. Mag. Reson. 178, 248-282. 691
692
Volk T. and Hoffert M. I. (1985), Ocean carbon pumps: Analysis of relative strengths and 693
efficiencies in ocean-driven atmospheric CO2, in The Carbon Cycle and Atmospheric
694
CO2: Natural Variations Archean to Present, edited by E. T. Sundquist and W. S.
695
Broecker, pp. 99 – 110, AGU, Washington D. C. 696
697
Yesinowski J. P. and Eckert H. (1987) Hydrogen environments in calcium phosphates: 1H MAS 698
NMR at high spinning speeds. J. Am. Chem. Soc. 109, 6274-6282. 699
700
Zhong S. J. and Mucci A. (1993) Calcite precipitation in seawater using a constant addition 701
technique: A new overall reaction kinetic expression. Geochim. Cosmochim. Acta 57, 702
1409-1417. 703
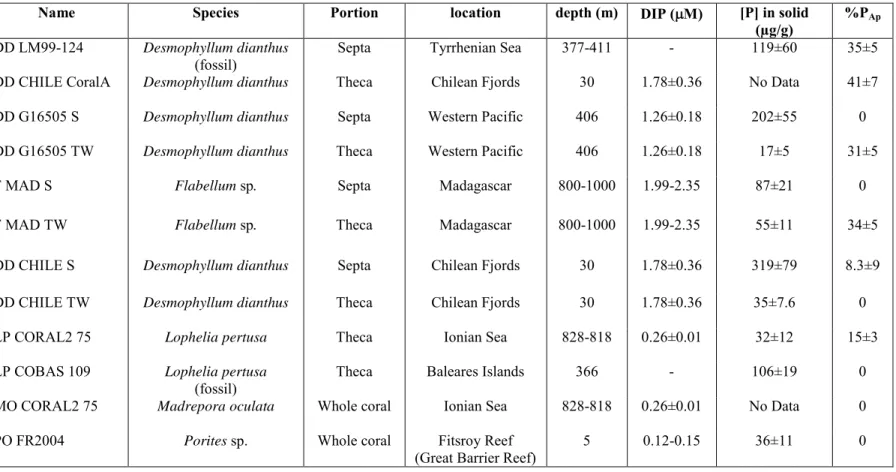
Table 1: Coral samples studied by 31P NMR, including the location, depth, and dissolved inorganic phosphorus (DIP) concentration of
704
waters in which sample grew at the time of collection. Percentage of the total P contained in apatite (% PAp) was estimated by NMR
705
(See text). All corals were live at the time of collection unless otherwise indicated (f = fossil). The LA-ICPMS precision (RSD) for the 706
phosphorus concentration is ~ 6% (see methods). 707
708
Name Species Portion location depth (m) DIP ( M) [P] in solid
(µg/g) %PAp DD LM99-124 Desmophyllum dianthus
(fossil) Septa Tyrrhenian Sea 377-411 - 119±60 35±5
DD CHILE CoralA Desmophyllum dianthus Theca Chilean Fjords 30 1.78±0.36 No Data 41±7
DD G16505 S Desmophyllum dianthus Septa Western Pacific 406 1.26±0.18 202±55 0
DD G16505 TW Desmophyllum dianthus Theca Western Pacific 406 1.26±0.18 17±5 31±5
F MAD S Flabellum sp. Septa Madagascar 800-1000 1.99-2.35 87±21 0
F MAD TW Flabellum sp. Theca Madagascar 800-1000 1.99-2.35 55±11 34±5
DD CHILE S Desmophyllum dianthus Septa Chilean Fjords 30 1.78±0.36 319±79 8.3±9
DD CHILE TW Desmophyllum dianthus Theca Chilean Fjords 30 1.78±0.36 35±7.6 0
LP CORAL2 75 Lophelia pertusa Theca Ionian Sea 828-818 0.26±0.01 32±12 15±3
LP COBAS 109 Lophelia pertusa
(fossil) Theca Baleares Islands 366 - 106±19 0
MO CORAL2 75 Madrepora oculata Whole coral Ionian Sea 828-818 0.26±0.01 No Data 0
PO FR2004 Porites sp. Whole coral Fitsroy Reef
Table 2: P concentration data for select coral samples obtained from solution ICPMS and NMR 709
methods. [P]Ap determined from % PAp values in Table 1. The solution ICPMS precision (RSD)
710
for the P/Ca and P concentration is ~ 9.5% (see methods). 711
712
Name P/Ca
(µmol/mol) [P] (µg/g)ICPMS [P] (µg/g)NMR [P]Ap NMR/ICPMS(µg/g)
DD G16505 S 121±11 38±4 No Data 0
DD G16505 TW 68±6 22±2 No Data 7±1
DD CHILE TW No Data No Data 77±12 No Data
DD CHILE TW-ct No Data No Data 35±5 No Data
DD CHILE S 331±31 118±11 126±18 10±1
DD CHILE S-ct 253±24 83±8 No Data No Data
LP CORAL2 75 49±5 16±2 No Data 2±1
LP COBAS 109 374±36 123±12 200±28 0
Figure Captions: 714
Figure 1: 31PNMR spectra for coral aragonite and aragonite/phosphate coprecipitate samples.
a-715
f) 31P{1H} CP/MAS NMR spectra of coral septa and thecal wall aragonite a) septa and b) thecal
716
wall of Desmophyllum dianthus (DD CHILE TW) c) septa and d) thecal wall of Flabellum sp. (F 717
MAD TW) e) live collected (LP CORAL2 75) and f) fossil (LP COBAS 109) samples of 718
Lophelia pertusa thecal wall g-h) 31P{1H} CP/MAS spectra of whole coral samples Madrepora 719
oculata (MO CORAL2 75) and Porites sp. (PO FR2004), respectively. i-j) 31P{1H} CP/MAS 720
spectra of aragonite/phosphate co-precipitated samples containing i) 306 µg/g and j) 102 µg/g P. 721
All spectra obtained using a spinning rate of 5 kHz, 2 ms CP contact time, and 2 s pulse delay 722
except h) 10 kHz spinning rate and 120 s pulse delay and i-j) 2 ms CP contact time, 2 s pulse 723
delay and a spinning rate of 3 kHz. Asterisks mark the location of spinning sidebands. 724
725
Figure 2: 31P MAS NMR spectra collected of Desmophyllum dianthus coral septa (DD LM99
726
124) from the Tyrrhenian Sea. a-c) 31P{1H} CP/MAS NMR spectra collected at a 3 kHz spinning
727
rate and 2 s pulse delay for 4672 acquisitions using contact times of a) 10 ms, b) 1 ms, and c) 0.2 728
ms. d) 31P SP/MAS NMR spectrum obtained with a 5 kHz spinning rate and 120 s pulse delay
729
for 819 acquisitions. e) Components of the least squares fit to the spectrum shown in d), 730
vertically offset for clarity. 731
732
Figure 3: 31P{1H} CP/MAS NMR spectra of septa for Desmophyllum dianthus sample DD
733
CHILE S collected using 2 s pulse delay and 5 ms CP contact time at a spinning rate of 3 kHz. a) 734
Spectra taken from a sample that was only physically cleaned to remove surface contaminants. 735
b) Spectra taken from a sample that underwent the chemical treatment outlined by LaVigne et. 736
al. (2008). Asterisks mark the location of spinning sidebands. 737
738
Figure 4: 31P-detected 1H MAS/NMR obtained from summed projections of 2-d 31P{1H} CPMG
739
HetCor data for a) Desmophyllum dianthus coral sample DD G16505 S and b) synthetic 740
aragonite/phosphate coprecipitate (520 µg/g P) . Both were collected at 2 ms contact time and 10 741
kHz spinning rate. Asterisks mark the location of spinning sidebands. 742
743
Figure 5: 31P{13C} REDOR NMR spectral sets for 13C-enriched aragonite/phosphate
744
coprecipitate collected at a 6 kHz spinning rate and 6.7 ms dephasing period. SP: Standard 745
SP/REDOR, CP: CP/REDOR with 2 ms 31P{1H} CP preparation. a, d) Echo control spectra (S
0)
746
b, c) 31P{13C} REDOR spectra (S). Diamonds denote background signal from rotor and asterisks
747
mark the location of spinning sidebands. S0, S pairs are plotted at the same absolute intensity.
748 749
Figure 6: Simulated 31P{13C} REDOR dephasing curve for a 31P surrounded by 6 13C at a
750
distance of 3.2 Å. Dashed line occurs at the dephasing period where experimental data is 751
reported. 752
753
Figure 7: 19F{31P} REDOR NMR spectra collected for the Flabellum sp. theca sample (F MAD
754
S) collected at a spinning rate of 25 kHz, a 100 s pulse delay, and 1.28 ms dephasing period for 755
1488 acquisitions. Top: 19FSpin-echo control spectrum (S
0) Bottom: 19F{31P} REDOR spectrum
756
(S). Asterisks mark the location of spinning sidebands. 757
Figure 8: 1H{31P} REDOR NMR spectra for a Desmophyllum dianthus (DD CHILE CoralA)
759
sample collected at a spinning rate of 15 kHz, pulse delay of 2 s, and dephasing period of 4.4 ms 760
for 62 928 aquisitions. Spectra are shown at 5 times vertical exaggeration and truncated. a) 761
1H{31P} Spin-echo control spectrum (S
0) b) 1H{31P} REDOR spectrum (S). Dotted line denotes
762
the chemical shift of hydroxylapatite (0.2 ppm) in the Spin-echo control spectrum. Inset: 763
Expanded view of the Spin-echo control spectra over the range of 4 to -2 ppm. 764
Figure 1: 766
767 768
Figure 2: 769 770 771 772 773
Figure 3: 774
775 776
Figure 4: 777
778 779 780
Figure 5: 781
782 783
Figure 6: 784
785 786 787
Figure 7: 788
789 790
Figure 8: 791