Facteurs associés à la présence d’une orchidée rare au Québec :
Arethusa bulbosa L.
par Chantale Moisan
Institut de recherche en biologie végétale (IRBV) Département de sciences biologiques
Faculté des arts et sciences
Mémoire présenté à la Faculté des études supérieures et postdoctorales en vue de l’obtention du grade de maître ès sciences (M. Sc.)
en sciences biologiques
Juin 2011
Faculté des études supérieures et postdoctorales
Ce mémoire intitulé :
Facteurs associés à la présence d’une orchidée rare au Québec : Arethusa bulbosa L.
Présenté par : Chantale Moisan
a été évalué par un jury composé des personnes suivantes :
Alain Cogliastro, président-rapporteur Stéphanie Pellerin, directrice de recherche
Résumé
L’aréthuse bulbeuse (Arethusa bulbosa L.) est une orchidée tourbicole rare au Québec de par la petite taille de ses populations et les pressions qui pèsent sur son habitat. L’aréthuse est reconnue comme étant intolérante aux changements édaphiques de son habitat, notamment en regard du drainage. Afin de déterminer si l’aréthuse est une bonne espèce indicatrice de l’intégrité écologique des tourbières, cette étude compare des parcelles où l’espèce est présente et où elle est absente. Au cours des étés 2009 et 2010, 37 tourbières du Québec méridional ont été échantillonnées. Des analyses discriminantes ont mis en évidence les facteurs naturels ou d’origine anthropique qui expliquent le mieux la différence entre les quatre types de parcelles. Aussi, la recherche d’espèces indicatrices de la présence de l’aréthuse a été réalisée grâce à la méthode INDVAL. Les résultats montrent que l’aréthuse pousse principalement dans des tourbières présentant des conditions minérotrophes, ce qui est appuyé par le pH élevé et la présence de plantes indicatrices de minérotrophie dans les parcelles contenant l’aréthuse. Cette dernière semble aussi profiter d’une certaine atténuation de la lumière par des arbres dispersés ou par les strates plus basses. Finalement, certaines perturbations de faible ampleur semblent être bénéfiques pour l’aréthuse, ce qui ne permet pas d’affirmer qu’elle est une bonne espèce indicatrice de l’intégrité écologique des tourbières.
Mots-clés : Arethusa bulbosa, Aréthuse bulbeuse, orchidée, tourbière, plante rare, espèce
Abstract
Arethusa bulbosa L. is a peatland orchid rare in Québec because of the small size of its populations and the pressures on its habitat. It is known to be intolerant to edaphic changes of its habitat, and particularly to drainage. To determine if A. bulbosa is a good indicator species of the ecological integrity of peatlands, this study compares plots where the species is present from plots where it is absent. During the summers of 2009 and 2010, 37 peatlands were surveyed in southern Québec. Discriminant analyses were performed to find which natural or anthropogenic factors best explain the difference between plots with or without the orchid. Also, indicator species of the presence of A. bulbosa were found using INDVAL analyses. Overall, the results suggest that A. bulbosa was mostly growing in peatlands characterized by minerotrophic conditions. Two evidences supported this point, the high pH values measured and the presence of indicator species of minerotrophy in plots with the orchid. It is likely that A. bulbosa is favored by a certain interception of light by scattered trees or species growing in lower strata. Finally, despite a high floristic quality assessment index (FQAI) in A. bulbosa plots, it is likely that the species takes advantage of small-scale disturbances in it habitat and is therefore not a good indicator species of peatlands ecological integrity.
Keywords : Arethusa bulbosa, Dragon’s-mouth, orchid, peatland, rare species, plant
Table des matières
Résumé ... iii
Abstract ... iv
Table des matières ... v
Liste des tableaux ... vii
Liste des figures ... viii
Liste des sigles et des abréviations ... ix
Chapitre 1 : Introduction générale ... 1
Les tourbières ... 2
Les plantes indicatrices ... 5
L’aréthuse bulbeuse ... 7
Statut de précarité de l’aréthuse bulbeuse ... 10
Objectifs ... 12
Organisation du mémoire ... 12
Chapitre 2 : Factors associated to the presence of a rare orchid in Quebec : Arethusa bulbosa L. ... 14
Abstract ... 15
Introduction ... 16
Materials and Methods ... 18
Arethusa bulbosa ... 18
Study area and sites ... 19
Field sampling and data collection ... 20
Data analyses ... 23
Results ... 26
Factors related to the presence of Arethusa bulbosa within a peatland ... 27
Factors related to the absence of Arethusa bulbosa from historical sites ... 31
Factors related to the absence of Arethusa bulbosa from a priori suitable peatlands ... 32
Chapitre 3 : Conclusion générale ... 38
Bibliographie ... viii
Annexe I. Arethusa bulbosa ... xviii
Annexe II. Coordonnées géographiques des parcelles (degrés décimaux) ... xix
Annexe III. Abondances d’Arethusa bulbosa dans les parcelles AB et comparaison entre 2009 et 2010. ... xx
Annexe IX. Distributions des variables échantillonnées dans les parcelles contenant Arethusa bulbosa (n=24) ... xxi
Annexe V. Liste de toutes les espèces végétales recensées (nomenclature selon Integrated Taxonomic Information System) ... xxii
Annexe VI. Données brutes du chapitre 2 ... xxviii
Annexe VI-A. Données environnementales ... xxix
Annexe VI-B. Données de perturbations ... xxxiii
Annexe VI-C. Abondances relatives des espèces végétales vasculaires communes aux parcelles AB et EXT ... xxxvii Annexe VI-D. Abondances relatives des espèces végétales invasculaires
communes aux parcelles AB et EXT ... xliv Annexe VI-E. Abondances relatives des espèces végétales vasculaires
communes aux parcelles AB et HIS ... xlvii Annexe VI-F. Abondances relatives des espèces végétales invasculaires
communes aux parcelles AB et HIS ... liv Annexe VI-G. Abondances relatives des espèces végétales vasculaires
communes aux parcelles AB et OUT ... lvii Annexe VI-H. Abondances relatives des espèces végétales invasculaires
Liste des tableaux
Table I. Environmental variables used in linear discriminant analyses (LDA) ... 25 Table II. Indicator species of the presence of Arethusa bulbosa determined using
the INDVAL method. No indicator species were found between AB and
Liste des figures
Fig. 1. Aire de répartition d’Arethusa bulbosa (Flora of North America 2011) ... 7 Fig. 2. Occurrences d’Arethusa bulbosa au Québec (CDPNQ 2008) ... 11 Fig. 3. One-way ANOVA of species richnesses between plot types ... 26 Fig. 4. Linear discriminant analyses on environmental variables. A) AB vs EXT
plots; B) AB vs HIS plots; C) AB vs OUT plots. Abbreviations found in
table I. ... 28 Fig. 5. Linear discriminant analyses on vegetation variables after Hellinger
transformation. A) AB vs EXT plots, vascular species; B) AB vs EXT, vascular species; C) AB vs HIS plots, vascular species; D) AB vs HIS, non-vascular species; E) AB vs OUT plots, non-vascular species; F) AB vs OUT
Liste des sigles et des abréviations
AB Parcelle contenant l’aréthuse bulbeuseANOVA Analyse de variance
CC Coefficient de conservatisme
CDPNQ Centre de données sur le patrimoine naturel du Québec D50 Densité de canaux de drainage dans un rayon de 50 m D500 Densité de canaux de drainage dans un rayon de 500 m Dditch Distance au canal de drainage le plus près
Dedge Distance à la bordure la plus près
Dist50 Proportion de perturbation dans un rayon de 50 m Dist500 Proportion de perturbation dans un rayon de 500 m EXT Parcelle extérieure à la population d’aréthuse bulbeuse
FQAI Floristic Quality Assessment Index (Indice de la qualité floristique) Herb Recouvrement des herbacées
HIS Parcelle historique d’une occurrence de l’aréthuse bulbeuse Hshrub Hauteur moyenne des arbustes
Hum Hauteur moyenne des buttes
IndVal Indicator value (Valeur indicatrice)
K25 Conductivité électrique
LDA Linear discriminant analysis (Analyse discriminante linéaire) Light Proportion de lumière parvenant au sol
Nvas Plante invasculaire
OUT Parcelle sans occurrence de l’aréthuse bulbeuse connue P/A Effet de bordure (Périmètre/Surface)
Peat Profondeur du dépôt de tourbe SAS Statistical Analysis Software Sedge Recouvrement des cypéracées Shrub Recouvrement des arbustes
Tba Total tree basal area (Surface terrière)
“We shall never forget the moment when our eyes first fell on its blossom in the lonely depths of a sphagnum bog. The feeling was irresistible that we had surprised some strange sentient creature in its secret bower of moss; that it was alert and listening intently with prick-up ears. We believe that many of those whose senses are similarly attuned to living forms in Nature will understand exactly what we mean.”
Remerciements
Mon séjour à l’Institut de recherche en biologie végétale (IRBV) débuta lorsque Stéphanie Pellerin me reçut en entrevue en avril 2008. Mon baccalauréat terminé, j’étais à la recherche d’un emploi et Stéphanie offrait un poste d’assistant de terrain. Croyant que mes capacités allaient bien au-delà des responsabilités de ce poste, elle référa plutôt ma candidature à Alain Cogliastro qui m’embaucha à titre de coordonnatrice d’un projet de restauration au Jardin botanique de Montréal. Suite à ce contrat de six mois, Alain me réembaucha comme assistante de recherche. C’est principalement ce dernier emploi aux côtés d’Alain qui m’a donné la piqûre pour la recherche et m’a motivée à m’inscrire à la maîtrise. Merci Alain de m’avoir fait confiance, de m’avoir permis de participer à toutes les étapes de la recherche scientifique et de m’avoir présentée à l’équipe de chercheurs-botanistes et professionnels. Côtoyer ces gens m’a permis de savoir que c’était réellement ce que je souhaitais faire dans la vie.
Un grand et tout naturel merci à ma directrice Stéphanie Pellerin que je remercie d’avoir cru en mes capacités et d’avoir accepté de m’épauler tout au long de ce projet. Merci de m’avoir fait connaître cette magnifique orchidée et le plaisir de travailler dans les tourbières. J’ai grandement apprécié ton authenticité, ta rigueur et ta franchise. Tu as été d’une disponibilité irréprochable et d’une rapidité de réponse surprenante! Tes commentaires et suggestions ont toujours été des plus constructifs et, j’en suis persuadée, m’auront permis de devenir une meilleure biologiste.
J’aimerais également souligner l’important travail réalisé par mes assistants de terrain, Chantal Gagnon et Vincent Jourdan pour la saison 2009 et Cindy Bouchard, Julie L. Munger et Sylvie Deslauriers pour la saison 2010. Merci de m’avoir suivi aux quatre coins du Québec dans des milieux et des conditions parfois hostiles, votre support technique et moral était indispensable! Un merci spécial à mon collègue du laboratoire Pellerin, Vincent Laroche, qui m’a montré les rudiments de l’échantillonnage pour ce projet, ainsi que pour ses innombrables conseils. Merci aussi à mes collègues du laboratoire d’écologie pour nos nombreuses discussions sur la biologie, l’écologie, la maîtrise, mais également sur la vie en général, ce fut fondamental pour me permettre de passer à travers! : Rémy Fluet, Marie-Ève Payeur, Annie Cavanagh, Patrick Boivin, Youri Tendland et Alexandre Bergeron.
Je suis extrêmement reconnaissante de toute l’aide qui m’a été apportée par les professeurs et professionnels, notamment Pierre Legendre et Stéphane Daigle pour les analyses statistiques. Merci également à Stuart Hay et Lucie Fortin de l’Herbier Marie-Victorin pour leur précieuse aide à l’identification des spécimens. Merci à Jean Faubert de l’Université Laval pour son aide quant à l’identification des bryophytes et pour sa collaboration spéciale à l’écriture d’un article qui est paru dans les Carnets de bryologie. Merci à Marc-André Villard, professeur à l’Université de Moncton et titulaire de la Chaire de recherche en conservation des paysages pour avoir accepté de me superviser lors d’un stage dans son laboratoire. Ses précieux conseils sur les analyses statistiques et son regard extérieur sur le projet m’ont été très bénéfiques.
Ce projet de recherche a été rendu possible par l’appui du Fonds québécois de recherche sur la nature et les technologies (FQRNT) et du Conseil de recherches en sciences naturelles et en génie (CRSNG) qui m’ont chacun octroyé une bourse d’étude. J’ai également reçu le soutien financier du Centre de la science de la biodiversité du Québec
Chapitre 1 : Introduction générale
Ce mémoire de maîtrise porte sur l’étude des facteurs associés à la présence de l’aréthuse bulbeuse (Arethusa bulbosa L.), une orchidée tourbicole. Il a comme objectif global d’évaluer si la présence de cette espèce est indicatrice de l’intégrité des tourbières. Bien qu’il s’agisse d’une espèce relativement rare au Québec, elle a été choisie puisque certaines données semblaient indiquer qu’il s’agit d’une espèce peu tolérante aux changements édaphiques de son habitat, tel le drainage, et qu’elle aurait donc un fort potentiel indicateur (MDDEP 2008). D’autre part, les connaissances acquises sur son écologie constituent des informations importantes qui pourront servir à assurer sa conservation. Cet aspect est d’ailleurs l’élément central du chapitre 2. Dans les prochaines sections, je présente d’abord un survol de l’état des tourbières au Québec, suivi de quelques notions sur les espèces indicatrices, en terminant par des informations plus spécifiques sur l’aréthuse de même que sur son statut de précarité.
Les tourbières
Les milieux humides (marais, marécages, plans d’eau peu profonds et tourbières) couvrent environ 5% de la surface terrestre (Nord-Varhaug 1996). Les tourbières représentent entre 50 et 70% de ceux-ci, soit environ 4 millions km2 (Lappalainen 1996; Joosten & Clarke 2002; Chapman et al. 2003). Les estimations varient selon les auteurs car la définition d’une tourbière diffère d’un pays à l’autre. Par exemple, en Allemagne, un milieu doit avoir un dépôt de tourbe de 30 cm et plus pour être considéré comme une tourbière (Tarnocai 1980), alors que cette limite est de 45 cm en Irlande (Paavilainen & Päivänen 1995). Au Canada, une profondeur de tourbe de 30 à 40 cm est nécessaire selon
les régions (Poulin et al. 2004). Des estimations récentes évaluent la superficie des tourbières du Canada à 170 millions d’hectares, couvrant ainsi 17% du territoire (Gorham 1990). Au Québec, des travaux récents indiquent que les tourbières couvrent 16.1 millions d’hectares, soit 12.3% du territoire émergé (L. Rochefort, comm. pers.).
Il existe deux principaux types de tourbières, soit les tourbières ombrotrophes, aussi appelées bogs, et les tourbières minérotrophes, aussi appelées fens. Les tourbières ombrotrophes sont caractérisées par un apport en eau et en nutriments provenant quasi-exclusivement des précipitations. Les tourbières minérotrophes, quant à elles, bénéficient d’un apport en eau et en nutriments qui provient des eaux souterraines, du ruissellement et des précipitations; elles sont donc des milieux plus riches que les tourbières ombrotrophes (Warner & Rubec 1997; Rydin & Jeglum 2006; Wieder & Vitt 2006).
Les tourbières fournissent de nombreux biens et services écologiques, tant à des fins économiques qu’environnementales. Par exemple, elles constituent un bassin de diversité biologique et d’habitats pour de nombreuses espèces, stockent de grandes quantités de carbone, peuvent à certaines périodes de l’année régulariser les crues, elles ont un pouvoir de filtration, constituent une réserve d’eau douce, stockent dans leurs dépôts des archives permettant de reconstituer l’évolution de la végétation et du climat et sont des milieux prisés pour la récolte de petits fruits tels la chicouté et le bleuet (Moore & Bellamy 1974; Nord-Varhaug 1996; Rochefort 2001).
Bien qu’environ 90% des tourbières du Canada soient toujours à l’état naturel (Poulin et al. 2004), la situation est bien différente dans les zones habitées. Ainsi, plus de 80% des tourbières situées dans les basses terres du Saint-Laurent auraient été perturbées depuis
l’arrivée des premiers colons (Poulin & Pellerin 2001). Les tourbières sont en effet une ressource prisée par l’industrie, notamment pour l’extraction de la tourbe à des fins de production de terreaux horticoles, la foresterie ou l’exploitation agricole (Caron 2001; Parent 2001; Prévost et al. 2001). De plus, l’expansion urbaine et la construction de barrages hydroélectriques sont des menaces importantes pour les tourbières dans la province (Poulin et al. 2004).
Les effets des perturbations anthropiques sur la flore des écosystèmes tourbeux sont nombreux et essentiellement associés aux changements hydrologiques. Par exemple, le drainage des tourbières diminue la hauteur de la nappe phréatique et le contenu en eau de la tourbe, favorisant ainsi les espèces forestières au détriment des bryophytes tourbicoles comme les sphaignes (Laine et al. 1995). D’autres part, des études récentes ont montré que la flore, la faune et la dynamique des tourbières non perturbées de façon directe peuvent être influencées par les activités anthropiques environnantes (Lachance & Lavoie 2004; Deans et al. 2005; Waldron et al. 2009; Tousignant et al. 2010). Par exemple, certaines tourbières situées à proximité de terres agricoles renferment davantage d’espèces herbacées que l’on ne trouve habituellement pas dans les tourbières (Lachance & Lavoie 2004). La fragmentation des tourbières par la modification du milieu environnant peut aussi entraîner une modification de la composition en espèces dans les tourbières résiduelles, notamment en favorisant les espèces exotiques et/ou envahissantes et les espèces arborescentes au détriment des espèces typiquement tourbicoles comme les sphaignes et les éricacées (Poulin et al. 1999; Pellerin & Lavoie 2000; Lachance & Lavoie 2004).
Les plantes indicatrices
Certaines espèces de plantes ont des préférences autoécologiques bien définies, avec des seuils de tolérance souvent limités, de telle sorte qu’elles constituent des plantes indicatrices de l’intégrité écologique ou de la qualité de leur habitat en termes de lumière, pH, humidité du sol, salinité, perturbations, richesse en nutriments, etc. (Kollmann & Fischer 2003). Par exemple, en Grande-Bretagne, des espèces comme Vaccinium oxycoccos et Viola palustris sont considérées comme des plantes indicatrices d’un site humide, souvent saturé en eau et mal aéré, alors que Rubus chamaemorus est, pour sa part, indicateur d’un site très acide (Hill et al. 1999). Au Québec, une étude récente a montré l’utilité de Platanthera blephariglottis var. belphariglottis comme espèce indicatrice de l’intégrité des tourbières ombrotrophes (Laroche et al. sous presse). Des groupes de plantes peuvent également être considérés comme des indicateurs des conditions du milieu (Pauli et al. 2002; Piernik 2003; Miller et al. 2006; DeKeyser et al. 2009). À ce titre, Keddy et al. (1993) ont suggéré l’utilisation de groupes fonctionnels (guildes), dont les plantes rares, afin de caractériser les conditions des milieux humides. Les auteurs conviennent que les plantes faisant partie d’un même groupe fonctionnel partagent des traits communs et que cela leur permet d’exercer une fonction similaire dans un écosystème. Par exemple, les plantes rares sont souvent indicatrices d’un écosystème intègre puisqu’elles sont sensibles aux impacts des humains sur leur habitat. Pour leur part, Lopez et al. (2002) ont étudié huit guildes (arbres, arbustes, herbacées, etc.) et 13 traits fonctionnels (indigénat, vecteurs de dispersion, etc.) de plantes de milieux humides et leur relation avec les caractéristiques du paysage. Leur étude a permis de montrer, entre autres, que la présence d’arbustes
obligatoires de milieux humides est négativement corrélée à un paysage adjacent fortement urbain, tandis que la présence de plantes herbacées indigènes de l’Amérique du Nord est positivement corrélée à un paysage adjacent forestier, mais négativement corrélé à un paysage adjacent agricole.
Les communautés végétales peuvent aussi servir d’indicateurs de l’état d’un écosystème. Ainsi, à la fin des années 1970, Swink et Wilhelm ont publié une méthode d’évaluation des milieux naturels par la composition floristique, qui a évolué vers l’indice de qualité floristique (Floristic Quality Assessment Index, FQAI) (Swink & Wilhelm 1979; Wilhelm & Ladd 1988; Swink & Wilhelm 1994). Cette méthode se base sur les caractéristiques fondamentales de la flore d’une région, où les espèces réagissent différemment aux perturbations et montrent des préférences à des types d’habitats spécifiques. Le FQAI se calcule à partir des coefficients de conservatisme (CC) des espèces qui composent un milieu et de la richesse spécifique de celui-ci. Les CCs varient de 0 à 10, où un CC faible indique que l’espèce tolère une grande variété d’habitats incluant les sites perturbés, alors que la cote 10 indique que l’espèce ne tolère pas les changements de son habitat. Plusieurs auteurs ont utilisé cette méthode par la suite en Ohio (Andreas & Lichvar 1995; Lopez & Fennessy 2002), en Illinois (Wilhelm & Masters 1995; Matthews et al. 2009), en Ontario (Oldham et al. 1995), en Pennsylvanie (Miller & Wardrop 2006; Hychka et al. 2007; Wardrop et al. 2007), au Mississippi (Herman 2005), au Wisconsin (Bernthal 2003), en Floride (Cohen et al. 2004), ailleurs aux États-Unis (Ervin et al. 2006; LaPaix et al. 2009) et en Chine (Tu et al. 2009). Lopez et Fennessy (2002) ont testé le FQAI en tant qu’indicateur des conditions d’un milieu humide. Ils ont montré que cet indice est plus
faible, et donc indicateur de sites perturbés, dans les milieux humides où la couverture du territoire adjacent est fortement agricole ou urbaine, où la zone tampon à la périphérie du milieu humide est peu végétalisée, où des modifications hydrologiques sont survenues et où la distance du plus proche milieu humide est grande.
L’aréthuse bulbeuse
L’aréthuse bulbeuse est une espèce de la famille des orchidacées (Orchidaceae). Il s’agit de la seule représentante du genre Arethusa. Elle n’est présente qu’en Amérique du Nord, où son aire de répartition (fig. 1) s’étend au sud du 52e parallèle, de la Saskatchewan à Terre-Neuve, et se poursuit vers le sud jusqu’en Caroline du Sud (Romero-Gonzalez et al. 2002; USDA & NRCS 2011).
La description suivante est tirée de Thien & Marcks (1972), Marie-Victorin (1995) et Flora of North America (Romero-Gonzalez et al. 2002). L’aréthuse bulbeuse est une petite orchidée atteignant de 6 à 40 cm de hauteur. Elle porte généralement une seule fleur (rarement deux) de 2 à 5 cm de long de couleur rose magenta très voyante (Annexe I) et que le frère Marie-Victorin (1995) décrivait comme une fleur « au charme quasi-humain ». Son labelle, muni de crêtes frangées jaunes ou blanches, est surmonté de deux pétales courbés le recouvrant et de trois sépales se dressant à l’arrière. L’aréthuse est issue d’un corme bulbeux. Une seule feuille lancéolée apparaît après la floraison qui a lieu entre la fin mai et le début juillet, selon le climat et la latitude. La pollinisation de l’aréthuse est assurée par les reines abeilles du genre Bombus, communément appelées bourdon. En effet, une distance de 0.5 cm sépare le labelle des anthères et l’insecte doit être de taille suffisante pour détacher le pollen en quittant la fleur et ainsi le propager vers d’autres fleurs. L’aréthuse aurait la capacité de se reproduire végétativement grâce à des bourgeons portés sur le bulbe (Thien & Marcks 1972; NatureServe 2011), bien que sa propagation soit principalement assurée par la dispersion de ses graines (Luer 1975; Case 1987). Comme la plupart des orchidées, l’aréthuse bulbeuse s’associerait à un champignon mycorhizien qui lui permettrait non seulement de lui fournir les éléments nutritifs nécessaires, mais également d’assurer la germination de la graine (Rasmussen & Rasmussen 2009).
Comme c’est le cas pour plusieurs orchidées, l’aréthuse peut entrer en dormance (Luer 1975). Tamm (1948, 1972) a été le premier à observer ce comportement sur des populations d’orchidées qu’il a suivies durant plusieurs décennies. De même, Light et MacConaill (2006) ont étudié le phénomène chez Epipactis helleborine. Ils ont alors statué
qu’une plante est en dormance lorsqu’elle est absente à la surface du sol pendant une ou plusieurs saisons de croissance et qu’elle réapparaît par la suite. Les conditions édaphiques et physiographiques peuvent jouer un rôle dans le phénomène de dormance chez les orchidées, mais des séries d’événements météorologiques extrêmes et inhabituels (froid, chaleur, sécheresse ou inondation) pourraient être encore plus importants pour régir les processus de dormance. Plus particulièrement, la sécheresse peut avoir des effets prononcés sur la survie et la distribution des orchidées. Case (1987) soupçonne que les gels tardifs sur des années successives empêcheraient la production de graines lors de ces années et aurait un impact sur l’abondance lors des années subséquentes. Ce phénomène peut laisser croire à de fortes fluctuations des effectifs d’une population et c’est pourquoi l’observation de celle-ci sur plus d’une saison de croissance est nécessaire pour estimer l’abondance des individus. En raison de cette caractéristique, ce mémoire utilisera seulement des données de présence-absence et n’inclura pas de valeurs d’abondance, bien que celles-ci aient été récoltées et qu’elles soient présentées en annexe III.
Selon plusieurs auteurs, l’aréthuse bulbeuse croît typiquement dans les tourbières ombrotrophes (Thien & Marcks 1972; Correll 1978; Boland & Scott 1992; Smith 1993; Murdock 1994; CDPNQ 2008), mais certains auteurs mentionnent qu’elle est souvent associée à des conditions minérotrophes (Newmaster et al. 1997; NatureServe 2011). Elle pousse le plus souvent sur un épais tapis de sphaignes, accompagnée d’éricacées et de conifères, de même que sur les tapis flottants en bordure des lacs des tourbières ombrotrophes, dans les cariçaies tourbeuses acides ou dans les fondrières marécageuses (Correll 1978; Smith 1993; Lamont & Young 2004). On trouve aussi souvent l’aréthuse en
compagnie d’autres orchidées telles Calopogon tuberosus, Pogonia ophioglossoides et Platanthera blephariglottis var. blephariglottis (Thien & Marcks 1972; Boland & Scott 1992; Dignard et al. 2008). L’aréthuse bulbeuse est une espèce de pleine lumière et elle est considérée comme étant peu tolérante aux changements édaphiques de son habitat, notamment à l’assèchement du sol (Petitclerc et al. 2007). Elle croît généralement en petites colonies isolées et tend à disparaître lorsque son milieu est envahi par la végétation ligneuse (Petitclerc et al. 2007; NatureServe 2011).
Statut de précarité de l’aréthuse bulbeuse
L’aréthuse bulbeuse est considérée globalement hors de danger, mais la taille de ses populations serait en déclin sur l’ensemble de son aire de répartition (NatureServe 2011). Au Québec, un déclin de 10 à 30% est observé dans les régions du sud de la province, de même que dans la région du Bas-Saint-Laurent (CDPNQ 2007). Bien que ses populations soient parfois fréquentes et de grande taille dans certaines sections de son aire de répartition, comme dans la région des Grands-Lacs (NatureServe 2011), elles sont le plus souvent de petites tailles et se répartissent sporadiquement sur le territoire (Smith 1993). Dans plusieurs provinces et états où on la trouve, l’aréthuse est présumée disparue, possiblement disparue, vulnérable, en danger ou en situation critique. Par contre, l’espèce est apparemment en sécurité au Minnesota, en Ontario, au Nouveau-Brunswick, en Nouvelle-Écosse et à Terre-Neuve (USDA & NRCS 2011). Au Québec, l’aréthuse est susceptible d’être désignée menacée ou vulnérable en raison de sa rareté, mais surtout des menaces qui pèsent sur son habitat (MDDEP 2008; Comité Flore québécoise de
FloraQuebeca 2009). De ce fait, l’aréthuse, sans jouir d’une protection légale, bénéficie néanmoins d’un statut lui conférant une attention particulière. Bien que des milliers de tourbières, ombrotrophes pour la plupart, se trouvent dans cette section de l’aire de répartition de l’espèce (Buteau 1989; Romero-Gonzalez et al. 2002), seulement 66 occurrences de l’aréthuse sont répertoriées au Québec. De celles-ci, deux sont identifiées comme disparues et 22 comme des populations historiques, c’est-à-dire non observées depuis les 20 dernières années (MDDEP 2008). Toutes les occurrences du Québec sont situées dans la partie méridionale de la province, au sud du 51e parallèle (fig. 2).
Les principaux facteurs limitants et menaces affectant l’espèce seraient la perte d’habitats, l’altération des régimes hydrologiques de son habitat, la collecte d’individus, la fermeture du couvert végétal, l’invasion des milieux humides par des plantes exotiques envahissantes, le piétinement et les gels tardifs (Case 1987; MDDEP 2008; NatureServe 2011).
Objectifs
L’objectif général de mon mémoire est d’évaluer si la présence de l’aréthuse est indicatrice de l’intégrité écologique des tourbières. Pour atteindre cet objectif, trois objectifs spécifiques ont été élaborés, soit :
1) déterminer les facteurs favorisant la présence de l’aréthuse au sein d’une même tourbière;
2) identifier les facteurs associés à l’absence de l’aréthuse de tourbières abritant historiquement l’espèce;
3) identifier les facteurs associés à l’absence de l’aréthuse de tourbières présentant a priori des conditions adéquates à sa présence au sein de son aire de répartition.
Organisation du mémoire
Le présent chapitre constitue le premier chapitre du mémoire de maîtrise et consiste en une introduction générale des concepts utilisés pour ce travail de recherche. Le second chapitre forme le corps de l’ouvrage et est présenté sous forme d’article scientifique. Il fait état des facteurs associés à la présence de l’aréthuse bulbeuse dans nos tourbières. Le troisième et dernier chapitre présente une discussion et une conclusion générale des résultats de la recherche. Des annexes ont été ajoutées à la toute fin afin de couvrir les éléments non présentés dans l’article scientifique, de fournir la liste des espèces citées et d’intégrer les données brutes ayant servi aux analyses statistiques.
Le deuxième chapitre sera soumis pour publication à Botany sous Moisan, C. et Pellerin, S. en tant que co-auteures. Chantale Moisan est l’auteure principale et a réalisé tout le travail d’échantillonnage, l’analyse des résultats et la rédaction de l’article scientifique. Stéphanie Pellerin a élaboré la problématique, supervisé les travaux et corrigé et commenté le manuscrit.
Chapitre 2 : Factors associated to the presence of a rare
orchid in Quebec : Arethusa bulbosa L.
Abstract
Arethusa bulbosa L. is a rare peatland orchid species in Québec mainly because of the small size of its populations and the pressures on its habitat. Habitat destruction and alteration of its hydrologic regime are likely the main threats to the species. The aim of this study was to determine if A. bulbosa is a good indicator species of the ecological integrity of peatlands by determining the factors associated to 1) the presence of A. bulbosa in a specific area of a peatland, 2) the absence of A. bulbosa from historically known occurrences, and 3) the absence of A. bulbosa from a priori suitable peatlands (ombrotrophic) in its distribution area. In 2009 and 2010, 37 peatlands were surveyed in southern Québec. Discriminant analyses were performed to determine the factors that best explain the difference between plots supporting the species and plots where it is absent. Indicator species of the presence of A. bulbosa were found using INDVAL analyses. Overall, the results suggest that A. bulbosa was mostly growing in parts of peatlands characterized by minerotrophic conditions. Two evidences supported this point, the high pH values and the presence of species indicator of minerotrophy in plots supporting the orchid. Arethusa bulbosa would also be favored by some shading by scattered trees or species growing in lower strata, such as shrubs and herbs. Finally, despite a high floristic quality assessment index (FQAI) in A. bulbosa plots, it is likely that the species takes advantage of small-scale disturbances in its habitat, and is therefore not a good indicator of peatlands ecological integrity.
Key words: Arethusa bulbosa, Dragon’s-mouth, peatland, rare species, plant indicator
Introduction
Wetlands (swamps, marshes, shallow waters and peatlands) represent about 5% of the surface of the globe (Nord-Varhaug 1996), and 50 to 70% of these are made of peatlands, i.e. about 4 million km2 (Lappalainen 1996; Joosten & Clarke 2002; Chapman et al. 2003). Recent estimates evaluate the area of Canadian peatlands at 170 million hectares, covering 17% of the country (Gorham 1990). In Québec, peatlands cover 16.1 million hectares, i.e. 12.3% of emerged lands (L. Rochefort, pers. comm.). Peatlands offer a habitat to many rare species (Charman 2002). In Québec, about 40% of rare species are found in wetlands (Comité Flore québécoise de FloraQuebeca 2009). Because rare species often have a greater extinction risk than common species (Johnson 1998; Matthies et al. 2004) most conservation effort is focused on them (Flather & Sieg 2007). Understanding the factors that influence the populations of threatened species is the key toward a successful conservation and management planning (Foin et al. 1998; Heywood & Iriondo 2003). Arethusa bulbosa is a rare North American terrestrial orchid species mainly associated with Sphagnum bogs. In Québec, it is likely to be designated threatened or vulnerable because of its rarity, but also because of the threats upon its habitat.
Although about 90% of Canadian peatlands are still in a natural state (Poulin & Pellerin 2001; Poulin et al. 2004), the situation is very different in inhabited regions, where human activities have severely impacted them. For instance, it is realistic to estimate that about 80% of the peatlands in the lowlands of the St. Lawrence River have been disturbed since European settlement (Poulin et al. 2004). In Canada, peatlands are mainly disturbed by peat mining, forestry or agriculture (Caron 2001; Parent 2001; Prévost et al. 2001).
Urban sprawl and hydroelectric dam construction are other important threats to peatlands (Poulin et al. 2004). Disturbances directly within a peatland can severely impact its flora and fauna, but recent studies have shown that human activities in the surrounding area of a peatland can also have important impacts (Dubé et al. 1995; Lachance & Lavoie 2004; Tousignant et al. 2010). For instance, Lachance & Lavoie (2004) found that some herbaceous species not usually found in peatlands were more frequent in peatlands close to agricultural sites. Peatland fragmentation can also change the species composition through the invasion of exotic species and trees (Pellerin & Lavoie 2000; Lachance & Lavoie 2004).
Destruction and alteration of the hydrologic regime of Arethusa bulbosa habitat are likely the main threats to the species, although over-collecting, trampling and over-shading by woody species may be problematic in some regions (MDDEP 2008; NatureServe 2011). Yet, only a few studies concerned Arethusa bulbosa over the last decades (Thien & Marcks 1972; Boland & Scott 1992; Lamont & Young 2004), and none of them studied the overall neighboring habitat of the species, including companion species and disturbances. The main objective of this study was to determine if Arethusa bulbosa is a good indicator species of the ecological integrity of peatlands by understanding factors related to its presence in peatlands of Québec. The specific objectives were to identify natural and anthropogenic factors: 1) related to the presence of A. bulbosa within a peatland; 2) associated to the absence of A. bulbosa from a historically known population; and 3) related to the absence of A. bulbosa from a priori suitable peatlands (ombrotrophic) inside its distribution range.
Materials and Methods
Arethusa bulbosa
Arethusa bulbosa ranges from Newfoundland south to North Carolina and west to Indiana and Saskatchewan (Romero-Gonzalez et al. 2002). It is an obligate wetland plant typically growing in ombrotrophic peatlands (Thien & Marcks 1972; Correll 1978; Smith 1993; Murdock 1994; Boland 1996; CDPNQ 2008), although some mentions state that minerotrophic conditions might serve the species better (Newmaster et al. 1997; NatureServe 2011). Populations of A. bulbosa are small and sporadically distributed over its range, except in the Great Lakes region (Smith 1993). It is a small (6 to 40 cm) but showy orchid wearing a single (rarely two or more) rose-magenta flower (appendix I). A single lanceolate leaf grows at the base of the stem following blooming. The plant arises from a bulb-like tuber between early June and late July (in the northern parts of its range), and flowers for about one month. Bumblebees ensure its pollination. Arethusa bulbosa propagation relies mainly on seeds dispersal (Luer 1975), but the species may also reproduce vegetatively from the tuber (Thien & Marcks 1972). Like most of the orchids, it is associated to a mycorrhiza which supplies essential nutriments and ensures the seed germination (Rasmussen & Rasmussen 2009). Finally, Arethusa bulbosa is known to be a colonizer plant species growing under full light and tends to disappear when shrubs invade its habitat (Gilbert 1997; Petitclerc et al. 2007; NatureServe 2011).
Study area and sites
The study area is located in southern Québec (Canada) and covers the whole distribution area of A. bulbosa south of the 49th parallel. From north to south, the mean annual temperature of the study area ranges from 0.9°C to 5.9°C, and average precipitations from 871 to 1297 mm (Environment Canada 2011). Peatlands are scattered throughout the study area, and most have been intensively disturbed since European settlement through drainage, agriculture and forestry activities, peat mining and urban sprawl (Poulin et al. 2004). When observing the landscape surrounding occurrences of A. bulbosa on orthophotos, we can estimate that these pressures may affect up to one third of A. bulbosa populations.
In the study area, 51 occurrences of A. bulbosa are known. The last observation of theses occurrences dated from 1881 to 2006. The levels of population quality of these occurrences before our visit were: one excellent (> 1000 plants), six good (100–1000 plants), six moderately good (25–100 plants), 13 low (1–25 plants), 17 historic (not seen in more than 20 years), two extirpated and six unknown (CDPNQ 2008). In June and July 2009 and 2010, we surveyed 37 populations, 25 in 2009 (all revisited in 2010) and 12 in 2010 only. An additional six sites were visited but not surveyed because no peatland or other wetland could be found at the location of the occurrence. The eight other occurrences were either inaccessible or destroyed by human activity. Arethusa bulbosa was found in 24 of the 37 sampled peatlands, from which four were historic occurrences. A voucher was collected in 2009 and deposited at the Marie-Victorin Herbarium (MT).
Field sampling and data collection
We used the geographic coordinates of A. bulbosa occurrences provided by the Centre de données sur le patrimoine naturel du Québec (CDPNQ) to locate the orchid populations (appendix II). In the 24 peatlands where A. bulbosa was observed, two sampling plots (5 x 5 m) were established. The first plot (AB) was set up in the sector supporting the higher density of the orchid, while the second plot (EXT) was located 100 m away from the population limits in a random direction. When the random direction led to a habitat other than peatland (lake, forest, prairie, etc.), the opposite direction was used. In the 13 peatlands where no orchid was found, only one plot (HIS) was established at the location of the known historic occurrence (do not confuse with “historic” as classified by the CDPNQ).
Vegetation sampling
We used a point-intercept sampling method to estimate the relative cover of each plant species within each plot. Six equidistant transects (at 1 m intervals) were drawn within the 5 x 5 m plot. Along each of these transects, we recorded all species touching the projection of a vertical rod placed at six equidistant positions (N = 36 positions). In each plot, we also visually estimated to the nearest 1% the cover of non-vascular, herb and forb, sedge and shrub strata. We also measured the average height of shrubs in the plot and the diameter at breast height (dbh) of all trees (dbh ≥ 2.5 cm), and calculated the total tree basal area (Tba). The Tba was later used as an indicator of tree cover extent. Finally, for AB plots, the total number of A. bulbosa stems was counted (both years for sites visited twice),
as well as in a 20 m radius around the center of the plot (2010 only). Nomenclature follows the Integrated Taxonomic Information System (ITIS 2011).
Abiotic variables
The surface microtopography of each plot was assessed using four classes of hummock average height: 1: 0 cm, 2: 0-20 cm, 3: 21-40 cm and 4: 41-60 cm. The water table level was measured from an excavated well after the water level had stabilized (about 15 minutes), as the distance between the water and the photosynthetic parts of plants. Water pH and electrical conductivity were then measured using an Orion 4-star pH/conductivity meter. Conductivity values were adjusted to 25°C and corrected for hydrogen ions (Sjörs 1950). The thickness of peat deposit was estimated with an Oakfield type swindler to a maximum thickness of 700 cm. The percent transmittance of photosynthetically active radiation in plots was measured using a Li-191SA probe and a Li-Cor Li-1400 data logger. To determine relative light availability, two measures were taken almost simultaneously to guaranty identical sky conditions: an in situ measure directly on the substrate at the center of the plot, and a reference measure at men’s height in the closest large open area exempt from shade (< 50 m) (Paquette et al. 2007). Light measurements were done in 2010 only (all sites surveyed in 2009 were revisited).
Anthropogenic disturbances
Anthropogenic variables were extracted using ArcGIS 9.3 (ESRI, Redlands, CA) and 2001 orthophotos. The percentage of disturbed areas (cultivated, logged, mined or urbanized areas, roads, etc.) and the drainage ditch density (m/ha) were estimated within
buffer zones of 50 m and 500 m around the center of each plot. We also measured the distance between the center of each plot and the nearest drainage ditch and edge. The term ‘edge’ refers to the linear transition between the peatland and any other type of natural habitats (deciduous or coniferous forests), cultivated fields, or linear infrastructures (road, railroad, power line right-of-way). We measured the perimeter length and the area of each peatland and calculated the perimeter-area ratio as an indicator of edge influence. Finally, we calculated the Floristic Quality Assessment Index (FQAI) for each plot. This index is a measure of the ecological integrity of a habitat that uses the species coefficients of conservatism (CC) of the regional flora (Swink & Wilhelm 1979). CC scores range from 0 (tolerant, invasive or exotic species) to 10 (intolerant or rare species). A high score also indicates that the species has specific habitat requirements, and a low score that the species can tolerate a wide range of environmental conditions, including disturbed sites (Oldham et al. 1995; Herman et al. 2001; Andreas et al. 2004; Cohen et al. 2004). The presence of many conservative species (high CC score) thus reflects relatively unaltered conditions. The FQAI is the product of the average CC multiplied by the square root of native species richness (N) of a specific inventory site (FQAI = mean CC x √N) (Andreas & Lichvar 1995; Wilhelm & Masters 1995). Plant CCs are region specific. We used CC values from Québec, which had been adapted from values of southern Ontario (Oldham et al. 1995) and Ohio (Andreas et al. 2004) with the help of expert botanists and bryologists from Québec (Laroche et al. in press). Missing CCs were determined by analyzing the species regional habitat preferences as well as its behavior toward disturbances (Marie-Victorin 1995; Garneau 2001; Gauthier 2001).
Data analyses
To determine which factors best explain the distribution patterns of A. bulbosa within peatlands, and thus characterize its habitat preferences (McGarigal et al. 2000), we performed a linear discriminant analysis (LDA) using abiotic, anthropogenic, and vegetation strata variables (hereafter referred to as environmental variables) sampled in AB and EXT sites with the presence and absence of A. bulbosa as a priori groups. We did not used the density of drainage ditches, the percentage of disturbed area in a radius of 500 m, or the perimeter/area ratio variables in this analysis because they were nearly identical for AB and EXT plots, given that they are located only 100 m apart. Variables with a skewed distribution (according to a Shapiro-Wilk test of normality) were transformed using the Box-Cox method (table I), and all variables were standardized to unit variance (Legendre & Legendre 1998). Multivariate homogeneity of group dispersions (variances) were verified using Marti Anderson’s procedure (Anderson 2006). Two supplemental LDAs were performed to assess the influence of companion species on the presence of A. bulbosa. For these analyses, two vegetation matrices were created using the relative cover of 1) vascular and 2) non-vascular species (hereafter referred as to vegetation variables). Infrequent species were removed from the matrices before analysis, and a Hellinger’s transformation was applied to account for the presence of double zeros (Legendre & Gallagher 2001). The scoring coefficients of the first LDA canonical function were used to determine the contribution of each variable (Legendre & Legendre 1998). We used the indicator value index (INDVAL) to identify indicator species of the presence of A. bulbosa (Dufrêne & Legendre 1997). The INDVAL method assesses the degree of specificity (uniqueness to a
particular group) and fidelity (frequency of occurrence within a particular group) of species in groups defined a priori, here by the presence or absence of A. bulbosa (Legendre & Legendre 1998). Finally, a one-way ANOVA was performed to find out whether total species richness of plants differed between plot types.
Similar analyses were used to determine which factors are related to the absence of A. bulbosa from historically known occurrences by comparing data sampled in AB and HIS plots. All environmental and vegetation variables were used. To understand the sporadic distribution of A. bulbosa and its absence from peatlands within its range, we used data from a previous study aiming at determining the factors explaining the presence of another peatland orchid, Platanthera blephariglottis var. blephariglottis (Laroche et al. in press). Twenty-two plots (hereafter named OUT) were randomly chosen from the 113 sampled plots, none of them containing A. bulbosa. The only constraint was that the 22 plots selected had to cover most of our study area. The same methodology for vegetation, abiotic and anthropogenic variables sampling (see above) had been used in the Laroche study, except that no light measurement was done. We then compared AB and OUT plots using LDAs, INDVAL and ANOVA analyses as explained above. Marti Anderson’s test, transformations and INDVAL analyses were performed in the R environment (R Development Core Team 2010), while LDAs and ANOVAs were performed with the JMP software (SAS Institute Inc. 2010).
Table I. Environmental variables used in linear discriminant analyses (LDA)
Variable Abbreviation Transformation
AB vs EXT AB vs HIS AB vs OUT
Water table pH pH none none none
Water table electrical
conductivity (μs/cm) K25 Box-Cox γ = 0.21962 Box-Cox γ = 0.19632 Box-Cox γ = 0.26763 Peat deposit thickness (cm) Peat Box-Cox
γ = 0.03490
Box-Cox γ = -0.23314
Box-Cox γ = -0.08205
Water table depth (cm) Wt Box-Cox
γ = 0.23461 Box-Cox γ = 0.26296 none Transmittance of photosynthetically active radiation (%)
Light none none -
Total tree basal area (m2/ha) Tba none none Box-Cox γ = -1.92122 Average height of shrubs (cm) Hshrub Box-Cox
γ = 0.30614
Box-Cox γ = 0.21004
Box-Cox γ = 0.04642
Non-vascular cover (%) Nvas none none none
Sedge cover (%) Sedge none Box-Cox
γ = -4.99994 none
Herb and forb cover (%) Herb none none none
Shrub cover (%) Shrub Box-Cox
γ = 0.59694 none none
Hummocks average height (cm) Hum none none none
Floristic Quality Assessment
Index FQAI none none none
Drainage ditch density in a 50 m
radius (m/ha) D50 none none none
Drainage ditch density in a
500 m radius (m/ha) D500 -
Box-Cox
γ = 0.21193 none Distance to the closest drainage
ditch (m) Dditch none
Box-Cox γ = 0.49576
Box-Cox γ = 0.37864 Disturbed areas in a 50 m radius
(%) Dist50 none none none
Disturbed areas in a 500 m radius (%) Dist500 - Box-Cox γ = 0.00644 Box-Cox γ = 0.13370 Distance to closest peatland
edge (m) Dedge Box-Cox γ = 0.05322 Box-Cox γ = 0.14581 Box-Cox γ = 0.07132 Perimeter/area ratio of the
peatland P/A -
Box-Cox γ = -0.10825
Box-Cox γ = -0.28213
Results
Arethusa bulbosa abundance in 2009 ranged from 1 to 31 individuals per plot, and from 0 to 22 individuals (2009 plots plus seven new ones) in 2010. In the 20 m radius sampling stations surveyed in 2010, we found between 0 and 132 orchids. A total of 190 species (128 vascular and 62 non-vascular) were recorded in the 61 plots surveyed in 2009 and 2010 (AB, EXT and HIS). The inclusion of plots from Laroche et al. (in press) brings the total to 205 species, 135 vascular and 70 non-vascular. Plots supporting Arethusa bulbosa were characterized by significantly more species (22 ± 6 species) than HIS (16 ± 7 species; p = 0.0053) and OUT plots (17 ± 4 species; p = 0.0048). No significant difference existed between AB and EXT (19 ± 7 species, p = 0.0765) plots, but a decreasing gradient from AB to EXT plots exists (fig. 3).
0 5 10 15 20 25 30 35
AB EXT HIS OUT
M ean s peci es r ich ne ss Plot types A AB B B
Factors related to the presence of Arethusa bulbosa within a peatland
The LDA of environmental variables done with AB and EXT plots correctly separated the two groups with 73% accuracy (fig. 4A). According to scoring coefficients, the availability of light at ground level, the FQAI and the average height of shrubs were the main variables discriminating the two groups. Thus, plots with A. bulbosa were characterized by lower light availability at ground level (AB mean 46%; EXT mean 60%), higher level of integrity (high FQAI score) (AB mean 35; EXT mean 32) and lower shrubs (AB mean 55 cm; EXT mean 61 cm) than plots without the orchid in the same peatland. A water table near the surface and a thick peat deposit also characterized AB plots.
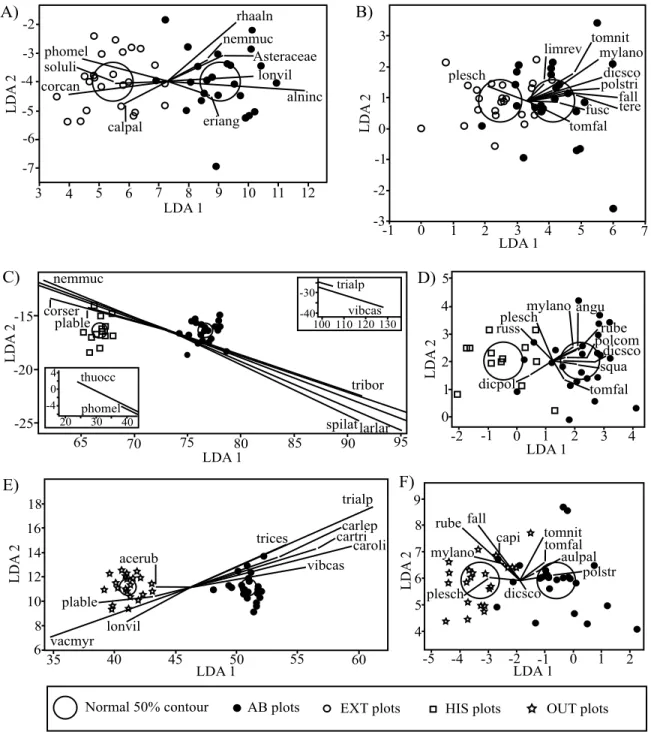
According to the INDVAL index, no species was indicator of either of the plot types (table II). However, according to the LDA, the composition of vascular species clearly discriminates between the AB and EXT groups (96% accuracy) (fig. 5A). Species highly associated with AB plots were, in order of importance, Lonicera villosa, species from the Asteraceae family, Alnus incana ssp. rugosa and Rhamnus alnifolia, while species mostly associated with EXT plots were Cornus canadensis, Solidago uliginosa and Calla palustris. The discrimination power of non-vascular species was lower with 75% of the plots correctly classified within the two groups (fig. 5B). Dicranum scoparium, Tomenthypnum nitens and Mylia anomala were mainly associated with AB plots while Pleurozium schreberi was associated to EXT plots.
LDA 1 LD A 2 -2 2 1 0 -1 -5 -4 -3 -2 -1 0 1 2 3 pH D500 Hum P/A Tba Hshrub K25 DedgeShrub Dditch FQAI Dist50 Herb Sedge Dist500 Nvas D50 Peat Light Wt FQAI Peat Nvas Light Hshrub Dedge Dist50 Herb pH Hum K25 Dditch Tba Shrub Wt D50 Sedge 2 1 0 -1 -2 -2 -1 0 1 2 3 LDA 1 LD A 2 A) B) Herb Dedge pH D50 Tba K25 Nvas D500 Peat Dist50 Hum Wt P/A Shrub FQAI Sedge HshrubDditch Dist500 2 1 0 -1 -2 -3 -4 -3 -2 -1 0 1 2 3 4 LDA 1 LD A 2 C) HIS plot AB plot EXT plot OUT plot Normal 50% contour
Fig. 4. Linear discriminant analyses on environmental variables. A) AB vs EXT plots; B) AB vs HIS plots; C) AB vs OUT plots. Abbreviations found in table I.
LDA 1 A) B) C) D) E) F) LD A 2 -2 -3 -4 -5 -6--7 3 4 5 6 7 8 9 10 11 12 LDA 1 rhaaln alninc eriang Asteraceae corcan calpal lonvil nemmuc soluli phomel LDA 1 -1 0 1 2 3 4 5 6 7 plesch tomnit limrev tomfal fusc terefall
polstridicsco mylano LD A 2 -3 -2 -1 0 1 2 3 trialp vibcas trices cartricarlep
caroli vacmyr lonvil plable acerub 35 40 45 50 55 60 6 8 10 12 14 16 18 LD A 2 tomfal tomnit polstr dicsco aulpal plesch rube fall mylano capi 9 8 7 6 5 4 -5 -4 -3 -2 -1 0 1 2 LDA 1 LD A 2 4 3 2 1 0 -2 -1 0 1 2 3 4 LDA 1 LD A 2 plesch squa mylano dicsco dicpol russ polcom tomfal rube angu 5 -15 -20 -25 tribor spilatlarlar corser plable nemmuc 70 80 90 LDA 1 LD A 2 85 95 75 65 4 0 -4 20 30 40 phomel thuocc -40 -30 100110120130 trialp vibcas
AB plots EXT plots HIS plots OUT plots Normal 50% contour
Fig. 5. Linear discriminant analyses on vegetation variables after Hellinger transformation. A) AB vs EXT plots, vascular species; B) AB vs EXT plots, non-vascular species; C) AB vs HIS plots, vascular species; D) AB vs HIS plots, non-vascular species; E) AB vs OUT plots, vascular species; F) AB vs OUT plots, non-vascular species. Abbreviations found in appendix V.
Table II. Indicator species of the presence of Arethusa bulbosa determined using the INDVAL method. No indicator species were found between AB and EXT plots.
Species Group INDVAL p-value
AB vs HIS
Myrica gale AB 0.457 0.018
Sphagnum warnstorfii AB 0.333 0.032
Sphagnum papillosum HIS 0.338 0.019
Plantanthera blephariglottis var. blephariglottis HIS 0.276 0.007
Sphagnum russowii HIS 0.231 0.029
AB vs OUT Larix laricina AB 0.529 0.037 Myrica gale AB 0.515 0.001 Alnus incana AB 0.427 0.003 Drosera rotundifolia AB 0.425 0.041 Thuja occidentalis AB 0.333 0.006 Sphagnum warnstorfii AB 0.333 0.008 Aulacomnium palustre AB 0.300 0.010 Carex lasiocarpa AB 0.292 0.008 Carex leptalea AB 0.250 0.034 Carex exilis AB 0.236 0.041
Eriophorum virginicum OUT 0.675 0.001
Sphagnum fallax OUT 0.578 0.004
Carex trisperma OUT 0.432 0.014
Factors related to the absence of Arethusa bulbosa from historical sites
The LDA of environmental variables done with AB and HIS plots correctly separated the two groups with 97% accuracy (fig. 4B). Plots with A. bulbosa were mainly characterized by higher pH (AB mean 5.5; HIS mean 4.5) and lower light availability at ground level than plots of historical populations (AB mean 46%; HIS mean 66%). The latter were also characterized by higher tree coverage (high Tba) (AB mean 0.31; HIS mean 0.27), taller shrubs (AB mean 55 cm; HIS mean 46 cm), a smaller proportion of disturbed areas within a 500 m radius (AB mean 14%; HIS mean 10%), and smaller sedge cover (AB mean 15%; HIS mean 9%) and integrity level (high FQAI) (AB mean 34.9; HIS mean 29.2) than sites still harboring A. bulbosa.
According to the INDVAL index (table 2), two species were indicator of AB plots: Myrica gale and Sphagnum warnstorfii; and three of HIS plots: Sphagnum papillosum, Platanthera blephariglottis var. blephariglottis and Sphagnum russowii. The vascular plant composition was clearly different between AB and HIS plots, since the correct classification rate of the LDA was 100% (fig. 5C). The main species associated with AB plots were, in order of importance, Viburnum nudum var. cassinoides, Trientalis borealis and Trichophorum alpinum, while Photinia melanocarpa, Thuja occidentalis and Cornus sericea were mainly associated with HIS plots. Other species strongly associated with AB plots were Spiraea alba var. latifolia, Larix laricina, Myrica gale and Gaultheria hispidula. Finally, Platanthera blephariglottis var. blephariglottis, Nemopanthus mucronatus and Andromeda polifolia var. glaucophylla were mostly associated with HIS plots. Non-vascular species also had a high ability to discriminate between AB and HIS plots, the LDA
giving an accurate group classification of 89% (fig. 5D). Species mostly associated with HIS plots were Dicranum polysetum and Sphagnum russowii, while those positively associated with AB plots were Sphagnum squarrosum, Mylia anomala, Dicranum scoparium and Polytrichum commune.
Factors related to the absence of Arethusa bulbosa from a priori suitable peatlands
The LDA of environmental variables between AB and OUT plots correctly separated the two groups with 98% accuracy (fig. 4C). The discriminatory power of the model was mostly associated with pH, which was higher in plots with the orchid (mean 5.5) than in those where the species never was present (mean 3.9). AB plots were also characterized by a greater density of drainage ditches inside a 500 m radius than were OUT plots (AB mean 54 m/ha; OUT mean 18 m/ha). The opposite occurred with ditch density in a radius of 50 m, the density of drainage ditches being lower in AB than OUT plots (AB mean 42 m/ha; OUT mean 16 m/ha). Finally, it is noteworthy that both AB and OUT plots had high FQAI, with means of 35 for AB plots and 33 for OUT plots.
According to the INDVAL index (table 2) ten species were indicator of AB plots: Larix laricina, Myrica gale, Alnus incana subsp. rugosa, Drosera rotundifolia, Thuja occidentalis, Sphagnum warnstorfii, Aulacomnium palustre, Carex lasiocarpa, C. leptalea and C. exilis. Four species were indicator of OUT plots: Eriophorum virginicum, Sphagnum fallax, Carex trisperma and Acer rubrum. The LDA between AB and OUT plots indicated that vascular plant communities were very different in these plots, with all sites correctly classified (100% accuracy) (fig. 5E). The main species strongly associated with AB plots
were, in order of importance: Trichophorum alpinum, Viburnum nudum var. cassinoides, Trichophorum cespitosum, Carex leptalea, C. trisperma, C. oligosperma, Eriophorum virginicum, Larix laricina, Kalmia angustifolia, C. lasiocarpa and C. exilis. Plants associated with OUT plots were Vaccinium myrtilloides, Lonicera villosa and Platanthera blephariglottis var. blephariglottis. For non-vascular plants, the LDA accurately classified 91.3% of the objects within the two groups (fig. 5F). Tomenthypnum nitens, Polytrichum strictum and Dicranum scoparium were strongly associated with AB plots while Pleurozium schreberi, Sphagnum rubellum and S. fallax were associated with OUT plots.
Discussion
This study improved our understanding of the factors that predispose the presence of Arethusa bulbosa in peatlands of Québec. Within a specific peatland, our results indicated that the species primarily settled areas offering some attenuation of light, where shrubs were small and the FQAI was high, indicating a high level of ecological integrity. The results did not show the presence of important vegetation in AB plots that could cause the attenuation of light, but scattered trees or shrubs outside the plots (not measured) are probably responsible for that. We also found that the absence or disappearance of the orchid from historic sites may be related to an acidification of the habitat, the presence of trees and the establishment of high shrubs. Finally, our results revealed that open ombrotrophic peatlands that we thought a priori suitable for the species were likely not adequate mainly due to the fact that A. bulbosa seemed to grow in less acidic sites.
Our study highlighted that Arethusa bulbosa was mostly growing in habitats characterized by minerotrophic conditions, contrary to the general perception that ombrotrophic peatland is its typical habitat (Thien & Marcks 1972; Correll 1978; Boland & Scott 1992; Smith 1993; Murdock 1994; CDPNQ 2008). Two lines of evidence supported this point, the pH values measured in AB plots and the indicator species associated with A. bulbosa. Firstly, in 20 out of 24 sites supporting A. bulbosa, the pH values measured were higher than 4.2 (mean 5.5, max 6.8), which are usually characteristic of minerotrophic conditions (Rydin & Jeglum 2006). However, since the electrical conductivities of the water table are relatively low in AB plots (mean 40.7 μs/cm), A. bulbosa probably settles poor fens or more minerotrophic sectors within ombrotrophic peatlands. Although a high
number of peatlands exist in the range of A. bulbosa, most of them are typical open ombrotrophic sites (Buteau 1989) and thus may not present optimal conditions for the species. Secondly, most of the indicator species of the presence of A. bulbosa, such as Myrica gale, Sphagnum warnstorfii, Carex lasiocarpa, C. leptalea and C. exilis, are indicators of minerotrophy (Sjörs 1963). This is also true for other species highly related with AB plots, such as Trichophorum alpinum, Rhamnus alnifolia, Eriophorum angustifolium, Menyanthes trifoliata and Campylium stellatum (Sjörs 1963; Campbell & Rochefort 2001; Garneau 2001). Species related to A. bulbosa differ between LDAs and INDVAL analyses because the first one shows how the species together explain the grouping of sites, while the second one calculates the indicator value for one species at a time and does not take the other species into account.
Light availability at ground level was also an important variable discriminating sites with A. bulbosa from those without it. However, contrary to what we expected, light available at ground level was lower in AB plots than in EXT and HIS plots. Little information exists concerning the light requirements of A. bulbosa, but it is generally considered an early successional species, growing in full light and intolerant to the invasion of high growing species (Case 1987; Gilbert 1997; Lamont & Young 2004). Yet, we never found the orchid growing under a closed canopy, but our results indicated that the species requires some light attenuation (mean light availability 46%), likely from scattered trees or species of the lower strata, such as shrubs and herbs. We frequently found A. bulbosa populations near the lagg, i.e. the transition zone between the forested edge and the open center of the peatland (pers. obs. 2009, 2010).
Finally, our results showed that plots containing A. bulbosa had higher FQAI than EXT and HIS plots, and as high as those of OUT plots. FQAI being an index of site integrity (Swink & Wilhelm 1979; Wilhelm & Ladd 1988; Swink & Wilhelm 1994), this result suggest that A. bulbosa is likely associated to more pristine sites. Plots where A. bulbosa was found had FQAI ranging from 26 to 48 (mean 35), which is similar to the least disturbed wetlands in the study of Miller and Wardrop (2006) and to the natural peatland studied by Andreas and Lichvar (1995). On the other hand, some disturbances were more associated with AB plots than with HIS plots in the 500 m radius, and there were more drainage ditches within 500 m of AB plots than OUT plots (fig. 4B and 4C). These results seemed antagonistic to a high FQAI. However, in all AB sites but one, where A. bulbosa was growing in an abandoned blockcut peat mining exploitation, these disturbances were minimal. They were either far from the plot (more than 50 m) or mostly consisted of bicycle paths, all-terrain vehicle (ATV) trails or nearby wooded sidewalks. In the old blockcut site, many drainage ditches were present but non effective and were full of water. In this site, most of the A. bulbosa individuals were found along the ditches, probably taking advantage of the humidity and nutriments transported by the water. Arethusa bulbosa being a colonizer plant species (Gilbert 1997), it could have benefited from the opening of the environment and the activation of the cycle of soil nutrients by alteration works, or from the elimination of competition in the case of the peat mined site. Moreover, drainage ditches located in the 500 m radius of OUT plots may be too far to have a marked impact, which decreases a lot beyond a distance of 15 m (Prévost et al. 1997). Finally, since FQAI is influenced by species richness (N) (FQAI = mean CC x √N;
Andreas & Lichvar 1995), the higher FQAI found in AB plots was likely also related to some extent to the fact that those sites had higher native species richness than EXT and HIS sites.
Arethusa bulbosa populations in Québec are small and scattered, which increases their probability of extinction because of a higher vulnerability to environmental changes and to genetic variation loss (Menges 1991; Matthies et al. 2004; Honnay & Jacquemyn 2007). Most of the peatlands in southern Québec are drained and isolated in an agricultural matrix, which has facilitated their invasion by trees or exotic species (Paavilainen & Päivänen 1995; Prévost et al. 1999; Lachance & Lavoie 2004; Pellerin et al. 2008). This process is known to be detrimental to A. bulbosa (Lamont & Young 2004). Habitat fragmentation and drainage should thus be avoided near populations of the orchid.
In conclusion, our study provides important knowledge on the factors favoring A. bulbosa, which could be used for management. We have shown that the habitat of Arethusa bulbosa is characterized by higher minerotrophic conditions than usually found in typical ombrotrophic peatlands. The optimal habitat for A. bulbosa also benefits from a certain level of light attenuation. Arethusa bulbosa grows in sites of great ecological integrity, as shown by the high FQAIs in AB plots, but it appears that some small-scale disturbances that bring slight modifications to the landscape may favor A. bulbosa, which therefore can not be considered as an indicator of peatlands ecological integrity.
Chapitre 3 : Conclusion générale
L’objectif principal de notre étude était de déterminer si l’aréthuse bulbeuse serait une espèce indicatrice de l’intégrité écologique des tourbières. Afin d’y arriver, les facteurs qui influencent la présence de l’aréthuse au sein d’une tourbière, sa disparition de sites historiques, ainsi que son absence de tourbières à l’intérieur de son aire de répartition ont été analysés. À l’intérieur d’une tourbière, les résultats montrent que l’aréthuse se situe dans les endroits où une végétation clairsemée offre une certaine interception de la lumière, où les arbustes sont bas et l’indice de qualité floristique (FQAI) est élevé, traduisant un milieu faiblement perturbé ou une communauté caractérisée par des espèces ayant un haut niveau de conservatisme. La disparition de l’aréthuse des sites historiques serait due à l’acidification de la tourbière, à la présence d’arbres et à l’établissement d’arbustes de grande taille. Finalement, il semblerait que les tourbières ombrotrophes ouvertes que nous croyions a priori favorables à l’aréthuse ne sont pas adéquates puisque l’espèce semble préférer les sites moins acides.
De façon générale, notre étude a permis de montrer que l’habitat de prédilection de l’aréthuse est caractérisé par des conditions de minérotrophie, ce qui va à l’encontre de l’idée généralement acceptée que l’aréthuse soit une plante typique des tourbières ombrotrophes (Thien & Marcks 1972; Correll 1978; Boland & Scott 1992; Smith 1993; Murdock 1994; CDPNQ 2008). Deux résultats supportent ce constat, soit des valeurs de pH plus élevées et la présence d’espèces de milieu minérotrophe dans les parcelles AB. Toutes les parcelles AB sauf quatre avaient un pH supérieur à 4.2, ce qui est caractéristique des tourbières minérotrophes (fens) (Rydin & Jeglum 2006). Cependant, comme les conductivités électriques de la nappe phréatique sont faibles dans les parcelles AB