«Investigation of the effects of ceramide-C16 and n-decane on the polymorphism
of phosphatidylethanolamine; a
2H and
31P solid-state NMR and differential
scanning calorimetry study»
Par
Mahmoudreza Doroudgar
Département de chimie, Université de Montréal Faculté des arts et des sciences
Mémoire présenté à la Faculté des études supérieures et postdoctorales en vue de l’obtention du grade de maître ès sciences (M.Sc.)
en chimie
Décembre, 2016
I
Les céramides, dont la structure comporte une chaîne hexadecanoyle (CerC16), une chaîne considérée comme de longueur moyenne, sont des sphingolipides impliqués dans de nombreuses pathologies telles que l’obésité, le diabète, la maladie de Parkinson ainsi que certains types de cancer. La première partie de mon projet de M.Sc. a consisté à utiliser la calorimétrie différentielle à balayage (DSC de l'anglais differential scanning calorimetry) et la spectroscopie RMN séquentielle à l'état solide du deutérium (2H) et du 31P afin d’étudier l'impact du CerC16 (<20 mol%) sur le polymorphisme de la 1-palmitoyl-2-oléoyl-sn-glycéro-3-phosphoéthanolamine (POPE). Les résultats montrent que le CerC16 a un impact majeur. Il élargit la transition de phase lamellaire gel-fluide (Lβ‒Lα) et la décale vers les hautes températures, ce qui entraîne la création de larges régions de coexistence Lβ/Lα dans le diagramme de phase du système. La présence du céramide entraîne également un élargissement de la transition de phase Lα‒hexagonale inverse (HII) ainsi qu’une diminution de la température qui lui est associée. Lorsque la proportion de CerC16 dans la membrane de POPE est supérieure à 12-13 mol%, les deux transitions se chevauchent, ce qui entraîne la coexistence des trois phases. Ce chevauchement conduit à une transition de phase directe Lβ‒HII. De manière générale, le céramide entraîne donc une multitude d’effets sur les propriétés de la membrane lipidique, de la variation de sa fluidité à la modulation de son rayon spontané de courbure.
Certains alcanes de longueurs variables ont le potentiel de favoriser la transition Lα-HII de différentes phosphatidyléthanolamines (PE). Dans la seconde partie de mon M.Sc., j'ai caractérisé les impacts du n-décane-d22 (10 mol%), un alcane à courte chaîne, sur le
II
précédemment. J’ai montré que, malgré une diminution significative de la température associée au début de transition Lα‒HII, la température de la fin de transition restait quant à elle sensiblement inchangée. Globalement, la transition est donc élargie. Nous proposons que les molécules de n-décane se localisent au niveau des bouts de chaînes acyles de la POPE en phase Lα, ce qui engendre des compressions et des contraintes. Il en résulte un décalage du début de transition Lα‒HII vers les basses températures. Lorsque la température augmente, de plus en plus de molécules de n-décane sont transférées vers la phase HII, ce qui réduit les contraintes sur les chaînes acyles de la phase Lα. Le décane comble les espaces entre les cylindres HII et favorise aussi de cette manière la phase non-lamellaire.
III
Ceramide C16 (CerC16), a mid-chain sphingolipid bearing a hexadecanoyl chain, is involved in several diseases such as diabetes, obesity, Parkinson, and certain type of cancers. In the first part of my M.Sc. project, I employed differential scanning calorimetry (DSC) and sequential 2H and 31P static solid-state NMR spectroscopy to study the role of CerC16 ( ≤ 20 mol%) in modifying the polymorphism of 1-palmitoyl-2-oleoyl-sn-glycero-3-phosphoethanolamine (POPE). The results demonstrate that CerC16 has major impacts. It broadens the gel‒fluid lamellar (Lβ‒Lα) phase transition and shifts it toward higher temperatures. This effect leads to the creation of a wide Lβ/Lα coexistence region in the phase diagram of the system. CerC16 also broadens the Lα‒inverted hexagonal (HII) phase transition and shifts it towards lower temperatures. When CerC16 proportion in POPE bilayers is ≥ 12-13 mol%, the two transitions overlap, leading to a three-phase coexistence line in the phase diagram. Such a phenomenon leads to a direct Lβ‒HII phase transition. Globally, CerC16 can have a wide range of effects on membrane properties, from varying its fluidity to modulating its curvature.
Alkanes of various chain lengths are able to promote the Lα‒HII transition of different phosphatidylethanolamines (PE). In the second part of my M.Sc. thesis, I investigated the impacts of 10 mol% n-decane-d22, a short alkane, on the polymorphism of POPE, using sequential 2H and 31P solid-state NMR spectroscopy. The results show that although, n-decane causes a significant downshift in the onset temperature of the Lα‒HII transition, it does not shift considerably the end of the transition. As a consequence, a very broad Lα‒HII transition is obtained. It is inferred that n-decane molecules are found within the lower part of the POPE acyl chains in the Lα phase. This
IV
lower temperatures. Upon increasing temperature, more and more n-decane molecules are transferred to the HII phase; the relocation not only decreases the chain packing stress in the Lα phase, but also allows the decane molecules to fill the interstitial void spaces between the HII cylinders.
V
1
Chapter 1: Introduction1.1 How do some lipid bilayers adopt non-bilayer morphologies?...…1
1.2 Brief introductory to the project……….8
1.2.1 Ceramide-C16 is a versatile modulator of phosphatidylethanolamine polymorphism………...………..……….8
1.2.2 Characterization of n-decane distribution within phosphatidylethanolamine Lα/HII phases……….……..9
1.3 Techniques………...………...……...……..………..9
1.3.1 Differential scanning calorimetry (DSC)………..….9
1.3.2 Solid state nucleic magnetic resonance (NMR)………...……...…...…11
1.3.2.1 Chemical shift anisotropy (CSA)………..……....…12
1.3.2.2 Quadrupolar splitting………...……...………...16
1.4 References………...………...…...………….……...………...………...…...21
2
Chapter 2: Ceramide-C16 is a versatile modulator of phosphatidylethanolamine polymorphism 2.1 Abstract…….………...…....………...………...………...232.2 Introduction………...………24
2.3 Materials and Methods...…...………...…...27
2.3.1 Materials………...………...………...27
VI
2.3.4 NMR Spectroscopy………...………..…...………...29
2.4 Results and Discussions………...………...……….30
2.4.1 DSC Measurements………...………..…...……….30
2.4.2 NMR Spectroscopy………...……...…...…..32
2.5 Conclusions………....………44
2.6 References………….………...………...……….46
3
Chapter 3: Characterization of n-decane distribution within phosphatidylethanolamine membrane in Lα/HII phases 3.1 Introduction………513.2 Materials and Methods………..52
3.2.1 Materials……….52
3.2.2 Lipid Mixture Dispersions………53
3.2.3 NMR Spectroscopy………...………...………..53
3.3 Results and Discussions………...………..…………..53
3.4 Conclusions………...……….………62 3.5 References………...………...………..63
4
Conclusions 4.1 References………..………...675
Annexes 5.1 Reference……….70VII
Table 2.1 The Lβ−Lα, and L−HII phase transition temperatures and molar enthalpy of a pure POPE dispersion and POPE/CerC16 dispersions of various molar fractions………...…31
VIII
Fig. 1.1 A schematic of the eukaryotic plasma membrane.………...…....….2
Fig. 1.2 Schematics of gel, liquid crystalline, and inverted hexagonal phases……….……….4
Fig. 1.3 A schematic of the pressure profile (𝜋) due to the lateral forces applied across the
different parts of a relax bilayer at equilibrium………..5 Fig. 1.4 Structures and melting point (Tm) of POPC, POPE, 16:0 LPC, and CerC16………..………7 Fig. 1.5 The concentration normalized heat capacity thermogram of a pure POPE
dispersion………...………..10 Fig. 1.6 A schematic representation of the effects of the ellipsoidal electron cloud orientation
on the CSA principal values of a single nucleus of 𝐼 = 1 2⁄ . The effect of random orientation of nuclei on the powder pattern line shape of a crystal.…...…...…...13 Fig. 1.7 31P-NMR spectra of the lamellar, and inverted hexagonal phases of a POPE dispersion at different temperatures………...………..………15 Fig. 1.8 A Schematic representation of the disturbance effect of the first-order quadrupolar
coupling on two equal Zeeman transitions of a 𝐼 = 1 nuclei of a single crystal. The quadrupolar coupling powder pattern of 2H when the asymmetry parameter, 𝜂, is zero……….17 Fig. 1.9 A Schematic representation of the effect of different 2H position along a lipid acyl chain on variation of the quadrupolar coupling powder pattern of the corresponding 2H nuclei……….18 Fig. 1.10 2H-NMR spectra of L
α and HII phases of a POPE dispersion.……….………….20 Fig. 2.1 DSC thermograms of POPE/CerC16 dispersions with various molar ratios….………..30
IX
ratio………...………...………...…………...33 Fig. 2.3 The 2H and 31P-NMR spectra of a POPE-d
31/CerC16 90/10 dispersion……….36 Fig. 2.4 The proposed partial phase diagram for POPE/CerC16 system………...39
Fig. 2.5 Smoothed order profiles of POPE-d31 and CerC16-d31 in Lα phase at 42 oC, and HII phase at 65 oC……….42 Fig. 3.1 The sequentially acquired 2H and 31P-NMR spectra, as well as the corresponding dePakeled quadrupolar splitting powder pattern of a POPE/n-decane-d22 90/10 mol% mixture………...………...………...…55 Fig. 3.2 The Phase distribution graphs of either the two components of a POPE/n-decane-d22
90/10 mol% dispersion at different temperatures……….………..59 Fig. 3.3 The partitioning constants, as well as the global HII content of a POPE/n-decane-d22
90/10 mol% dispersion at different temperatures………..……….61 Fig. Anx 1 The 2H and 31P-NMR spectra of a POPE/CerC16-d
31 95/5 mol% dispersion.………68 Fig. Anx 2 The phase distribution graphs derived from the 2H and 31P-NMR spectra of four POPE/CerC16-d31 dispersions with various molar ratios...69
Fig. Anx 3 The phase distribution graphs of a POPE-d31/CerC16 90/10 dispersion………..…………70 Fig. Anx 4 Theoretical phase diagram of the POPE/CerC16 system based on regular solution
X AFM: atomic force microscopy
𝐵0: external magnetic field Bax protein: bcl-2-like protein 4
CerC16: N-palmitoyl-D-erythro-sphingosine
CerC16-d31: N-palmitoyl-d31-D-erythro-sphingosine CSA: chemical shift anisotropy
DAG: diacylglycerol
𝛿𝐼𝑆𝑂: isotropic phase chemical shift tensor 𝛿∥: parallel averaged chemical shift tensor 𝛿⊥: perpendicular averaged chemical shift tensor
DEPE: 1,2-dierucoyl-sn-glycero-3-phosphoethanolamine
DiIC18: 1,1′-dioctadecyl-3,3,3′,3′-tetramethylindocarbocyanine perchlorate DMPC: 1,2-dimyristoyl-sn-glycero-3-phosphocholine
DOPE: 1,2-dioleoyl-sn-glycero-3-phosphoethanolamine DPPC: 1,2-dipalmitoyl-sn-glycero-3-phosphocholine DSC: differential scanning calorimetry
EDTA: ethylenediaminetetraacetic acid EFG: electric field gradient
𝜂: asymmetry parameter HI: hexagonal phase
XI HPLC: high performance liquid chromatography 𝐼: nucleus spin number
Lα: liquid crystalline phase Lβ: gel phase
𝑚𝑙: nucleus spin quantum number NMR: nuclear magnetic resonance 𝜔𝑄: quadrupolar coupling constant
π: pressure integral
PC: phosphatidylcholine PE: phosphatidylethanolamine
POPC: 1-palmitoyl-2-oleoyl-sn-glycero-3-phosphocholine POPE: 1-palmitoyl-2-oleoyl-sn-glycero-3-phosphoethanolamine
POPE-d31: 1-palmitoyl-d31-2-oleoyl-sn-glycero-3-phosphoethanolamine PS: phospho-L-serine
PSM: N-palmitoyl-sphingomyelin Q: nuclear electric quadrupole moment QII: inverted micellar cubic phase R0: intrinsic radius of curvature RBC: red blood cell
RF: radio frequency
XII TH: fluid-to-inverted hexagonal transition temperature Tm: gel-to-fluid transition temperature
XIII
I would like to express my sincere appreciation to my supervisor Prof. Michel Lafleur for providing me with the great opportunity to perform esearch in the domain of biophysics, and for generously offering his precious time to keep my M.Sc. project always on the right path.
I would also thank my colleagues, Adrian and Mehdi, who helped me a lot to settle in the group and quickly start my researches in the lab. I also thank the National Sciences and Engineering Research Council of Canada, NSERC, for financially supporting my M.Sc. project.
XIV
میدقت
ردام و ردپ هب
1
1.1 How do some lipid bilayers adopt non-bilayer morphologies?
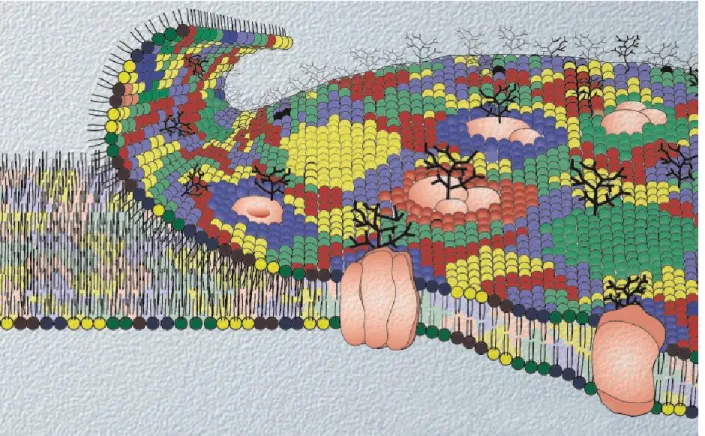
The ability of lipids to self-assemble into dynamic microstructures is of central importance since living cells are highly dependent on the proper functioning of self-assembled microstructures such as their plasma membrane (Fig. 1.1). In water, lipid molecules gather together to form self-assembled microstructures because the head group and the acyl chains have different polarities. In fact, they arrange themselves in a way, so that the polar (hydrophilic) head groups are in contact with polar water molecules, and the apolar (hydrophobic) acyl chains are shielded in the middle of the aggregate, away from the water medium. Depending on some specific factors, lipid molecules can self-assemble into a variety of morphologies (different phases), such as gel (Lβ), liquid crystalline (Lα), or inverted hexagonal (HII) (Fig. 1.2); this phenomenon is called “polymorphism”. The factors influencing the morphology of the self-assembled structures could be related to molecular features such as the bulkiness of the polar head group and the length of the apolar acyl chain, as well as external conditions such as temperature, pH, etc. The variations of these factors may cause the conversion of one phase to another, i.e. a phase transition.
Cellular membranes have a highly dynamic behavior as they are in constant interactions with other cells, as well as the surrounding medium. They not only have to preserve their lamellar morphology at large scale, but also need to maintain their molecular dynamics at smaller scales (1, 2). To obtain a balance between the stability and dynamics of their membranes, living cells employ a combination of lipid species. As a comparison between different lipid species,
2
phosphatidylcholine (PC) forms stable lipid bilayers under physiological conditions. Conversely phosphatidylethanolamine (PE) and diacylglycerol (DAG) can exhibit both bilayer and non-bilayer structures under different conditions. As a consequence, their presence in PC bilayers can destabilize the lamellar structure (3). The presence of lipids capable of forming non-bilayer structures is essential in the proper functioning of cell membranes. For instance, they can mediate protein‒lipid interactions and modulate protein activity (4).
Fig. 1.1: A schematic of the eukaryotic plasma membrane. The various phospholipid species are shown in different colors. The figure was reproduced by permission from the Nature Reviews Molecular Cell Biology (5).
3
Non-bilayer lipids can also modulate the local curvature of lipid bilayers (6). As an indication of their important role, one can imply to some microorganisms that alter the ratio between their bilayer and non-bilayer forming lipids as a function of the environment temperature (7). Besides the dynamic regulation of the bulk lipid composition, cell membranes display asymmetric lipid distribution between the two monolayers. For instance, in plasma membranes, PE and phospho-L-serine (PS), are accumulated within the monolayer in contact with the cytoplasm (6, 8).
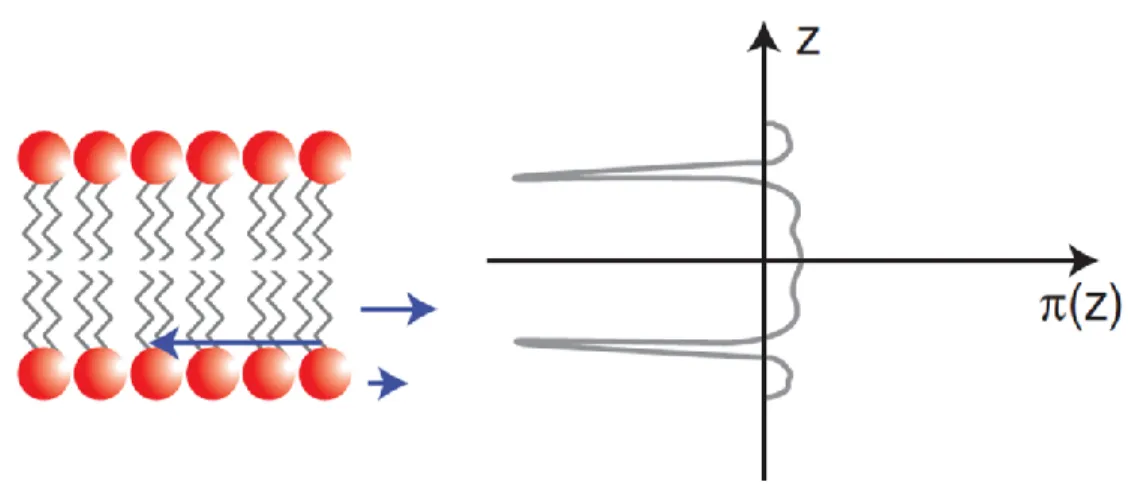
Considering a relaxed lipid bilayer at equilibrium, the balance of all the lateral forces, both attractive and repulsive, applied on the different parts of either of the monolayers must set the pressure integral on the bilayer (𝜋) to zero (Fig. 1.3). A lipid monolayer is formed of three different parts: the head groups, the acyl chains, and the head group/acyl chain interface. The later has a very critical role since any increase in this area is energetically costly, and leads to an exposure of the acyl chains to water. The head groups can be affected by environment conditions and a change in their structure can result in perturbing the pressure profile and consequently, the stability of the lipid bilayer. Globally, an uneven distribution of the positive and negative forces applied across the different parts of a lipid bilayer leads to a nonzero integral torque (T) that can bend the monolayers in opposite directions. As a comparison, the entropic repulsion is more significant in the lipid bilayers consisted of lipids with bulky acyl chains. The strong entropic force then powerfully pushes the acyl chains apart resulting either the lipid monolayers to acquire higher degrees of curvature and eventually be separated. However, this monolayers separation is unfavorable from a thermodynamic point of view as it would create voids inside the membrane (9).
4
Fig. 1.2: Schematics of (A) gel (Lβ), (B) liquid crystalline (Lα), and (C) inverted hexagonal (HII) phases.
5
Therefore, the unbalance torque results in the creation of an “elastic stress” stored in the bilayer. This stress could be accumulated until a critical value that is intrinsic for a given bilayer and correlated with the shape of the constituent lipids (10). If the accumulated elastic stress exceeds the critical value, the two monolayers separate apart, forming non-bilayer phases such as hexagonal (HI), inverted hexagonal (HII), inverted micellar cubic (QII), etc. For example, it was shown that CerC16, a sphingolipid bearing a small head group and used in the present work, induce a decrease in the Lα‒HII transition temperature of 1,2-dierucoyl-sn-glycero-3-phosphoethanolamine (DEPE) (11).
Fig. 1.3: A schematic of the pressure profile (𝜋) due to the lateral forces (blue arrows) applied across the different parts of a relax bilayer at equilibrium. The figure was reproduced by permission from the Cold Spring Harbor Perspectives in Biology Journal (10).
Another model that rationalizes the different phase behavior of various lipids is based on the intrinsic molecular morphology of each lipid. The shape of a lipid molecule can be characterized by a packing parameter, 𝑃, defined as 𝑃 = 𝑉 𝑎𝑙⁄ where 𝑉 is the specific volume occupied by the acyl chains, 𝑎 is the area per lipid molecule at the polar/apolar interface, and 𝑙
6
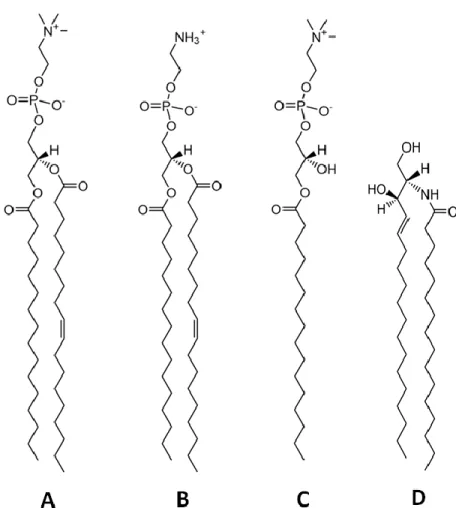
is the effective length of the acyl chains (12). The 𝑃 parameter describes the effective shape of the lipid molecule in fluid state: 𝑃 ≈ 1 for cylinder shape molecule such as sn-glycero-3-phosphocholine (POPC), 𝑃 > 1 for cone shape lipids such as 1-palmitoyl-2-oleoyl-sn-glycero-3-phosphoethanolamine (POPE), and 𝑃 < 1 for inverse cone shape lipids such as lysophosphocholine (LPC) (Fig. 1.4). In fact, one could make a bridge between the two abovementioned models ‒ torque model and intrinsic molecular morphology model, as 𝑃 defines the spontaneous curvature (SC) of a lipid monolayer (13); SC is obtained when the torque applied across the lipid monolayer is zero, and thus, the curvature of the lipid monolayer is imposed by the morphology of the constituent lipid molecules. It should be noted that in case of the multicomponent monolayers, the curvature is approximately the average of those of all the lipid constituents (14). Monolayers constructed by cylindrical lipid molecules (𝑃 ≈ 1) form bilayers under zero SC condition. However, lipids with 𝑃 ≠ 1 inserted in bilayers have to “reshape” into cylindrical morphologies. This lipids reconfiguration into cylindrical morphologies causes stress on the bilayers as 𝑉, the acyl chain volume of the lipids, must remain constant, and thus, the acyl chains have to be either stretched or squeezed.
Globally, the P value illustrates how far a bilayer curvature diverges from the SC, or in other words, how strong the stored stress propels the bilayer toward non-bilayer morphologies.
The transformation of lipid bilayer to non-bilayer morphologies is a typical example of lipid polymorphism (7). It should be noted that different lipid molecules with 𝑃 > 1, could make “inversed” non-bilayer phases of various morphologies such as HII, QII, etc. As an example, one could mention about the hexagonal (HI) and inversed hexagonal (HII) phases in which the monolayers fit into closely packed cylindrical structures. The only difference between these two
7
phases is the orientation of the molecules relative to the cylinders. In the HI phase, the acyl chains are toward the center of the cylinders while they point away from the cylinder center in the HII phase, the middle of the cylinder being filled with water.
Fig. 1.4: The structure and main phase transition temperature of (A) POPC, Tm = -2.6 oC (15), (B) POPE, Tm = 25 oC, (C) 16:0 LPC, Tm = 3.4 oC (16), and (D) CerC16, Tm = 91 oC (17).
8
1.2 Brief introduction to the project
My M.Sc. project is focused on two main aspects:
Ceramide-C16 as a versatile modulator of phosphatidylethanolamine polymorphism,
Characterization of n-decane distribution within phosphatidylethanolamine Lα/HII phases.
1.2.1 Ceramide-C16 is a versatile modulator of phosphatidylethanolamine polymorphism
As the first part of the project, I studied the effects of CerC16, an important sphingolipid involved in several diseases such as diabetes, obesity, Parkinson, etc., on the polymorphism of POPE membrane. It has been reported that CerC16 exhibits a Lβ‒Lα transition at ~91 oC (17), while POPE goes through two phase transitions: a Lβ‒Lα phase transition at ~25 oC (18), and a Lα‒HII phase transition at ~71 oC (19). The findings are presented in chapter 2; it corresponds to a publication accepted by Biophysical Journal. I employed DSC for measuring the thermal behavior of both pure POPE and POPE/CerC16 dispersions of various molar fractions. I also used sequentially 2H and 31P-NMR spectroscopy for calculating the phase distribution, as well as measuring the acyl chains dynamic of either the components ‒ POPE and CerC16, within various phases at different temperatures.
9
1.2.2 Characterization of n-decane distribution within phosphatidylethanolamine Lα/HII phases
As the second part of the project, I studied how n-decane, a simple aliphatic chain, is distributed in the Lα/HII phases of POPE. The promotion of HII phase of POPE by n-decane was also investigated. Similar to the first part of the project, sequential 2H and 31P solid-state NMR spectroscopy at different temperatures was employed for measuring the phase distribution of both components ‒ POPE and n-decane, within either the phases at different temperatures.
1.3 Techniques
1.3.1 Differential scanning calorimetry (DSC)
In DSC the amount of energy absorbed or released by a sample is measured with respect to that of a reference, providing quantitative and qualitative data on endothermic (heat absorption) and exothermic (heat evolution) processes. Technically, a differential method is applied to continuously measuring the heat flow into the sample, and equalizing the implicit heat gains and losses between the sample and the reference (20). Since heat flow is measured under constant pressure in DSC, the variation of heat flow into the sample is equivalent to enthalpy changes,
(
𝑑𝑞𝑑𝑡
)
𝑃=
𝑑𝐻𝑑𝑡 . The Heat capacity of the sample,
𝐶
𝑃,
is determined as:𝐶
𝑃= ∆ (
𝑑𝐻𝑑𝑇
)
𝑃 Eq. 1.110
𝐶
𝑃= Δ (
𝑑𝐻 𝑑𝑇)
𝑃= ∆
𝑑𝐻 𝑑𝑡 𝑑𝑡 𝑑𝑇= Δ (
𝑑𝑞 𝑑𝑡)
𝑃 𝑑𝑡 𝑑𝑇 Eq. 1.2 where(
𝑑𝑞𝑑𝑡
)
𝑃is the variation of the heat flow into the sample and 𝑑𝑡𝑑𝑇 is the inverse of the
temperature scan rate, one can plot the changes in the heat capacity of the sample versus temperature ‒
𝐶
𝑃 thermogram. Finally, one can calculate the total enthalpy of a phase transition of the sample by integrating the area under the peak of the obtained 𝐶𝑃 thermogram as,Δ𝐻 = ∫ 𝐶𝑃𝑑𝑇 𝑇2
𝑇1 Eq. 1.3
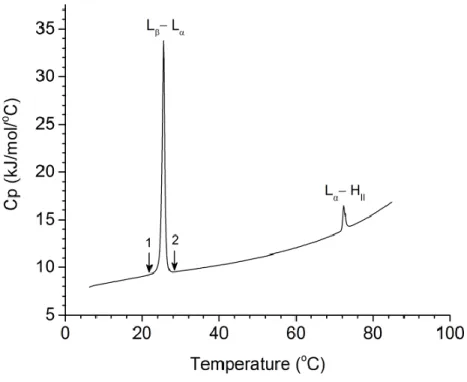
(Fig. 1.5). The thermograms of a lipid mixture, generally much broader than those of its pure lipid constituents, that allows determining the phase coexistence regions.
Fig. 1.5: The concentration normalized heat capacity thermogram of a pure POPE dispersion. Noted that the arrows presented on the thermogram indicate the beginning, 1, and the end, 2, of the Lβ‒Lα transition of the POPE dispersion used in measuring the integral of the thermal peak.
11 1.3.2 Solid state nuclear magnetic resonance
Solid state nuclear magnetic resonance (NMR) spectroscopy is a useful technique commonly exploited in a wide range of applications, from characterizing the synthetic products to studying the molecular structure of some complex systems such as catalysts, polymers, and proteins. In a solid compound, molecules do not move as freely as they do in liquids.
The nucleus spin number (𝐼) is the main parameter that defines the kind of coupling interaction that various nuclei go through with the external magnetic field. As a global classification based on 𝐼, different nuclei can be categorized into two groups of 𝐼 = 1 2⁄ such as 1H and 31P, and 𝐼 > 1 2⁄ (quadrupolar nuclei) such as 2H. Overall, there are 2𝐼 + 1 energy levels characterized by the nucleus spin quantum number (𝑚𝐼). While nuclei of 𝐼 = 1 2⁄ divided to two energy levels [𝑚𝑙= + 1 2⁄ , − 1 2⁄ ], there are three [𝑚𝑙 = +1, 0, −1] for the nuclei of 𝐼 = 1. Nuclei of 𝐼 > 1 2⁄ possess non-spherical charge distributions. The charge asymmetry of the quadrupolar nuclei can couple with electric-field gradients, EFG. This phenomenon is responsible for the so-called “quadrupolar splitting” seen in the solid-state NMR spectra of the 𝐼 > 1 2⁄ nuclei. In this project, I have performed static solid-state NMR of phosphorus (31P, 𝐼 = 1 2⁄ ), this nucleus being present in the polar head group of POPE, and of deuterium (2H, 𝐼 = 1), using perdeuterated acyl chains of either N-palmitoyl-D-erythro-sphingosine (CerC16-d31) or POPE-d31 or n-decane-d22. The phenomena leading to the peak broadening, namely, chemical-shift anisotropy (CSA) and quadrupolar splitting, are presented in the next section.
12 1.3.2.1 Chemical-shift anisotropy (CSA)
The CSA is one of the factors that has major influences on defining the broadness and shape of the 31P powder pattern in the solid-state NMR spectroscopy. The origin of CSA can be explained considering the fact that the electron cloud around such nucleus does not display a spherical shape. Since the electron density affects the resonance frequency of a nucleus (the chemical shift), the orientation of the electron cloud, and thus, the orientation of the molecule with respect to 𝐵0 defines the resonance frequency of a nucleus in a solid sample. The CSA of a 𝐼 = 1 2⁄ nucleus is representative of the asymmetric electron distribution around the nucleus (Fig. 1.6A). The chemical shift anisotropy can be represented by a diagonalized tensor ‒ a 3 × 3 matrix with non-zero elements only on the diagonal. The highest and lowest chemical shifts are referred as 𝛿11 and 𝛿33 ‒ the first and third principal axis, respectively. The chemical shift value of 𝛿22 ‒ the one between 𝛿11 and 𝛿33, is perpendicular to both δ11 and δ33. Since numerous crystalline regions of random orientations are found in powders, the signal superposition of such crystalline regions defines a spectrum line shape schematically represented in Fig. 1.6B.
13
Fig. 1.6: (A) A schematic representation of the orientation effect of the ellipsoidal CSA principal values of a single nucleus of 𝐼 = 1 2⁄ . (B) The effect of random orientation of various crystalline regions leading to a powder pattern line shape.
14
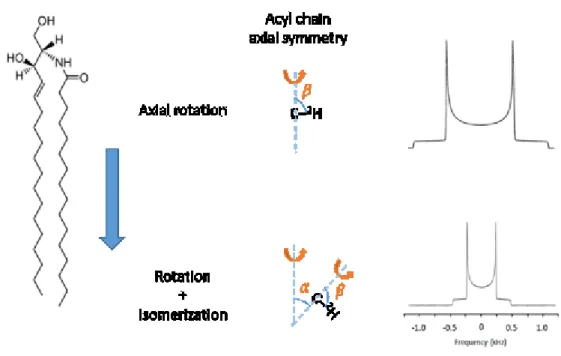
As mentioned earlier, lipid molecules experience various motion restrictions in different phases. In the case of Lβ phase, the motions are highly restricted, giving rise to a wide powder pattern because of the limited averaging of the CSA. In Lα phase, the lipid molecules rotate fast (on the NMR time scale) around their main molecular axis. This rotation results in averaging the chemical shift tensor that is reduced to 2 components: 𝛿∥, the parallel component and 𝛿⊥, the perpendicular component with respect to the symmetry axis of the molecules. For liposomes in the Lα phase, a powder pattern typical of axial symmetry is obtained (Fig. 1.7; top). In the case of the HII phase, lipid molecules experience a second fast rotation: their diffusion around the main axis of symmetry of the HII phase cylinders. This additional motion results in further averaging of the chemical shift tensors and reduces the CSA by a factor -1/2 compared to that of the Lα phase (Fig. 1.7B). In some lipid phases, such as inverted micellar cubic (QII), there could be isotropic motions causing complete averaging of the CSA; a very narrow peak similar to those of liquid samples appeared at 𝛿𝐼𝑆𝑂.
The 31P solid-state NMR signal of phospholipids could also be broadened because of 31P‒ 1H coupling interaction as several 1H nuclei exist around the phosphorus nucleus. To eliminate this coupling, one needs to use a 1H decoupling technique. Although, there are various techniques that could be utilized to decouple 1H‒31P interactions, they are all based on the introduction of a radio frequency (RF) pulse at the 1H frequency. In this project, I used a low-power decoupling method so-called “Waltz65”. The reason I chose a low-low-power decoupling technique was to avoid thermal perturbation of the sample.
15 Fig. 1.7: 31P-NMR spectra of (top) lamellar (L
α), and (bottom) inverted hexagonal (HII) phases of POPE. The averaged chemical shift tensors, 𝛿⊥ and 𝛿∥, are schematically presented for each phases.
16 1.3.2.2 Quadrupolar splitting
Regardless of its poor abundance, but because of the valuable information that could be obtained from, deuterium (2H, 𝐼 = 1) has been one of the most studied quadrupolar nuclei in all fields (21, 22). Since 2H has a small electron cloud and a fairly low gyromagnetic ratio (~1 7⁄ of 1H), this nucleus displays a small chemical shift of ~3‒4 ppm. However, 2H spectrum of a solid sample could be as wide as ~100 kHz. The origin of the 2H spectrum broadness is the quadrupolar interactions. As mentioned earlier, nuclei of 𝐼 = 1 such as 2H display three energy levels, [+1, 0, −1]. Once placed in an external magnetic field, 2H nuclei are allowed to perform two transitions: +1 → 0 and 0 → −1. Taking in into account only the Zeeman interaction, the two transitions should involve the same amount of energy, i.e. they should occur at the same frequency. However, the quadrupolar interactions disturb the Zeeman energy levels, so the energy differences associated with the two transitions are no longer equal. The strength of these interactions is described by the quadrupolar coupling constant, 𝜔𝑄, which is relative to 𝑄, the nuclear electric quadrupole moment of the nucleus (Fig. 1.8A). 𝑄 defines how strong a quadrupolar nucleus interacts with the electric field gradient. Because 2H has a relatively small 𝑄 value (3 × 10⁻³¹ 𝑚2), its 𝜔
𝑄 is around 100‒300 kHz (23); as a comparison, 𝜔𝑄 of 14N is ≥ 3 MHz (24).
The powder pattern of quadrupolar nuclei, depends on the asymmetry parameter, 𝜂 = 𝑉𝑥𝑥−𝑉𝑦𝑦
𝑉𝑧𝑧 where 𝑉𝑥𝑥, 𝑉𝑦𝑦, 𝑉𝑧𝑧 are the principal components of the electric field gradient around the
nucleus. Similar to CSA, the first-order quadrupolar coupling is dependent on the orientation of the molecules with respect to 𝐵0.
17
Fig. 1.8: (A) A schematic representation of the disturbance effect of the first-order quadrupolar coupling on the two equal Zeeman transitions of the 𝐼 = 1 nuclei of a single crystal. (B) A 2H quadrupolar coupling powder pattern when the asymmetry parameter, 𝜂, is zero.
18
The carbon-deuterium bonds found on a perdeuterated lipid acyl chain display an electric field gradient that has a cylindrical symmetry, with an axis of symmetric along the C-D bond. Therefore 𝑉𝑥𝑥 is equal to 𝑉𝑦𝑦, which makes 𝜂 become zero. Once 𝜂 = 0, the quadrupolar coupling of 2H nuclei is defined as 𝜐𝑄 =
3 4
𝑒2𝑞𝑄 ℎ (3𝑐𝑜𝑠
2𝜃 − 1), where 𝑒, 𝑞, 𝑄, and ℎ are the electron charge, the nucleus charge, the nucleus electric quadrupole moment, and the Planck constant, respectively. Therefore, 𝜐𝑄 displays an orientational dependency to 𝜃, the angle between 𝑉𝑧𝑧 and 𝐵0. Therefore, the resulting powder pattern is represented by a “double-horn” spectrum as shown in Fig. 1.8B.
Fig. 1.9: A schematic representation of the effect of different C‒2H motions along a lipid acyl chain on the powder patterns.
19
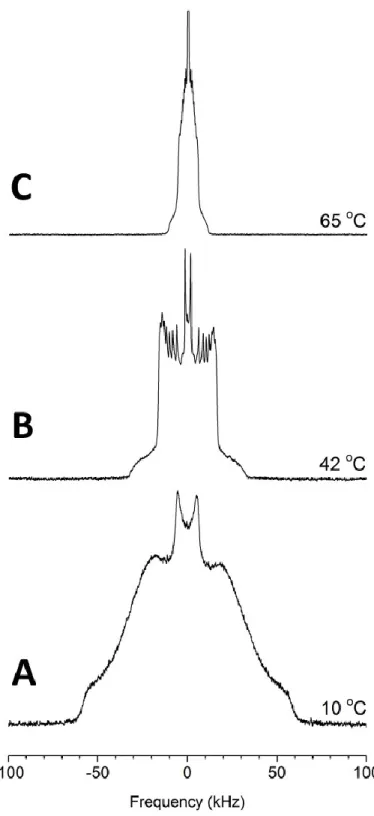
It should be noted that various C‒2H bonds along to a lipid acyl chain display different motions dependent on how far they are positioned from the polar head group (Fig. 1.9). In other words, the level of restriction applied on different C‒2H bonds along to the lipid acyl chain varies with the most for those close to the head group to the least for the terminal methyl. This variation in the level of motion demonstrated by different C‒2H bonds produces a series of superimposed powder patterns which are more visually resolved in the case of a Lα phase spectrum (Fig. 1.10B). The other aspect that has significant impact on the powder patterns of a deuterated lipid acyl chain is the different motions that lipid molecules experience in various phases. As an example, lipids in an Lβ phase rotate slowly on the NMR time scale, leading to a very broad, almost featureless spectrum. The same molecules experience much less restriction in the Lα phase as they rotate rapidly around their principal axis of symmetry. In HII phase, the lipids experience a fast diffusion around the HII cylinders’ axes of symmetry, reducing the width of the spectrum by a factor of ~2 compared to that of the Lα phase (Fig. 1.10, bottom) due to an extra averaging of 𝜃. Globally, the static 2H NMR spectrum acquisition is an advantageous technique, as it allows a phase identification, provides information on internal molecular motions (21, 25), and characterize internal molecular orientations and orders (26, 27).
20 Fig. 1.10: The 2H-NMR spectra of L
β (A), Lα (B), and HII (C) phases of a POPE-d31/CerC16 90/10 mol% dispersion.
21
1.4 References
1. McMahon, H. T., and J. L. Gallop. 2005. Membrane curvature and mechanisms of dynamic cell membrane remodelling. Nature 438:590‒596.
2. Paiement, J., and J. Bergeron. 2001. The shape of things to come: Regulation of shape changes in endoplasmic reticulum. Biochem. Cell Biol. 79:587‒592.
3. Cullis, P. R., and B. De Kruijff. 1979. Lipid polymorphism and the functional roles of lipids in biological membranes. Biochim. Biophys. Acta 559:399‒420.
4. Lee, A. G. 2004. How lipids affect the activities of integral membrane proteins. Biochim. Biophys. Acta 1666:62‒87.
5. Edidin, M. 2003. Lipids on the frontier: A century of cell-membrane bilayers. Nat. Rev. Mol. Cell Biol. 4:414‒418.
6. Hafez, I. M., and P. R. Cullis. 2001. Roles of lipid polymorphism in intracellular delivery. Adv. Drug Del. Rev. 47:139‒148.
7. de Kruijff, B. 1997. Lipid polymorphism and biomembrane function. Curr. Opin. Chem. Biol. 1:564‒ 569.
8. van Meer, G., D. R. Voelker, and G. W. Feigenson. 2008. Membrane lipids: Where they are and how they behave. Nat. Rev. Mol. Cell Biol. 9:112‒124.
9. Gruner, S. M. 1989. Stability of lyotropic phases with curved interfaces. J. Phys. Chem. 93:7562‒ 7570.
10. Frolov, V. A., A. V. Shnyrova, and J. Zimmerberg. 2011. Lipid polymorphisms and membrane shape. Cold Spring Harb. Perspect. Biol. 3:a004747.
11. Sot, J., F. J. Aranda, . . ., and A. Alonso. 2005. Different effects of long- and short-chain ceramides on the gel-fluid and lamellar-hexagonal transitions of phospholipids: A calorimetric, NMR, and X-ray diffraction study. Biophys. J. 88:3368‒3380.
12. Israelachvili, J. 1992. Intermolecular and surface forces. Academic, Santa Barbara, CA.
13. Gruner, S. M. 1985. Intrinsic curvature hypothesis for biomembrane lipid composition: A role for nonbilayer lipids. Proc. Natl. Acad. Sci. 82:3665‒3669.
14. Kumar, V. V. 1991. Complementary molecular shapes and additivity of the packing parameter of lipids. Proc. Natl. Acad. Sci. USA 88:444‒448.
15. Keough, K. M. W. 1986. Modifications of lipid structure and their influence on mesomorphism in model membranes: The influence of hydrocarbon chains. Biochem. Cell Biol. 64:44‒49.
16. Klopfenstein, W. E., B. de Kruyff, . . ., and L. L. M. van Deenen. 1974. Differential scanning calorimetry on mixtures of lecithin, lysolecithin and cholesterol. Chem. Phys. Lipids 13:215‒222. 17. Shah, J., J. M. Atienza, . . ., and G. G. Shipley. 1995. Structural and thermotropic properties of
synthetic C16:0 (palmitoyl) ceramide: Effect of hydration. J. Lipid Res. 36:1936‒1944.
18. Pozo Navas, B., K. Lohner, . . ., and G. Pabst. 2005. Composition dependence of vesicle morphology and mixing properties in a bacterial model membrane system. Biochim. Biophys. Acta 1716:40‒ 48.
19. Silvius, J. R. 1982. Thermotropic phase transitions of pure lipids in model membranes and their modifications by membrane proteins. In Lipid-protein interactions. John Wiley & Sons, Inc., New York.
20. Wunderlich, B. 2005. Thermal analysis of polymeric materials. Springer-Verlag Berlin Heidelberg, Netherlands.
21. Jelinski, L. W. 1985. Solid state deuterium NMR studies of polymer chain dynamics. Annu. Rev. Mater. Sci. 15:359‒377.
22
22. Fluck, E., N. Chandrakumar, and H. Günther. 1996. Spin-1 NMR. Springer Berlin Heidelberg, Berlin, Germany.
23. Mantsch, H. H., H. Saitô, and I. C. Smith. 1977. Deuterium magnetic resonance, applications in chemistry, physics and biology. Prog. Nucl. Magn. Reson. Spectrosc. 11:211‒272.
24. Marburger, S. P., B. M. Fung, and A. K. Khitrin. 2002. 14N chemical shifts and quadrupole coupling constants of inorganic nitrates. J. Magn. Reson. 154:205‒209.
25. Smith, R., and E. Oldfield. 1984. Dynamic structure of membranes by deuterium NMR. Science 225:280‒288.
26. Diehl, P., C. L. Khetrapal, and U. Lienhard. 1969. Deceptive simplicity in NMR spectra of oriented molecules. Org. Magn. Reson. 1:93‒99.
27. Luz, Z. 1985. Dynamics of molecular processes by NMR in liquid crystalline solvents. In Nuclear magnetic resonance of liquid crystals. J. W. Emsley, editor. Springer Netherlands, Dordrecht. 315‒ 342.
23
phosphatidylethanolamine polymorphism
**2.1 Abstract
Ceramide-C16 (CerC16) is a sphingolipid associated with several diseases like diabetes, obesity, Parkinson disease, and certain types of cancers. As a consequence, research efforts are devoted to identify the impact of CerC16 on the behavior of membranes, and to understand how it is involved in these diseases. In this work, we investigated the impacts of CerC16 (up to 20 mol%) on the lipid polymorphism of 1-palmitoyl-2-oleoyl-sn-glycero-3-phosphoethanolamine (POPE), using differential scanning calorimetry, and sequential 2H and 31P solid-state NMR spectroscopy. A partial phase diagram is proposed. The results indicate that the presence of CerC16 leads to an up-shift of the temperature of the gel-to-liquid crystalline (Lβ−Lα) phase transition, leading to a large Lβ/Lα phase coexistence region where gel-phase domains contain 35 mol% CerC16. It also leads to a down-shift of the temperature of the lamellar-to-inverted hexagonal (L−HII) phase transition of POPE. The opposite influence on the two phase transitions of POPE brings a three-phase coexistence line when the two transitions overlap. The resulting HII phase can be ceramide-enriched, coexisting with a Lα phase, or ceramide-depleted, coexisting with a L phase, depending on the CerC16 proportions. The uncommon capability of CerC16 to modulate the membrane fluidity, its curvature propensity, and the membrane interface properties highlights its potential as a versatile messenger in cell membrane events.
24
2.2 Introduction
Ceramides are bioactive sphingolipids that play an important role in cellular signaling and mediate several biological processes (1-9). For example, they are shown to be involved in some cellular events, including apoptosis (10-12), and in biological pathways leading, for example, to insulin resistance, and obesity (13, 14). In mammalian cell membranes, the most abundant acyl chains born by ceramides are saturated and contain 16 to 24 carbons (1, 15). The ceramide functions are intimately associated with their acyl chain length (10, 16). Among this family, ceramide with a palmitoyl chain (N-palmitoyl-D-erythro-sphingosine: CerC16) has been specifically shown to have a central influence in some cellular events. Because of the biological key roles of these molecules, it is essential to gain a detailed understanding of the modulation of the properties of biological membranes by ceramides; in the present work, we focussed our effort on characterizing the impact of CerC16 on the membrane physical properties.
From a chemistry point of view, ceramides display a relatively small polar head group that has the capability of forming hydrogen bonds through both the hydroxyl groups, and the amide linkage. As a consequence, ceramides with saturated acyl chains exhibit a dense molecular packing and have relatively high gel (Lβ)-to-fluid (Lα) phase transition temperatures (Tm) in comparison to phospholipids (17). For instance, CerC16 undergoes a chain-melting transition at 91 oC (18, 19). The impacts of ceramides on phospholipid bilayer properties have been recently reviewed (20, 21). These impacts are highly dependent on the ceramide chain length (19, 22-24). In general, when mixed with phospholipids, long-chain ceramides lead to an increase of the Lβ‒ Lα phase transition temperature; this shift was observed for different binary lipid mixtures
25
including 1,2-dierucoyl-sn-glycero-3-phosphoethanolamine (DEPE) (19, 25),
1-palmitoyl-2-oleoyl-sn-glycero-3-phosphocholine (POPC) (24, 26-28), 1,2-dimyristoyl-1-palmitoyl-2-oleoyl-sn-glycero-3-phosphocholine
(DMPC) (29), and 1,2-dipalmitoyl-sn-glycero-3-phosphocholine (DPPC) (30). Moreover, ceramides induce a considerable broadening of the Lβ‒Lα phase transition, a phenomenon observed for binary mixtures of phosphatidylcholines (PC) and of phosphatidylethanolamine (PE) (19, 24, 26). This effect leads to a large phase-coexistence region in the phase diagrams where ceramide-rich gel-phase domains are found with ceramide-depleted fluid domains (19, 24, 26). The strong inter-ceramide interactions have been identified as the driving force leading to the formation of these gel-phase ceramide-enriched domains (26). Ceramides also lead to an increase in chain order of fluid bilayers as reported by studies using solid-state deuterium nuclear magnetic resonance (2H-NMR) (22, 26, 31), and diphenylhexatriene fluorescence depolarization techniques (27, 28, 32). It was proposed that phase separations could also be observed at low temperatures, leading to the formation of two co-existing gel phases containing different ceramide proportions (19, 23, 26).
In addition to their effect on lateral mixing of lipids, ceramides have been shown to have an impact on the polymorphic propensities and curvature properties of bilayers; this phenomenon can be an alternative manner to modulate membrane properties. CerC16 (19), egg-yolk, and brain ceramides (25), bearing mainly C16 and C18 saturated chains, respectively, cause a decrease in the Lα-to-inverted hexagonal (HII) phase transition temperature (TH) of DEPE. For example, the addition of 10 mol% CerC16 brings TH down from 66 oC for pure DEPE to 56 oC (19). Differential scanning calorimetry (DSC) results showed that the endotherm peak associated with this transition becomes broader in the presence of CerC16. The promotion of the HII phase by
26
ceramide has been associated with its small head group, and with its extensive capability of forming H bonds(19). Because of their opposite effects on the two transitions (increasing Tm while decreasing TH), ceramides can lead to an overlap of the Lβ−Lα, and the Lα−HII transitions (19). The presence of ceramides in bilayers formed by either PE, PC, or a mixture of both, was shown to induce membrane fusion and leakage; these phenomena were associated with the fact that ceramides could facilitate the formation of non-lamellar phases (33-36). It has also been proposed that ceramides promote the formation of non-lamellar intermediates because they display a rapid transbilayer motion (flip-flop) (37). Moreover, enzymatically produced ceramides cause the budding of giant unilamellar vesicles, and this formation of smaller vesicles was linked to the propensity of ceramides to acquire non-lamellar phases (38). Despite the fact that the ability of CerC16 to promote the HII phase is established, there is a limited knowledge relative to the molecular details of inserted CerC16 in this lipid matrix.
In the present work, we employed DSC, and sequentially acquired 2H and 31P solid-state NMR techniques to study the impacts of CerC16 on the polymorphism of
1-palmitoyl-2-oleoyl-sn-glycero-3-phosphoethanolamine (POPE). The CerC16 proportion was varied between 0 and 20
mol%; this range covers membrane concentrations observed in physiologically relevant conditions – for example, ceramide content in mitochondria increases considerably during apoptosis and can reach 10% of total lipids (39, 40). Moreover it has been reported that metastable phases that are sensitive to hydration, and thermal history can be formed above 20 mol% (26). By using CerC16 bearing a fully deuterated palmitoyl chain (N-palmitoyl-d31 -D-erythro-sphingosine: CerC16-d31), 2H NMR spectra provided a quantitative characterization of the phases in which CerC16 was involved as well as a description of the ceramide chain order. In
27
parallel, 31P chemical shielding anisotropy (CSA) of POPE provided a description of the phase behavior of the phospholipid. We carried out a sequentially acquisition of the 2H, and 31P NMR spectra of POPE/CerC16-d31 mixtures in defined and controlled conditions, including temperature. These data allowed a detailed description of the mixture phase behavior. A mirror sample with POPE bearing a fully deuterated palmitoyl chain (POPE-d31) was also examined, not only to validate the phase behavior of POPE in the mixtures, but also to compare the order of POPE acyl chain with that of CerC16.
2.3 Materials and Methods
2.3.1 Materials
POPE, POPE-d31, CerC16, and CerC16-d31 were purchased from Avanti Polar Lipids, Inc. (Alabaster, AL, USA). All the lipids were > 99% pure, and were utilized without further purification. 4-(2-Hydroxyethyl)piperazine-1-ethanesulfonic acid (HEPES, > 99%), ethylenediaminetetraacetic acid (EDTA, > 99%), and deuterium-depleted water (≤ 1 ppm deuterium oxide) were purchased from Sigma-Aldrich (St. Louis. MO, USA). NaCl (high purity grade) was supplied by AMRESCO LLC (Solon, OH, USA). Benzene (> 99%) and methanol (HPLC grade) were acquired from EMD Millipore Corporation (Billerica, MA, USA) and Fisher Scientific (Fair Lawn, NJ, USA), respectively.
2.3.2 Lipid Mixture Dispersions
The lipid mixtures were prepared from organic solutions. For the DSC measurements, a solution of CerC16 with a known concentration was first prepared by dissolving a weighted
28
quantity of CerC16 into an exact volume of a 90/10 (v/v) benzene/methanol mixture. Binary lipid mixtures with the desired composition were prepared by dissolving a weighted quantity of POPE into the appropriate volume of the CerC16 solution. The resulting solutions were freeze-dried for at least 24 hours to ensure the complete solvent elimination. For the NMR samples, the binary lipid mixtures were prepared by dissolving the appropriate quantities of POPE, and CerC16 into the 90/10 (v/v) benzene/methanol mixture and by freeze-drying the solution for at least 24 hours. The lipid mixtures were hydrated using a HEPES buffer (20 mM HEPES, 100 mM NaCl, and 0.05 mM EDTA, prepared in Milli-Q water), pH 7.4. For the DSC experiments, the final lipid concentration was 20 mM, except for the pure POPE dispersion for which the concentration was 7.8 mM. For the NMR samples, 8 mg (14 mol) of CerC16-d31 were used for ensuring a good 2H-NMR signal. A 200-µL aliquot of buffer was used to hydrate each sample. Thus, the final lipid
concentration varied from 703 mM for the POPE/CerC16-d31 95/5 mixture, to 350 mM for the molar ratio 80/20. In the case of the POPE-d31/CerC16 90/10 dispersion, 12 mg (16 mol) POPE-d31, 38 mg (53 mol) POPE, and 4 mg (8 mol) CerC16 were used, and the final lipid concentration was 384 mM. The same hydration protocol was performed for both DSC and NMR techniques: two heating-cooling cycles between 45 oC, and 0 oC, and a third cycle between 95 oC, and 0 oC were imposed on each lipid sample.
2.3.3 DSC Measurements
The DSC measurements were carried out on a VP-DSC MicroCalorimeter (MicroCal, Inc., Northampton, MA, USA). Three consecutive heating scans between 5, and 85 oC in the case of the pure POPE dispersion, and between 5, and 95 oC for the binary lipid mixtures, were carried
29
out at a heating rate of 30 oC/hour. The second and third scans provided very similar thermograms, and the second heating scans were selected for the analysis.
2.3.4 NMR Spectroscopy
The spectra were recorded using a Bruker Avance II 400 WB spectrometer equipped with a 9.4 T magnet, leading to a resonance frequency of 61.43 MHz and 162.03 MHz for 2H and 31P nucleus, respectively. A Bruker static probe with a 5-mm coil was used. In the case of 2H acquisitions, five thousand scans were recorded using the quadrupolar echo pulse sequence with a 90o pulse of 1.7 μs, an interpulse delay of 40 μs, and a recycle time of 300 ms. For the 31P nucleus, a single 90o pulse of 4.05 μs, a recycle delay of 1 s, and a “Waltz65” low-power proton decoupling were used for recording the spectra; typically, 1500 scans were recorded. The sequential acquisition of 2H and 31P NMR spectra was carried out as a function of temperature, between 0 oC, and 65 °C. After the temperature stabilization, the signal acquisition of either nucleus was initiated. After the acquisition of the first spectrum, the spectrometer was then tuned for the signal acquisition of the other nucleus. The probe that was used presented the advantage of being tuned for the different nuclei without having to be removed from the magnet; this aspect was essential in the sequential acquisition of the NMR spectra as it kept the samples in the very same conditions during the data collection. At the phase transition temperatures, the spectrum of the first recorded nucleus was duplicated after the signal acquisition of the second nucleus, to validate that no significant phase evolution could be observed.
Based on the 2H spectra, the phase distribution of CerC16 could be determined, as described in the Results and Discussion section. In a similar way, the 31P NMR spectra provided a
30
description of the phase distribution of POPE as discussed below. The smoothed order profiles of the lipid acyl chains were obtained from the dePaked (41) 2H-NMR spectra using the method previously described (42).
Fig. 2.1: DSC thermograms of POPE/CerC16 dispersions: (A) 80/20, (B) 85/15, (C) 90/10, (D) 95/05, and (E) pure POPE dispersion. To enhance the clarity, the thermograms were offset by 5 kJ/mol/oC.
2.4 Results and Discussion
2.4.1 DSC MeasurementsThe DSC thermograms of a pure POPE dispersion and of POPE/CerC16 dispersions of various compositions are shown in Fig. 2.1. POPE displayed a Lβ−Lα phase transition at 25oC (Tm) whereas the Lα−HII phase transition was observed at 72 oC (TH). CerC16 disturbed significantly the
31
phase behavior of POPE, even at a molar fraction of 5 mol%. The presence of CerC16 resulted in two major impacts on the thermogram of a POPE dispersion: first, a broadening, and an up-shift in temperature of the endothermic Lβ−Lα transition peak, and second, a broadening and a down-shift in temperature of the lamellar (L)−HII transition peak. The molar enthalpies of both phase transitions of pure POPE and of the investigated POPE/CerC16 dispersions are reported in Table 2.1. On one hand, CerC16 induced a decrease in the ΔH of the Lβ−Lα transition, reducing it from 23.9 kJ/mol for pure POPE, which is in good agreement with the literature (43), to 17.5 kJ/mol when the proportion of ceramide was between 5, and 20 mol%. On the other hand, CerC16 appeared to have no considerable influence on the ΔH of the L−HII transition as the values obtained for the investigated ceramide contents remained around 2.2 kJ/mol, a value observed for pure POPE dispersions (44). These results were analogous to those reported for DEPE/CerC16 mixtures (19), as well as for DEPE/egg-ceramides mixtures (25).
Table 2.1: The Lβ−Lα, and L−HII phase transition temperatures and enthalpies of a pure POPE dispersion and POPE/CerC16 dispersions of various molar fractions. The ΔH values are reported per mole of lipids i.e. POPE+CerC16. Tm, and TH correspond to the top of the endothermic peaks.
POPE/CerC16 (mol ratio)
Tm (oC) ΔH (Lβ−Lα) (kJ/mol) TH (oC) ΔH (L−HII) (kJ/mol) 100/00 25.6 23.9 72.4 2.2 95/05 26.0 17.9 61.7 1.6 90/10 26.2 17.5 58.1 1.8 85/15 26.9 18.3 52.6 2.4 80/20 27.4 16.9 50.8 2.4
32 2.4.2 NMR Spectroscopy
The sequential 2H and 31P NMR spectra of POPE/CerC16-d
31 dispersions of various compositions are shown in Figs. 2.2, and Anx 1 (Annex). As mentioned above, 2H and 31P NMR spectra provided independent information about the phase characteristics of CerC16-d31 and POPE, respectively. For 31P NMR, the CSA is representative of the different phospholipid phases. For instance, at 10 oC, the 31P spectra of the lipid dispersions showed a CSA of ~69 ppm, a value characteristic of a gel lamellar phase. At 42 oC, the CSA was reduced to ~44 ppm and the spectra were typical of fluid systems (45, 46). The spectra indicated the shift of the Lβ−Lα phase transition towards high temperatures as the 31P-NMR spectra recorded in the L
β/Lα coexistence region displayed CSA values intermediate between those observed in the pure Lβ, and the pure Lα phases; for example, at 42 oC, the spectrum of 20 mol% CerC16 mixture (CSA of 47 ppm) was broader than that of 10 mol% CerC16 dispersion (CSA of 45 ppm). 31P-NMR spectra of phospholipids in the HII phase display a CSA reduction by a factor of 2, and an inversion of their line shape because of the rapid diffusion of the lipid molecules around the cylinders (46, 47). The shift of the Lα‒HII phase transition towards low temperatures in the presence of CerC16 was also observed by 31P-NMR spectroscopy. For example, the spectrum recorded at 58 oC for the mixture containing 10 mol% CerC16 displayed a coexistence of the Lα, and HII patterns whereas that at 57 oC for the mixture containing 15 mol% CerC16 was practically exclusively representative of the HII. For the samples containing 15, and 20 mol% CerC16, a small narrow peak at 0 ppm was observed at high temperatures; it could correspond to the formation of a cubic phase, or small lipid assemblies. This narrow component always corresponded to less than 10% of the 31P spectra
33
Fig. 2.2: The 2H (left column) and 31P (right column) NMR spectra of POPE/CerC16-d
31 dispersions with various molar ratio: (A) 90/10, (B) 85/15, and (C) 80/20. The acquisition temperature is indicated on the right. The narrow peaks at 0 kHz in the 2H-NMR spectra at high temperature were topped to allow a good representation of the HII signal.
34
area. The formation of these structures was reversible as no such narrow component was observed in the spectra recorded at 25 oC after the heating run. In the case of 2H-NMR, a broad featureless spectrum characteristic of a gel phase (48), was obtained at 10 oC for all the lipid dispersions. Upon heating, there was the apparition of a pattern representative of the Lα phase. This pattern was composed of several overlapping powder patterns with different quadrupolar splittings associated with the orientational order gradient existing along the lipid perdeuterated acyl chain(42, 48, 49). The 2H-NMR spectra indicated a shift towards higher temperatures of the Lβ−Lα phase transition experienced by CerC16-d31. Several spectra were a superposition of Lβ-, and Lα-phase components and it was observed from those recorded at 42-47 oC that the proportion of the Lβ-phase component increased with increasing CerC16 content. Upon further heating, a profile associated with the HII phase was observed. This pattern displayed quadrupolar splittings reduced by a factor of more than 2 compared to that of Lα phase (50). The overall shape was also different to that of the Lα-phase component because the symmetry of the HII phase led to a more linear decrease of orientational order along the lipid chain. The spectra of all the dispersions at ~65-68 oC corresponded to the H
II pattern. These spectra included, as for the 31 P-NMR spectra, a small narrow peak centered at 0 kHz, representative of ceramides experiencing isotropic motions on the NMR time scale. This component represented at the maximum 5% of the area. Three observations must be highlighted. First, the spectra recorded at 54-55 oC for the POPE/CerC16-d31 mixtures with 15, and 20 mol% CerC16 were a superposition of components typical of the Lβ, Lα, and HII phases, revealing the coexistence of these 3 phases. Second, the spectra at 58 oC of the POPE/CerC16-d
31 mixtures with a molar ratio of 95/5 and 90/10 included Lα-, and HII-phase components whereas those of the 85/15, and 80/20 POPE/CerC16-d31 mixtures
35 at 57 oC was composed of the L
β-, and HII-phase components. Third, all the CerC16 molecules were solubilized in the HII phase upon heating as inferred from the 2H-NMR spectra showing a single profile characteristic of the HII phase.
We proceeded to a quantitative analysis of the spectra to determine the composition of the various phases. Since the lamellar, and HII phases lead to distinct 2H- and 31P-NMR signals, the proportion of CerC16 (bearing the deuterated chain), and POPE (bearing the phosphate-containing head group) in each phase was inferred from the areas of the two components that could reproduce the experimental spectra by a linear combination. The components of the pure phases corresponded to experimental spectra acquired under different conditions (generally at a slightly different temperature and/or with a different CerC16 content). The area of the narrow peaks was determined directly on the spectra. In the case of 2H-NMR spectra, the L
β, and Lα phases also led to 2 different profiles that could be resolved. Therefore, the distribution of CerC16-d31 between the different lamellar phases was inferred from the relative area of each component whose linear combination led to the best fit of the experimental spectra. The spectra typical of the pure phases were again obtained experimentally under different conditions leading to the presence of a single phase. The phase composition graphs of the binary lipid dispersions obtained from this quantitative analysis are presented in Fig. Anx 2.
Sequential 2H- and 31P-NMR was also used to determine the phase behavior of a POPE-d31/C16-Cer 90/10 dispersion (Fig. 2.3). The phase composition analysis from the 2H- and 31 P-NMR spectra was carried out using the approach described above; in this case, both nuclei probed the phase behavior of POPE in the mixture. For the L and HII phases, the 2H- and 31 P-NMR results provided a similar phase description, with an average difference of 5%. These were
36
also consistent with those provided by the 31P-NMR of the POPE/CerC16-d
31 mirror sample. The inferred phase distribution at 57-58 oC displayed a difference of 20% between the mirror samples, illustrating the observation that the Lα-HII phase transition was very sensitive to the experimental conditions. This susceptibility also confirms that sequential NMR acquisition, as carried out in the present work, is essential to describe accurately the behavior of the labelled species. The fractions of POPE in the Lβ, and Lα phases were obtained from the 2H NMR spectra of POPE-d31, as described above (Fig. Anx 3).
Fig. 2.3: The 2H (left) and 31P (right) NMR spectra of a POPE-d
31/CerC16 90/10 dispersion.
The combination of the NMR and DSC data led to the construction of the partial phase diagram of POPE/CerC16 system (Fig. 2.4). This diagram does not take into account the contribution of the narrow line in the NMR spectra as this was always a small component and its assignment could not be clearly established. The onset of the Lβ-Lα phase transition of the investigated POPE/CerC16 mixtures was very similar for the different proportions of CerC16,
37
suggesting the existence of a three-phase line and, consequently, a gel/gel phase coexistence region. The existence of ceramide-rich, and ceramide-depleted domains is also reflected by the solidus line that is considerably different to the one predicted from regular solution theory (51), (see Fig. Anx 4). It is noteworthy that the gel-phase NMR spectra of POPE-d31/CerC16 mixtures at 10 oC displayed slightly more pronounced components at 20 kHz than that of POPE/CerC16-d31 mixtures (Figs. 2.2, and 2.3), suggesting a slightly faster rotational diffusion (52). This observation would be compatible with POPE involved in a more dynamic gel phase than CerC16. The two spectra showed however a single and similar component for the CD3 signal; therefore, the methyl dynamics appeared to be not sufficiently different to be resolved in the spectra. A gel/gel phase coexistence region was also observed for DEPE/CerC16 (19), POPC/CerC16 (26), and PSM/CerC16 (53) phase diagrams. AFM experiments revealed the existence of two gel phases with distinct nanomechanical properties in PSM/CerC16 (53), and DPPC/CerC16 mixtures (54). Moreover 1,1′-dioctadecyl-3,3,3′,3′-tetramethylindocarbocyanine perchlorate (DiIC18), a lipophilic fluorescent probe, was found to partition differently between two gel phases.
The DSC results indicated an upshift of the Lβ−Lα transition temperature as a function of the CerC16 proportion in the lipid mixture, and the NMR results showed that both lipids experienced this upshift. The coexistence phase regions reflect well the asymmetrical shape of the endotherms in the DSC thermograms. The solidus (the frontier between the Lβ, and the Lβ/Lα regions), and the liquidus (the frontier between the Lβ/Lα, and the Lα regions) lines could be determined from the 2H-NMR spectra, using the method introduced by Vist et al. (55) and successfully applied to N-palmitoyl-sphingomyelin (PSM)/CerC16 mixtures (53). This subtraction method was applied using the 2H-NMR spectra obtained from the mixtures containing 10, and 20
38
mol% CerC16-d31. The results indicated that between 30 oC and 50 oC, Lα-phase domains containing 5 mol% CerC16 coexisted with Lβ-phase domains that contained 30 mol% CerC16. The Lβ/Lα phase distributions of POPE, and of CerC16 obtained from the two series of mirror-sample 2H-NMR spectra (Figs. 2.1, 2.2, Anx 1, Anx 2 and Anx 3) were put together to infer the composition of each phase, providing an alternative method to determine the solidus and the liquidus boundaries from a different data set. The agreement between the liquidus lines obtained from the spectral subtraction method (55) and from the phase distributions in the mirror samples was very good. The later method determined that the gel-phase domains included 40 mol% CerC16, a value slightly higher than that inferred from the spectral subtraction method. This difference is likely within the experimental error associated with the uncertainties in the subtraction factors, the area determinations, and the sample compositions.
At 54‒55 oC, the coexistence of three phases (L
β/Lα/HII) could be assessed from the 2H-NMR spectra. The Lβ phase appeared to involve exclusively CerC16 while the Lα, and HII phases were a mixture of the two lipids. Since the investigated lipid mixtures included two components (water was in excess in all the dispersions), a 3-phase horizontal line must be included in the phase diagram. This line was extended up to only 20 mol% CerC16, as we do not have sufficient information to describe the behavior for larger CerC16 contents. Moreover, the phase behavior of phospholipid bilayers containing higher CerC16 proportions is somehow controversial because of the presence of putative metastable phases (18, 26). The NMR results revealed that the nature of transition towards the HII phase was deeply affected by the CerC16 content. The lipid mixtures underwent a transition from Lα phase to HII phase when their CerC16 content was less than 10 mol% whereas a Lβ phase coexisting with the HII phase was observed when the CerC16 content