The value of pretreatment cell kinetic parameters as predictors for
radiotherapy outcome in head and neck cancer: a multicenter analysis
Adrian C. Begg
a,*, Karin Haustermans
a, August A.M. Hart
b, Stan Dische
c, Michele Saunders
c,
Bjorn Zackrisson
d, Hans Gustaffson
d, Philippe Coucke
e, Nicolas Paschoud
e, Morten Hoyer
f,
Jens Overgaard
f, Paolo Antognoni
g, Antonella Richetti
g, Jean Bourhis
h, Harry Bartelink
a,
Jean-Claude Horiot
i, Renzo Corvo
j, Walter Giaretti
j, Hassan Awwad
k,
Tarek Shouman
k, Thomas Jouffroy
l, Zo®a Maciorowski
m, Werner Dobrowsky
n,
Henk Struikmans
o, Derk Rutgers
o, George D. Wilson
paDivision of Experimental Therapy, Department of Radiotherapy, The Netherlands Cancer Institute, Plesmanlaan 121, 1066 CX Amsterdam, The Netherlands bDepartment of Radiotherapy, The Netherlands Cancer Institute, Plesmanlaan 121, 1066 CX Amsterdam, The Netherlands
cMarie Curie Research Wing for Oncology, Mount Vernon Centre for Cancer Treatment, Rickmansworth Road, Northwood, Middlesex HA6 2RN, UK dDepartment of Oncology, Umea University, S901 85 Umea, Sweden
eDepartment of Radiation Oncology, Centre Hospitalier Univ. Vaudois, CH1101 Lausanne, Switzerland
fThe Danish Cancer Society, Department of Clinical Oncology, Institute of Cancer Research Radium Stationen, Norrebrogade 44, DK8000 AarhusC, Denmark gDivisione di Radioterapia, Ospedale di Circolo, L. Borri 57, 21100 Varese, Italy
hDepartment of Radiotherapy, Institut Gustave Roussy, 39 rue Camille Desmoulins, Villejuif Cedex, F94805, France
iService de Radiotherapie, Centre de Lutte Contre le Cancer Georges-Francois Leclerc, Rue du Professeur Marion, 21034 DIJON Cedex, France jDepartment of Radiotherapy, National Institute for Cancer Research, V.le Benedetto XV, 10, 16132 Genoa, Italy
kDepartment of Radiotherapy, National Cancer Institute, Kasr El Aini Street, Fom El Khalig, Cairo, Egypt lDepartments of Surgery and of Oncology/Radiotherapy, Institut Curie, 26 rue d'Ulm, 75248 Paris Cedex 05, France
mCytopathologie, Institut Curie, 26 rue D'Ulm, 75248 Paris Cedex 05, France
nDepartment of Radiotherapy and Radiobiology, Algemeines Krankenhaus der Stadt Wien, Waeringer Guertel 18-20, A-1090 Vienna, Austria oAfdeling Radiotherapie, AZU, Heidelberglaan 100, 3584 CX Utrecht, The Netherlands
pGray Laboratory Research Trust, PO Box 100, Mount Vernon Hospital, Northwood, Middlesex, HA6 2JR, UK
Received 26 June 1998; received in revised form 8 December 1998; accepted 16 December 1998
Abstract
Purpose: The aim of this study was to assess the potential of pre-treatment cell kinetic parameters to predict outcome in head and neck cancer patients treated by conventional radiotherapy.
Materials and methods: Data from 11 different centers were pooled. Inclusion criteria were such that the patients received radiotherapy alone, and that the radiotherapy was given in an overall time of at least 6 weeks with a dose of at least 60 Gy. All patients received a tracer dose of either iododeoxyuridine (IdUrd) or bromodeoxyuridine (BrdUrd) intravenously prior to treatment and a tumor biopsy was taken several hours later. The cell kinetic parameters labeling index (LI), DNA synthesis time (Ts) and potential doubling time (Tpot) were subsequently calculated from ¯ow cytometry data, obtained on the biopsies using antibodies against I/BrdUrd incorporated into DNA. Each center carried out their own ¯ow cytometry analysis.
Results: From the 11 centers, a total of 476 patients conforming to the inclusion criteria were analyzed. Median values for overall time and total dose were 49 days and 69 Gy, respectively. Fifty one percent of patients had local recurrences and 53% patients had died, the majority from their disease. Median follow-up was 20 months; being 30 months for surviving patients. Multivariate analysis revealed that T-stage, maximum tumor diameter, differentiation grade, N-stage, tumor localization and overall time correlated with locoregional control, in decreasing order of signi®cance. For the cell kinetic parameters, univariate analysis showed that only LI was signi®cantly associated with local control (P 0:02), with higher values correlating with a worse outcome. Ts showed some evidence that patients with longer values did worse, but this was not signi®cant (P 0:06). Tpot showed no trend (P 0:8). When assessing survival in a univariate analysis, neither LI nor Tpot associated with outcome (P 0:4, 0.4, respectively). Surprisingly, Ts did correlate with survival, with longer values being worse (P 0:02). In the multivariate analysis of local control, LI lost its signi®cance (P 0:16).
0167-8140/99/$ - see front matter q 1999 Elsevier Science Ireland Ltd. All rights reserved. PII: S0167-8140(98)00147-9
Conclusions: The only pretreatment kinetic parameter for which some evidence was found for an association with local control (the best end-point for testing the present hypothesis) was LI, not Tpot, and this evidence disappeared in a multivariate analysis. It therefore appears that pretreatment cell kinetic measurements carried out using ¯ow cytometry, only provide a relatively weak predictor of outcome after radiotherapy in head and neck cancer. q 1999 Elsevier Science Ireland Ltd. All rights reserved.
Keywords: Cell kinetic parameters; Head and neck cancer; DNA synthesis time; Potential doubling time
1. Introduction
The analysis of causes of radiation failure in retrospective series of patients with head and neck cancer and cervix cancer, suggests a loss of local control as the overall treat-ment time increases for the same total dose [1,4,22,33, 45,53]. This is attributed to tumor cell proliferation during fractionated radiotherapy. As longer treatment times lead to loss of local control, it has been suggested that shorter treat-ment times could lead to an increase in local control. For this reason, accelerated treatment regimens have and are being designed [28,30,32,35,38,41]. However, these treat-ments cause severe acute reactions. Due to this, lower total doses are sometimes given. Slowly proliferating tumors may therefore do worse when treated with accelerated sche-dules compared with conventional schesche-dules. In addition, it is not desirable to subject all patients to the intense acute reactions of the accelerated schedules. It would thus be useful to predict which tumors could show rapid prolifera-tion during treatment and would be likely to bene®t from accelerated radiotherapy.
The median potential doubling times (Tpot), determined in tumors before treatment, seem to be similar to the average values of effective doubling times (Teff) which actually take place during treatment as a response to therapy-induced cell depletion. The cell birth rate and therefore, the potential doubling time (Tpot), can be calculated knowing the label-ing index (LI; proportion cells incorporatlabel-ing the DNA precursor) and Ts (the DNA synthesis time). Tpot is de®ned as the time within which the cell population of a tumor would double if there were no cell loss [42]. The hypothesis is thus that Tpot measured before treatment may correlate with Teff during treatment.
With the development of antibodies to DNA-incorporated thymidine analogues iodo- and bromo-deoxyuridine, ¯ow cytometry could be used to more rapidly and more quanti-tatively assess proliferation [15,16,23]. An added advantage is that these methods could be applied after in vivo labeling of the patient with the analogue, avoiding potential in vitro artifacts. Several studies have employed such methods to assess the predictive value of pre-treatment cell kinetic parameters after radiotherapy [2,3,5,6,11,14,31,34,43, 47,54]. Results have been variable, some showing positive association with outcome [3,5,14,47,54], and some not [11,18,31,34,43]. Almost all the studies have included rela-tively few patients, limiting their power.
The aim of the present study was to combine the data from many of these trials, in order to better assess the
value of cell kinetic measurements by increasing the statis-tical power of the analysis. The majority of reported studies had been carried out in head and neck cancer and many for radiotherapy alone. This paper reports on the pooled cell kinetic data of head and neck cancer patients treated with conventional radiotherapy from 11 centers in Europe (one Egyptian trial was included although the measurements were carried out in The Netherlands).
2. Materials and methods
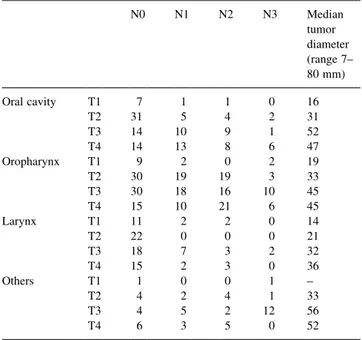
Data on a total of 476 patients from 11 centers were initially submitted for this analysis (Table 1). Inclusion criteria were, no neoadjuvant chemotherapy, overall treat-ment time longer than 39 days, total dose at least 60 Gy, and the interval between IdUrd injection and biopsy at least 4 h. The latter were excluded on the grounds that Ts would probably be underestimated using the RM analysis origin-ally proposed by Begg et al. [7]. All patients were primarily irradiated for squamous cell carcinomas of the head and neck with treatment schedules lasting at least 6 weeks (39 days). Median age was 59 years and sex ratio (male/female) was 8:2. For subsequent analysis, primary tumors were clas-si®ed into four groups: oral cavity (n 128), oropharynx (n 211), larynx (n 86) and others (n 50). Other tumors were nasopharynx, parotid, lip, hypopharnyx poster-ior wall, piriform sinus, postcricoid area and unspeci®ed. The tumor characteristics are summarized in Table 2. Most patients had an advanced stage (T3, T4 and/or N2, N3 tumors) at diagnosis (n 330). The majority, i.e. 343 tumors (80%), were well to moderately differentiated. Infor-mation on tumor size was available in 236 patients. The median diameter of the primary tumor was 40 mm (range: 7±80 mm).
Before the start of radiotherapy, iododeoxyuridine (IdUrd) or bromodeoxyuridine (BrdUrd) in a tracer dose was injected intravenously and a biopsy from the primary tumor was taken several hours later. Biopsies were ®xed in ethanol, subsequently digested, stained for IdUrd/BrdUrd uptake and DNA content and the suspensions acquired on the ¯ow cytometer according to standard procedures. Measurements were done in 9 laboratories. There was no single center serving as a reference laboratory for quality control and measurement checks.
The DNA index of the tumor was calculated by measur-ing the position of the tumor G1 peak relative to the diploid G0/G1 peak. To determine the length of the S-phase (Ts),
the simple relative movement method (RM) based on the average position of the labeled cells between G1 and G2 was used [7]. Brie¯y, the analysis was done by placing compu-ter-drawn windows around the different populations and assuming that the RM was 0.5 at time 0. The mean red ¯uorescence (DNA content) of the labeled cells relative to the red ¯uorescence values for G1 and G2 was ®rst deter-mined. Ts could then be calculated knowing the time between IdUrd administration and taking the specimen, t.
The two equations used for calculating Ts were: (1): RM (FL 2 FG1)/(FG2 2 FG1) and (2): Ts 0.5 t /(RM 2 0.5); where FL is the mean red ¯uorescence of IdUrd/ BrdUrd labeled cells and FG1, FG2 are the mean red ¯uor-escence positions of the G1 and G2 cells, respectively. The labeling index (LI) was determined as the percentage of green labeled cells (B/IdUrd content), after correcting for the labeled cells which had divided. The potential doubling time (Tpot) was calculated as the ratio Ts / LI, assuming that the age distribution factor, lambda, was unity [42]. No qual-ity control procedures, i.e. retrospective check of ¯ow cyto-metry dot plots, were carried out in the present study. As an
indirect measure of quality, the CV of the ®rst tumor popu-lation and the presence of a separate G1 peak were requested on the forms.
Two separate forms were sent to the participating centers. On the ®rst form, data on patient characteristics (initials, center, age, sex), tumor characteristics (TNM, histology and maximum tumor diameter), radiotherapy speci®cations (dose, fraction size, number of fractions per day, reasons for interruptions, overall treatment time), cell kinetics (time between injection of B/IdUrd and biopsy, Ts, LI and Tpot) and limited follow up information (local control, distant metastasis, date of last follow up, death) were requested. On an additional form, more detailed information on treatment and follow up (complete remission in treat-ment ®eld, addition of neoadjuvant chemotherapy and salvage surgery) as well as more information on the quality of the ¯ow cytometry data (CV of the ®rst tumor population and presence of a separate tumor G1 population) were requested.
Patients were irradiated to a total dose of 60±88 Gy in fractions of 1.1 (one patient) to 3 Gy (one patient) per fraction, although the vast majority of the patients were treated with 2 Gy fractions (499, 86.3%). To study the in¯u-ence of dose on outcome, the normalized total dose para-meter was used, which corrects for fractionation size employing the linear-quadratic formalism using an alpha/ beta ratio of 10 Gy, according to the equation:
NTD D 1 1 d=10 =1:2 1
where D is the total dose of the fractionation schedule and d is the dose per fraction. This equation calculates the dose equivalent of a schedule in 2 Gy fractions.
Table 1
Participants in the study
Centera Kinetic
measurement laboratory
Participants
UmeaÊ University,
UmeaÈ, Sweden NorthwoodUmeaÊ B. ZackrissonH. Gustafsson R. Stenling Centre Hospitalier Univ.
Ladois, Lausanne, Switzerland (data management for trial NCI T92-005) Northwood BesancËon Lausanne P. Coucke N. Paschoud
Danish Cancer Society,
Aarhus, Denmark Aarhus M. HoyerJ. Overgaard North Italian Study Group,
Varese, Italy Pavia P. AntognoniA. Richetti M. Bignardi G. Rampello L.F. Cazzaniga M. Danova Institut Gustave Roussy,
Villejuif, France NorthwoodIGR J. Bourhis EORTC (trial 22851) Amsterdam J.C. Horiot
H. Bartelink National Institute for Cancer
Research, Genoa, Italy Genoa R. CorvoW. Giaretti NCI, Cairo, Egypt Amsterdam H. Awwad
T. Shouman Institut Curie, Paris, France Paris IC Z. Maciorowski
T. Jouffroy Algemeines Krankenhaus der
Stadt Wien, Vienna, Austria Northwood W. Dobrowski AZU, Utrecht, The Netherlands Utrecht H. Struikmans
D. Rutgers
1Some centers carried out individual studies, while others coordinated
multicenter trials (Cairo, EORTC, Lausanne, Varese).
Table 2 Tumor characteristics N0 N1 N2 N3 Median tumor diameter (range 7± 80 mm) Oral cavity T1 7 1 1 0 16 T2 31 5 4 2 31 T3 14 10 9 1 52 T4 14 13 8 6 47 Oropharynx T1 9 2 0 2 19 T2 30 19 19 3 33 T3 30 18 16 10 45 T4 15 10 21 6 45 Larynx T1 11 2 2 0 14 T2 22 0 0 0 21 T3 18 7 3 2 32 T4 15 2 3 0 36 Others T1 1 0 0 1 ± T2 4 2 4 1 33 T3 4 5 2 12 56 T4 6 3 5 0 52
The overall treatment time varied between 6 and 11 weeks. Ninety patients had signi®cant interruptions (6±27 days) due to acute toxicity.
Local failure was de®ned as either (a) progression in the irradiated area or (b) the presence of viable tumor cells in the specimen from salvage surgery or (c) death due to tumor without registered complete remission and without the presence of tumor outside the irradiated volume. Time of local failure was measured from the start of radiotherapy until time of progression (a), salvage surgery (b) or start of radiotherapy (c). All patients without local failure were censored at the last date of follow-up.
Information on salvage surgery was available in 299 cases; 51 patients (17%) underwent salvage surgery after radiotherapy. Information on the resection specimen was recorded and in 12 of these no viable tumor was present. For subsequent analyses, these patients were regarded as locally controlled by radiotherapy.
2.1. Statistical methods
A stepwise procedure using Proportional Hazard regres-sion analysis was used to identify prognostic factors with respect to local failure. In the ®rst stage, only patient and tumor characteristics (excluding LI, Ts and Tpot) were considered for inclusion. In the second stage treatment factors (including center) were added and ®nally the prog-nostic value of LI, Ts and Tpot was tested, after controlling for the confounding variables resulting from the ®rst two stages. The upper limit for the P-value in order to be included as a confounding variable was 0.15.
In all analyses, interval and ordinal variables were considered to be linearly related to log(hazard). However, linearity of each variable was tested at each step and if non-linearity was present the P-value of linear plus non-linear effects was used to decide on inclusion or not.
For variables with missing values, a dummy variable was created. The missing values themselves were replaced by a ®xed value within the range of the original variable. When-ever the modi®ed variable was included in the model, the proportional hazard-analysis was strati®ed according to this missing value indicator.
At each step, the assumption of proportional hazards was tested by plotting the weighted Schoenfeld residuals against time. Log-cumulative hazard plots were also made, adjusted for the other variables as covariates in the model. If these plots suggested a deviation from the proportionality assumption, this was investigated further by ®tting a time-dependent model, using a linear variable ln(time) interac-tion.
These checks were always performed for new variables to be entered in the model. If this was judged to be a major prognostic variable, the same was done for the variables already in the model. If these checks shed doubt about the proportionality assumption, then in the next steps, these variables were used as strati®cation variables rather than
as covariates. Only when testing the variables themselves they were used as covariates.
As marked differences between centers existed regarding the distribution of the cell kinetic parameters (ANOVA: LI P , 0:01, Ts P , 0:01 and Tpot P , 0:01), these para-meters were analyzed by strati®cation per center (Table 3). In a second step, as the difference in variance between centers for LI and Tpot (P , 0:001) was statistically signif-icant, these parameters were also standardized using center-speci®c mean and SD values. The standardized parameters then have a mean of 0 and an SD of 1 within each center. These standardized values were subsequently used in a second multivariate analysis.
All P-values were calculated from the proportional hazard based Wald statistic. P-values were adjusted for multiple comparisons only where explicitly stated. In those cases, this was done using the procedure of Hommel. Lifetable calculations were done using the product limit method of Kaplan and Meier.
3. Results
3.1. Proliferation characteristics
The ¯ow cytometry parameters are summarized in Table 4. One hundred and ninety-four tumors (46.9%) were diploid and 220 were aneuploid (53.1%); in 62 cases infor-mation on ploidy was missing. The median DNA index was 1.38 (range 0.85±2.9). The present data con®rm that head and neck tumors are a relatively rapidly proliferating group of tumors with a median Tpot of 5.1 days (range 0.8±72.9 days). The median Tpot for the diploid tumors was 6.3 days, and for the aneuploid tumors, it was 4.1 days. The median LI was 8.85% (range 0.6±47.7%), the median for the diploid tumors being 6% while it was 12.7% for the aneuploid tumors. The median Ts was 10.7 h (range 4.4±45.7 h), and was longer in the aneuploid subgroup (12.4 h) compared with the diploid subgroup (10.0 h). The more rapid apparent proliferation rate of aneuploid tumors is probably an artifact related to the
abil-Table 3
Cell kinetic parameters per center
Center N LI (%) Ts (h) Tpot (days) 1 45 8.6(2.1±28.0) 9.8 (6.0±30.0) 4.9 (2.1±20.8) 2 59 12.6 (2.2±22.1) 11.5 (6.3±33.2) 4.6 (1.44±14.5) 3 72 8.7 (2.6±29.9) 12.2 (7.0±39.1) 6.0 (1.7±29.2) 4 61 9.7 (0.8±24.0) 15.4 (7.7±25.9) 5.6 (1.4±70.4) 5 64 7.1 (0.8±47.7) 8.4 (4.4±21.0) 4.6 (0.8±72.9) 6 31 7.0 (1.8±38.1) 9.7 (6.1±45.7) 5.0 (1.8±19.0) 7 62 6.6 (0.6±23.8) 8.3 (5.3±23.8) 4.7 (1.2±44.4) 8 32 8.0 (1.0±12.4) 15.0 (7.5±21.0) 7.4 (5.2±17.5) 9 16 10.9 (1.4±17.1) 6.6 (4.6±14.2) 3.0 (1.6±22.5) 10 15 16.3 (7.0±39.7) 11.3 (7.6±16.3) 3.1 (0.9±5.0) 11 19 13.9 (2.8±26.2) 11.4 (5.5±20.7) 4.7 (1.4±18.1)
ity to distinguish normal and malignant cells (see Section 4). There was a statistically signi®cant difference in cell kinetic parameters between the different centers (ANOVA, P , 0:001 for the three cell kinetic parameters: LI, Ts and Tpot).
We also analyzed whether there was an association between the cell kinetic parameters, primary tumor site and differentiation grade. Site categories were oral cavity, oropharynx, larynx and `others'. No signi®cant differences were found for these site categories for LI (P 0:27), Ts (P 0:57) or Tpot (P 0:10). For differentiation grade, LI showed the biggest differences between categories, but not in a linear manner: mean LI values were 8.1% (`well'), 9.0% (`moderate') and 7.4% (`poor'), giving a non-signi®cant for the association (P 0:081). Ts and Tpot showed no signif-icant trends with grade (P-values 0.58 and 0.16, respec-tively).
In 319 tumors information on the CV of the ®rst tumor peak was available. The CV varied between 1.6 and 15.1% with a median CV of 5%. In 289 (89%) of the 319 tumors in which this information was recorded, a separate labeled population at the G1 position was present, indicating that the I/BrdUrd-injection time was longer than TG2M, increas-ing the accuracy of Ts estimations.
3.2. Locoregional control and survival
A complete regression after radiotherapy was observed in 244 of the 413 patients on whom this information was registered. Fifty one percent of the patients (n 240) failed locally, and 11% (n 52) suffered from distant metastases. The median follow up for the whole group was 20 months. Two hundred and ®fty patients died after a median follow up of 12 months, 80% of them of their disease. At 60 months, the locoregional control after
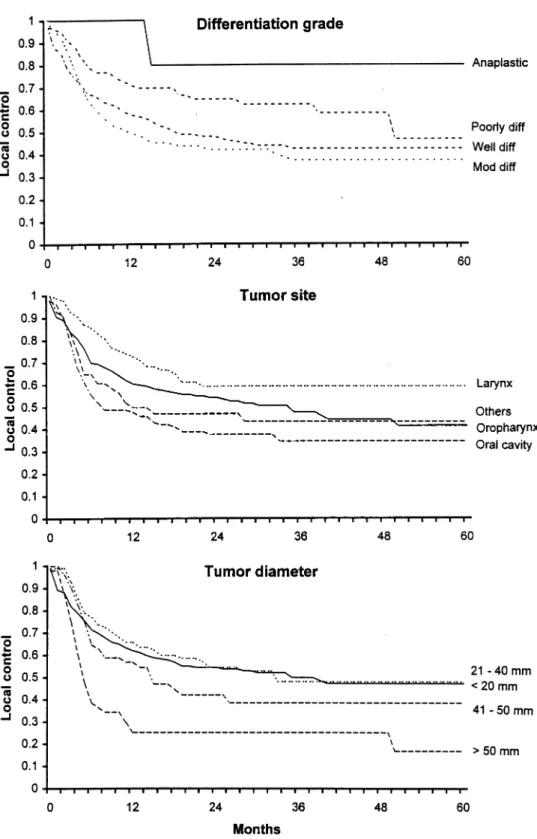
radio-therapy was 41.4% (SE 2.4%). The more advanced the primary tumor, the worse local control (P , 0:0001). N-stage also predicted for local control (P 0:0019). Anaplastic and poorly differentiated tumors had a signi®-cantly better local control than moderately and well-differ-entiated tumors (P 0:042) (Fig. 1). Fig. 1 shows locoregional control as a function of site of the primary tumor. Larynx tumors showed a signi®cantly better local control than oropharynx and oral cavity tumors (P , 0:0001). Tumor size was also signi®cantly associated with local control, small tumors doing much better than large tumors (P 0:0005, Fig. 1).
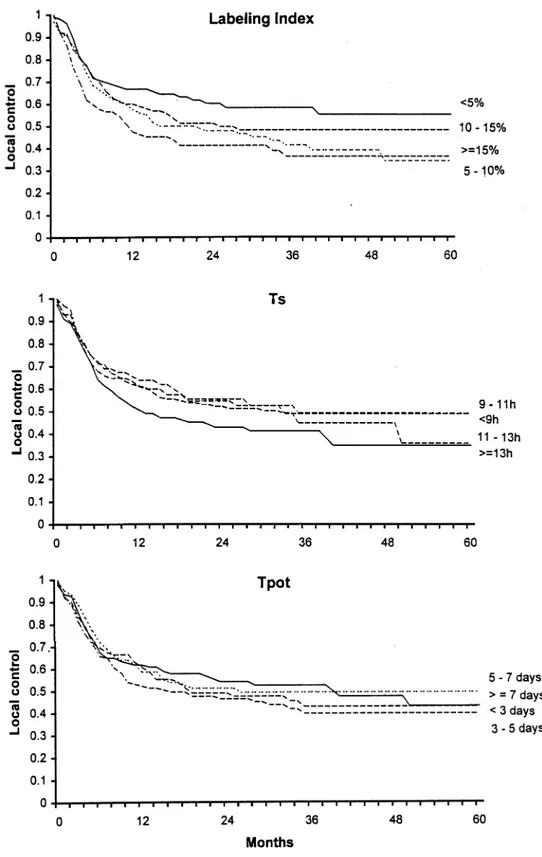
Locoregional control was not found to be in¯uenced by ploidy (P 0:31). For representation in the ®gures, cell kinetic parameters (Tpot, LI and Ts) were divided into quartiles. For the statistical analysis, however, the cell kinetic parameters were analyzed as continuous variables. LI was signi®cantly associated with local control (P 0:033), with tumors having a low LI ( , 5%) doing signi®cantly better than tumors with a high LI ( . 15%) (Fig. 2). Tpot was not signi®cantly associated with locor-egional control (P 0:8, Fig. 2) and there was some evidence for tumors with a short Ts having a better locor-egional control (P 0:057, Fig. 2).
We also attempted to de®ne an `excellent' group from the kinetic point of view. This included tumors which were aneuploid, had good DNA histograms (de®ned as CVs of the tumor G1 peak # 8%), a LI $ 1.5% and a Ts # 30 h. This excluded measurements with very low labeling, since both LI and Ts estimations would be unreliable. In this `excellent' group of 134 patients, P-values for local control in the univariate analysis were no more signi®cant than for the whole patient group: 0.19 for LI, 0.38 for Ts and 0.51 for Tpot.
Overall survival at 60 months was 33.4% (SE 3.1%).
Table 4
Cell kinetic parameters
Ploidy N LI (%)a Ts (h)a Tpot (days)a
Aneuploid 220 12.7 (1.2±39.7) 12.4 (5.6±45.7) 4.1 (0.9±72.9) Diploid 194 6.0 (0.8±47.7) 10.0 (4.4±21.6) 6.3 (0.8±70.4) Site Oral cavity 128 8.4 (0.8±28.0) 10.3 (5.5±39.1) 5.1 (1.3±72.9) Oropharynx 211 8.5 (0.6±39.7) 10.9 (4.4±45.7) 5.6 (1.2±44.4) Larynx 87 10.5 (0.8±47.7) 11.0 (4.6±25.9) 4.1 (0.8±70.4) Others 50 10.3 (1.8±34.8) 10.8 (5.6±22.6) 4.7 (0.9±22.5) T-stage T1 39 9.5 (1.4±47.7) 9.8 (4.6±32.1) 6.4 (0.8±22.5) T2 146 9.6 (0.8±25.8) 11.5 (5.3±33.2) 6.7 (1.3±70.4) T3 162 10.4 (0.6±38.1) 12.5 (5.5±45.7) 6.6 (1.4±44.4) T4 129 10.7 (0.8±39.7) 11.9 (4.4±39.1) 6.9 (0.9±72.9) Grade Well diff. 222 9.9 (0.6±39.7) 11.7 (6.0±25.9) 6.4 (0.9±44.4) Mod. diff. 168 10.8 (0.8±47.7) 11.8 (5.3±39.1) 6.7 (0.8±72.9) Poorly diff./anapl. 86 9.6 (0.8±38.1) 12.2 (4.4±45.7) 7.8 (1.4±70.4)
Overall survival was signi®cantly associated with T stage
(P , 0:0001), N stage (P , 0:0001), site of the primary tumor (P 0:0071) and tumor size (P 0:0002), but notwith differentiation grade (P 0:34).
Fig. 1. Local control as a function of differentiation grade (upper), site of primary (middle) and maximum tumor diameter (lower). All three parameters showed signi®cant differences in a univariate analysis as assessed by log rank trend. The data show that anaplastic tumors do better than well differentiated tumors (best vs. worst), larynx does better than oral cavity, and larger tumors do worse. Number of events/total numbers per group for grade were: 88/175 well, 94/167 moderate, 29/79 poor, 1/7 anaplastic. For site: 76/128 oral cavity, 99/211 oropharynx, 30/86 larynx, 26/50 others. For diameter: 8=34 , 20 mm, 44/98 21±40 mm, 29/51 41±50 mm, 36=48 . 50 mm.
Overall survival was not in¯uenced by either LI
(P 0:42) or Tpot (P 0:43). Unexpectedly, a short Ts was signi®cantly associated with a better overall survival(P 0:016).
Fig. 2. The in¯uence of the three cell kinetic parameters on local control: LI (upper), Ts (middle), Tpot (lower). Only LI showed a statistically signi®cant association with local control in a univariate analysis, with low LI tumors associated with a more favorable outcome. Number of events/total numbers per group for labeling index were: 41=104 , 5%, 80/159 5±10%, 54/116 10±15%, 56=96 $ 15%. For Ts: 71=147 , 9 h, 44/101 9±11 h, 32/71 11±13 h, 84=156 $ 13 h. For Tpot: 51=100 , 3 days, 70/132 3±5 days, 49/106 5±7 days, 61=137 $ 7 days.
3.3. Multivariate analysis
In a multivariate analysis, the in¯uence on locoregional control of age, sex, localization of the primary tumor, T-stage, N-T-stage, maximum tumor diameter, differentiation grade, ploidy, center, overall treatment time, NTD (normal-ized total dose; fractionation schedule correction calculated
using anda/bvalue of 10 Gy), LI, Ts and Tpot were tested.
Only differentiation grade (P , 0:0001), maximum tumor
diameter (P 0:0004), T stage (P 0:0007), localization of the primary tumor (P 0:005), overall treatment time (P 0:04) and N-stage (P 0:02) satis®ed our inclusion criterion (P , 0:15), (Table 5). After controlling for these factors, none of the cell kinetic parameters (LI, Ts or Tpot) were found to be independent predictors of local failure (Table 6).
Since signi®cant differences were found between the centers, not only in mean cell kinetic values, but also in their variance (Table 3, and see Section 2), a second multi-variate analysis was carried out with strati®cation per center. However, this lead to the same conclusions as with non-strati®ed data, with P-values of 0.26 for LI, 0.45 for Ts and 0.67 for Tpot (Table 6). The signi®cant differences in variance of the parameters justi®ed a procedure in which the multivariate analysis was performed with the standardized values for LI, Ts and Tpot, in which parameter values are expressed as number of standard deviations away from the mean for each center. With this analysis, Ts turned out to be the most signi®cant cell kinetic parameter for predicting local control after conventional radiotherapy, although borderline (Table 6).
4. Discussion
The question of interest here, was whether repopulation rates during radiotherapy could be predicted before the start of therapy, using ¯ow cytometry and in vivo labeling with thymidine analogs. The underlying assumption is that rapid repopulation during radiotherapy can limit cure. Values for effective repopulation doubling times (Teff) during the latter part of radiotherapy in head and neck tumors, calculated from retrospective clinical data, are of the order of 4±5 days [20,21,53]. These are in good agree-ment with Tpot values measured in other series [2,6,11,14,31,34,44,48,49,54], leading to the hypothesis that Tpot may indeed be a predictor of Teff [19], and was the stimulus for carrying out several of the studies contribut-ing to the present analysis. The combined results of 11 studies presented here, however, do not support this hypoth-esis.
This multicenter analysis does not support the idea that the potential doubling time, Tpot, can predict repopulation during radiotherapy. However, one cannot conclude from these data that proliferation or repopulation are not impor-tant in determining outcome. Retrospective analyses of head and neck tumor data show that longer overall times require the use of higher doses to achieve the same level of local control [1,21,45,53]. These data are subject to bias [10,17] and should be interpreted with some caution. However, more recent data from randomized trials of accelerated tionation [29,41], DAHANCA study of six versus ®ve frac-tions per week [37]; Polish study of seven versus ®ve fractions per week [36], all support this idea by clearly showing the value of shortening the overall treatment
Table 5
Hazard ratio's for the multivariate analysis of local control Variable Category/units Hazard
ratio 95%Con®dence interval Patient/tumor
Age Per 10 years 0.99 0.88±1.10
Sex Male 1
Female 0.84 0.60±1.18 Tumor site Oral cavity 1
Oropharynx 0.57 0.41±0.78 Larynx 0.59 0.38±0.93 Other 0.68 0.42±1.11 T-stage Per stage 1.34 1.13±1.57 N-stage Per stage 1.17 1.02±1.34 Max. diameter Per cm 1.31 1.13±1.51
Grade Well 1 Moderately 1.21 0.87±1.68 Poorly/anaplastic 0.51 0.33±0.80 Ploidy Diploid 1 Aneuploid 1.10 0.83±1.46 Treatment Center Genova 1 EORTC 1.80 0.81±3.98 Lausanne 1.55 0.79±3.03 Aarhus 1.41 0.76±2.61 Umea 1.32 0.76±2.31 Cairo 1.03 0.51±2.08 G. Roussy 1.55 0.66±3.66 Varese 1.67 0.70±4.00 Utrecht 1.11 0.33±3.72 Curie 1.91 0.77±4.72 Vienna 0.99 0.48±2.04 Overall time Per week 1.17 1.01±1.36 Dose Per 10 gray 1.23 0.74±2.03 Cell kinetics
LI Per 10 percent 1.16 0.95±1.41 Ts Per 10 h 1.09 0.86±1.38 Tpot Per 10 days 0.96 0.77±1.20
Table 6
P-values for cell kinetic parameters for strati®ed and standardized data against local control
Strati®ed per center Standardized per center
LI 0.26 0.63
Ts 0.45 0.045
time, even at the expense of reducing the total dose [41]. These results strongly suggest, although do not prove, that repopulation is an important factor determining outcome.
There are several problems with pooling data as we have done here. There can be marked differences between centers in the distribution of tumor and patient characteristics (such as tumor site, grade and stage), treatment policies, radiother-apy procedures and ¯ow cytometry procedures. Signi®cant differences in average values and variances for the cell kinetic parameters between centers were indeed found. For this reason, we also analyzed the data by treating the center as a confounding variable, leading to both strati®ed and stan-dardized analyses. This did not alter the basic conclusions that none of the cell kinetic parameters was a strong predic-tor, although it reversed the relative importance of Ts and LI (in favor of Ts). Taking into account that nine P-values were calculated for the kinetic parameters in the multivariate analyses, the P-value of 0.045 should not be taken as evidence for a prognostic value of Ts. It should also be noted that the patient group as a whole for this study was fairly typical for head and neck tumor patients submitted for radiotherapy: the majority were male, most tumors were advanced, the majority were oropharynx tumors, followed by oral cavity and larynx. The overall locoregional control and survival results were also consistent with published studies. In addition, the multivariate analysis of this group con®rmed T-stage, tumor diameter, differentiation grade and localization of the primary tumor as signi®cant and strong prognostic indicators. Any lack of association with outcome is therefore, unlikely to be due to an unusual distri-bution of patients.
The ¯ow cytometry data are also consistent with previously published data [2,3,5,9,11,14,18,31,34,43,44, 48,49,54]. Just over half the patients were reported as having aneuploid tumors, and the aneuploid tumors had faster kinetics (higher LI, shorter Tpot) than the diploid tumors, as reported in other studies [5,8,9,11,14,31,34, 47,49,54]. The latter is probably due to being able to partially distinguish tumor and normal cells on the basis of their DNA content, which is not possible in diploid tumors. The slower observed kinetics in diploid tumors is then likely to be artifactual, due to the inclusion of slowly or non-proliferating stromal cells. We therefore also analyzed the aneuploid tumors only, and included two quality control criteria for the ¯ow cytometry: good labeling and reliable DNA histograms. However, this did not increase the signif-icance of the relationship with outcome for either LI or Tpot. Some centers advocate measuring Tpot by combining Ts measured ¯ow cytometrically with LI measured im-munohistochemically (IHC) [9,31], or adding a tumor-associated marker, such as cytokeratin to ¯ow cytometri-cally distinguish malignant and stromal cells [26]. The IHC approach also avoids the contaminating stroma problem, since only tumor cells, recognized morphologi-cally, are counted. These modi®cations were not possible with the present analysis, however, since the majority of
centers only carried out two-color ¯ow cytometry measure-ments. Such an approach would make the kinetic estimates more reliable for diploid tumors, although values for aneu-ploid tumors are unlikely to change substantially [9,31]. Since the aneuploid-only analysis did not improve associa-tions with outcome, there remains doubt as to whether a combined ¯ow/immunohistochemistry or cytokeratin-type approach would improve these predictors.
The reason why Tpot fails as a predictor of repopulation in a univariate analysis whereas LI (partially) succeeds is not clear. It indicates that combining Ts with LI destroys the association with outcome. This could occur if high LI values were signi®cantly associated with long Ts values, leaving Tpot relatively unchanged. In the present data set, Ts was signi®cantly correlated with LI (r 0:24, P , 0:001). This correlation may have partially contribu-ted to the poor performance of Tpot. One possible expla-nation is technical, i.e. in setting windows around the labeled cell population in the ¯ow cytometry data, too high a window would reduce the LI and at the same time reduce the estimated Ts, due to the shape of the labeled cloud of cells in the cytogram [25]. A second trivial expla-nation, is that the longer the S phase the more cells will be in S, i.e. giving a higher LI. This assumes, however, that the growth fraction, also a determinant of LI, does not vary markedly between tumors. A third possible explanation for the different performances of LI and Tpot as predictors, is that LI and Ts are totally independent predictors of outcome (high LI bad, long Ts bad) for different reasons. For example, a high LI may re¯ect fast repopulation and a long Ts may be correlated with radioresistance. Cells are often the most radioresistant in late S, and so a longer S phase may be coupled with a greater fraction of cells in a relatively resistant phase. These are simply speculations, however. It is noteworthy that Ts was the only parameter that was associated with overall survival (long Ts, worse survival). LI, which was signi®cantly associated with local control, lost its signi®cance for survival whereas Ts did not, suggesting that Ts may indicate something other than simple cell kinetic behavior. An alternative explana-tion, which cannot be excluded without further studies, is that this is simply a chance occurrence.
The lack of local control prediction by Tpot is at odds with some of the individual studies, which have contributed to this analysis. The study of Corvo et al. [13,14] showed a signi®cant association of Tpot with local control, as did early reports of EORTC trial 22851 [5] and the Gustave Roussy trial [12]. The latter lost its signi®cance with longer follow-up, however, as did the EORTC trial. This could not be fully explained by insuf®cient follow-up in earlier reports, such that long Tpot tumors had yet to recur (Begg et al., in preparation). The reason for a progressive loss of signi®cance with longer follow-up, and the addition of more patients to the studies is therefore not clear. The median follow-up for patients in the pooled material presented here was 20 months, and almost 30 months for surviving
patients, which should be long enough to assess the value of these predictors with reasonable certainty.
The problems and potential artifacts associated with pool-ing data from different centers should not be underestimated [46]. At least three reports in the literature indicate that comparing absolute values of kinetic parameters between two laboratories, even when analyzing identical material, is a hazardous procedure leading to signi®cant inter-labora-tory differences [25,50,51]. Ts appears to be particularly prone to inter-laboratory and inter-observer variability. In the present study, nine different measurement centers contributed data. Ideally, one center should receive and measure all material, eliminating inter-laboratory bias, but this was impossible here since it is a retrospective analysis. An additional factor inherent in all such biopsy-based analyses, is intra-tumoral heterogeneity, which limits the accuracy of all kinetic estimates [8,24,27,39,40,52]. These considerations should encourage caution in interpretation of the results, and it is possible that the non-signi®cance of the kinetic parameters as predictors could be due in part to inter-laboratory variation.
In conclusion, the data from this multicenter analysis do not support the use of Tpot as a predictor of outcome after radiotherapy, although inter-laboratory variation may have contributed to the lack of signi®cance. Using non-standar-dized data, a high LI was weakly associated with worse local control in univariate analysis and a long Ts was asso-ciated with worse overall survival. Clinical data strongly suggest that long overall treatment times are detrimental to cure, and so, if this is indeed due to repopulation, better, more robust predictors of repopulation need to be found, or more accurate and reproducible ways to measure the current predictors. In addition, repopulation rate is only one of many factors contributing to outcome after radiotherapy and so any cell kinetic parameter should ideally be combined with other biological and clinical parameters, in order to provide an accurate prediction to guide the radio-therapist how to optimize treatment for the individual. References
[1] Amdur RJ, Parsons JT, Mendenhall WM, Million RR, Cassisi NJ. Split-course versus continuous-course irradiation in the postoperative setting for squamous cell carcinoma of the head and neck. Int. J. Radiat. Oncol. Biol. Phys. 1989;17:279±285.
[2] Antognoni P, Bignardi M, Cazzaniga LF, et al. Accelerated radiation therapy for locally advanced squamous cell carcinomas of the oral cavity and oropharynx selected according to tumor cell kinetics ± a phase II multicenter study. Int. J. Radiat. Oncol. Biol. Phys. 1996;36:1137±1145.
[3] Awwad HK, Khafagy Y, Barsoum M, et al. Accelerated versus conventional fractionation in the postoperative irradiation of locally advanced head and neck cancer: in¯uence of tumour proliferation. Radiother. Oncol. 1992;25:261±266.
[4] Barton MB, Keane TJ, Gadalla T, Maki E. The effect of treatment time and treatment interruption on tumour control following radical radiotherapy of laryngeal. Radiother. Oncol. 1992;23:137±143. [5] Begg AC, Ho¯and I, Moonen L, et al. The predictive value of cell
kinetic measurements in a European trial of accelerated fractionation in advanced head and neck tumors: an interim report. Int. J. Radiat. Oncol. Biol. Phys. 1990;19:1449±1453.
[6] Begg AC, Ho¯and I, van Glabbeke M, Horiot JC. Predictive value of potential doubling time for radiotherapy of head and neck tumor patients: results from the EORTC cooperative trial 22851. Semin. Rad. Oncol. 1992;1:22±25.
[7] Begg AC, McNally NJ, Shrieve DC, Karcher H. A method to measure the duration of DNA synthesis and the potential doubling time from a single sample. Cytometry 1985;6:620±626.
[8] Begg AC, Moonen L, Ho¯and I, Dessing M, Bartelink H. Human tumour cell kinetics using a monoclonal antibody against iododeox-yuridine: intratumour sampling variations. Radiother. Oncol. 1988;11:337±347.
[9] Bennett MH, Wilson GD, Dische S, et al. Tumour proliferation assessed by combined histological and ¯ow cytometric analysis: implications for therapy in squamous cell carcinoma in the head and neck. Br. J. Cancer 1992;65:870±878.
[10] Bentzen SM, Thames HD. Clinical evidence for tumor clonogen regeneration: interpretations of the data. Radiother. Oncol. 1991;22:161±166.
[11] Bourhis J, Dendale R, Hill C, et al. Potential doubling time and clinical outcome in head and neck squamous cell carcinoma treated with 70 Gy in 7 weeks. Int. J. Radiat. Oncol. Biol. Phys. 1996;35:471± 476.
[12] Bourhis J, Wilson G, Wibault P, et al. In vivo measurement of the potential doubling time by ¯ow cytometry in oropharyngeal cancer treated by conventional radiotherapy. Int. J. Radiat. Oncol. Biol. Phys. 1993;26:793±799.
[13] Corvo R, Giaretti W, Sanguineti G, et al. Potential doubling time in head and neck tumors treated by primary radiotherapy: preliminary evidence for a prognostic signi®cance in local control. Int. J. Radiat. Oncol. Biol. Phys. 1993;27:1165±1172.
[14] Corvo R, Giaretti W, Sanguineti G, et al. In vivo cell kinetics in head and neck squamous cell carcinomas predicts local control and helps guide radiotherapy regimen. J. Clin. Oncol. 1995;13:1843±1850. [15] Dean PN, Dolbeare F, Gratzner H, Rice GC, Gray JW. Cell-cycle
analysis using a monoclonal antibody to BrdUrd. Cell Tissue Kinet. 1984;17:427±436.
[16] Dolbeare F, Gratzner H, Pallavicini MG, Gray JW. Flow cytometric measurement of total DNA content and incorporated bromodeoxyur-idine. Proc. Natl. Acad. Sci. USA 1983;80:5573±5577.
[17] Dubben HH. No clinical evidence for the in¯uence of overall treat-ment time on TCD50 of head and neck tumours. Radiother. Oncol. 1992;25:142±143.
[18] Eschwege F, Bourhis J, Girinski T, et al. Predictive assays of radiation response in patients with head and neck squamous cell carcinoma: a review of the Institute Gustave Roussy experience. Int. J. Radiat. Oncol. Biol. Phys. 1997;39:849±853.
[19] Fowler JF. Rapid repopulation in radiotherapy: a debate on mechan-ism. The phantom of tumor treatment±continually rapid proliferation unmasked. Radiother. Oncol. 1991;22:156±158.
[20] Fowler JF, Chappell R. Local control versus dose or overall time: from coef®cients to percentages. Br. J. Radiol. 1994;67:1108±1112. [21] Fowler JF, Lindstrom MJ. Loss of local control with prolongation in
radiotherapy. Int. J. Radiat. Oncol. Biol. Phys. 1992;23:457±467. [22] Fyles A, Keane TJ, Barton M, Simm J. The effect of treatment
dura-tion in the local control of cervix cancer. Radiother. Oncol. 1992;25:273±279.
[23] Gratzner HG. Monoclonal antibody to 5-bromo- and 5-iododeoxyur-idine: a new reagent for detection of DNA replication. Science 1982;21:474±475.
[24] Haustermans K, Fowler J, Geboes K, Christiaens MR, Lerut A, Vanderschueren E. Relationship between potential doubling time (T-pot), labeling index and duration of DNA synthesis in 60 esopha-geal and 35 breast tumors: is it worthwhile to measure T-pot? Radio-ther. Oncol. 1998;4:157±167.
[25] Haustermans K, Ho¯and I, Pottie G, Ramaekers M, Begg AC. Can measurements of potential doubling time (Tpot) be compared between laboratories? A quality control study Cytometry 1995;19:154±163.
[26] Haustermans K, Ho¯and I, Ramaekers M, et al. Enrichment of tumor cells for cell kinetic analysis in human tumor biopsies using cytoker-atin gcytoker-ating. Radiother. Oncol. 1996;41:237±248.
[27] Haustermans K, Vanuytsel L, Geboes K, et al. In vivo cell kinetic measurements in human oesophageal cancer: what can be learned from multiple biopsies? Eur. J. Cancer 1994;30A:1787±1791. [28] Horiot JC, Begg AC, Le Fur R, et al. Present status of EORTC trials of
hyperfractionated and accelerated radiotherapy on head and neck carcinoma. Recent Results Cancer Res. 1994;134:111±119. [29] Horiot JC, Bontemps P, Vandenbogaert W, et al. Accelerated
fractio-nation (AF) compared to conventional fractiofractio-nation (CF) improves loco-regional control in the radiotherapy of advanced head and neck cancers: results of the EORTC 22851 randomized trial. Radiother. Oncol. 1997;44:111±121.
[30] Horiot JC, LeFlur R, Schraub S, et al. Status of the experience of the EORTC Cooperative Group of Radiotherapy with hyperfractionated and accelerated radiotherapy. Semin. Rad. Oncol. 1992;2:34±37. [31] Hoyer M, Jorgensen K, Bundgaard T, et al. Lack of predictive value
of potential doubling time and iododeoxyuridine labelling index in radiotherapy of squamous cell carcinoma of the head and neck. Radiother. Oncol. 1998;46:147±155.
[32] Knee R, Fields RS, Peters LJ. Concomitant boost radiotherapy for advanced squamous cell carcinoma of the head and neck. Radiother. Oncol. 1985;4:1±7.
[33] Lee WR, Marcus Jr. RB, Sombeck MD, et al. Radiotherapy alone for carcinoma of the vagina: the importance of overall treatment time. Int. J. Radiat. Oncol. Biol. Phys. 1994;29:983±988.
[34] Lochrin CA, Wilson GD, McNally NJ, Dische S, Saunders MI. Tumor cell kinetics, local tumor control, and accelerated radiotherapy: a preliminary report. Int. J. Radiat. Oncol. Biol. Phys. 1992;24:87±91. [35] Maciejewski B, Skladowski K, Pilecki B, et al. Randomized clinical trial on accelerated 7 days per week fractionation in radiotherapy for head and neck cancer. Preliminary report on acute toxicity. Radiother. Oncol. 1996;40:137±145.
[36] Maciejewski B, Skladowski K, Tarawski R, Zajusz A. Is the 7-day accelerated treatment better than conventional 5-day irradiation of head and neck cancers? In: Kogelnik HD, Sedlmayer F, editors. Progress in radio-oncology VI, Bologna: Editore, 1998. pp. 753. [37] Overgaard J, Hansen HS, Overgaard M, et al. Importance of overall
treatment time of radiotherapy in head and neck carcinoma. Experi-ence from the Danish head and neck cancer study. In: Kogelnik HD, Sedlmayer F, et al., editors. Progress in radio-oncology VI, Bologna: Monduzzi Editore, 1998. pp. 743.
[38] Peters LJ, Ang KK, Thames HD. Accelerated fractionation in the radiation treatment of head and neck cancer. A critical comparison of different strategies. Acta Oncol. 1988;2:185±194.
[39] Rew DA, Campbell ID, Taylor I, Wilson GD. Proliferation indices of invasive breast carcinomas after in vivo 5-bromo-2'-deoxyuridine
labelling: a ¯ow cytometric study of 75 tumours. Br. J. Surg. 1992;7:335±339.
[40] Rew DA, Wilson GD, Taylor I, Weaver PC. Proliferation character-istics of human colorectal carcinomas measured in vivo. Br. J. Surg. 1991;7:60±66.
[41] Saunders M, Dische S, Barrett A, Harvey A, Gibson D, Parmar M. Continuous hyperfractionated accelerated radiotherapy (CHART) versus conventional radiotherapy in non-small-cell lung cancer: a randomized multicentre trial. CHART Steering Committee. Lancet 1997;35:161±165.
[42] Steel GG. Growth kinetics of tumours. Oxford: Oxford University Press, 1977.
[43] Struikmans H, Rutgers DH, Hordijk GJ, Slootweg PJ, van der Tweel I, Battermann JJ. Prognostic signi®cance of cell proliferation markers and DNA-ploidy in head and neck tumors. Int. J. Radiat. Oncol. Biol. Phys. 1998;4:27±34.
[44] Struikmans H, Rutgers DH, Hordijk GJ, Slootweg PJ, van der Tweel I, Battermann JJ. Interrelationships of DNA-ploidy and cell prolifera-tion markers with T-stage and N-stage in primary laryngeal tumors. Int. J. Radiat. Oncol. Biol. Phys. 1998;4:303±308.
[45] Taylor JM, Withers HR, Mendenhall WM. Dose-time considerations of head and neck squamous cell carcinomas treated with irradiation. Radiother. Oncol. 1990;1:95±102.
[46] Terry NH, Peters LJ. The predictive value of tumor-cell kinetic para-meters in radiotherapy: considerations regarding data production and analysis. J. Clin. Oncol. 1995;13:1833±1836.
[47] Tsang RW, Fyles AW, Kirkbride P. Proliferation measurements with ¯ow cytometry Tpot in cancer of the uterine cervix: correlation between two laboratories and preliminary clinical results. Int. J. Radiat. Oncol. Biol. Phys. 1995;32:1319±1329.
[48] Wilson GD. Assessment of human tumour proliferation using bromo-deoxyuridine ± current status. Acta Oncol. 1991;3:903±910. [49] Wilson GD, Dische S, Saunders MI. Studies with bromodeoxyuridine
in head and neck cancer and accelerated radiotherapy. Radiother. Oncol. 1995;36:189±197.
[50] Wilson GD, Paschoud N, Pavy JJ, et al. Reproducibility of measure-ments of potential doubling time of tumour cells in the multi-centre NCI protocol T92-0045. Br. J. Cancer 1999;79:323±332.
[51] Wilson MS, West CM, Wilson GD, Roberts SA, James RD, Scho®eld PF. An assessment of the reliability and reproducibility of measure-ment of potential doubling times (Tpot) in human colorectal cancers. Br. J. Cancer 1993;6:754±759.
[52] Wilson MS, West CM, Wilson GD, Roberts SA, James RD, Scho®eld PF. Intra-tumoral heterogeneity of tumour potential doubling times (Tpot) in colorectal cancer. Br. J. Cancer 1993;6:501±506. [53] Withers HR, Taylor JM, Maciejewski B. The hazard of accelerated
tumor clonogen repopulation during radiotherapy. Acta Oncol. 1988;2:131±146.
[54] Zackrisson B, Gustafsson H, Stenling R, Flygare P, Wilson GD. Predictive value of potential doubling time in head and neck cancer patients treated by conventional radiotherapy. Int. J. Radiat. Oncol. Biol. Phys. 1997;3:677±683.