HAL Id: hal-02505450
https://hal.archives-ouvertes.fr/hal-02505450
Submitted on 3 Apr 2020
HAL is a multi-disciplinary open access archive for the deposit and dissemination of sci-entific research documents, whether they are pub-lished or not. The documents may come from teaching and research institutions in France or abroad, or from public or private research centers.
L’archive ouverte pluridisciplinaire HAL, est destinée au dépôt et à la diffusion de documents scientifiques de niveau recherche, publiés ou non, émanant des établissements d’enseignement et de recherche français ou étrangers, des laboratoires publics ou privés.
Direct Radiative Effect by Mineral Dust Aerosols
Constrained by New Microphysical and Spectral Optical
Data
Claudia Di Biagio, Yves Balkanski, S. Albani, O. Boucher, P. Formenti
To cite this version:
Claudia Di Biagio, Yves Balkanski, S. Albani, O. Boucher, P. Formenti. Direct Radiative Effect by Mineral Dust Aerosols Constrained by New Microphysical and Spectral Optical Data. Geophysical Research Letters, American Geophysical Union, 2020, 47 (2), �10.1029/2019GL086186�. �hal-02505450�
Direct radiative effect by mineral dust aerosols constrained by new
1
microphysical and spectral optical data
2
C. Di Biagio1, Y. Balkanski2, S. Albani2,3, O. Boucher4, and P. Formenti1
3
1 LISA, UMR CNRS 7583, Université Paris‒Est‒Créteil, Université de Paris, Institut Pierre‒
4
Simon Laplace (IPSL), Créteil, France
5
2 Laboratoire des Sciences du Climat et de l’Environnement, CEA CNRS UVSQ UP Saclay,
6
Gif‒sur‒Yvette, France
7
3 Department of Environmental and Earth Sciences, University of Milano‒Bicocca, Milano, Italy
8
4 Institut Pierre‒Simon Laplace, CNRS / Sorbonne Université, Paris, France
9 10
Corresponding author: Claudia Di Biagio ([email protected]‒pec.fr)
11 12
Key Points: 13
New global dust simulations including particles >20 µm, refractive index representative of
14
world sources, and longwave scattering correction
15
The global dust longwave effect remains within published values while the shortwave one
16
is reduced due to the inclusion of coarse particles
17
Varying the longwave refractive index within its documented range of variability modifies
18
the sign of the net global dust direct effect
19 20
Abstract 21
We revise the direct radiative effect (DRE) of mineral dust aerosols in the shortwave (SW) and
22
longwave (LW) based on global model simulations that include coarse dust particles (> 20 µm)
23
and a new LW complex refractive index (CRI) dataset representative of major global sources.
24
Simulations are constrained against observed dust size distributions and optical depth. Scattering
25
of LW radiation is accounted for in the analysis. The extension of the dust size beyond 20 µm
26
causes a reduction in the SW DRE compared to current model estimates, while the LW DRE
27
remains within published values due to compensating effects between changing size distribution,
28
CRI and accounting for dust scattering. The dust direct radiative effect efficiency from model
29
simulations reproduces well field observations close to sources and after transport. The global
30
mean net effect of dust is ‒0.03 Wm‒2 as a result of cooling over oceans and warming over land.
31
1. Introduction 32
Whether desert dust aerosols warm or cool the planet by their direct radiative effect is still a
33
matter of debate (Boucher et al., 2013; Kok et al., 2017, hereafter Kok17). Dust particles of
34
diameter (D) smaller than 2 µm mostly cool our planet because scattering of SW radiation
35
dominates spectral absorption, while larger particles tend to cause warming by absorption of both
36
SW and LW radiation (Liao and Seinfeld, 1998; Miller et al., 2004. Mahowald et al., 2014).
37
Currently, global and regional models suffer from important deficiencies that introduce biases
38
in the estimated total dust DRE. These are:
39
1. Dust size distribution is often limited to a maximum diameter of typically 10 or 20 µm in
40
both regional and global models (Huneeus et al., 2011; Kok17), neglecting the coarsest
41
particles which could contribute to positive DRE for both SW and LW radiation.
42
Furthermore recent field observations suggest that particles larger than 20 µm are present in
43
significant mass concentrations in the atmosphere (Ryder et al., 2013a, 2018, 2019; Weinzerl
44
et al., 2017; van der Does et al., 2018).
45
2. Modelled dust mass concentrations are usually under‒estimated in models for particles with
46
D>5 µm and over‒estimated for D<2 µm compared to observations (Kok, 2011; Kok17;
47
Ryder et al., 2019). Kok17 uses constraints on the size‒dependency of the dust emissions to
48
fit field observations, which results in an average contribution of 4.3% for diameters smaller
49
than 2 µm, significantly lower than the 5‒35% range in other models.
50
3. The variability in the dust complex refractive index at both SW and LW wavelengths, caused
51
by regional differences in the particle mineralogy (Sokolik and Toon, 1999), is not accounted
52
for in models. Global models commonly use the CRI of dust aerosols collected at Barbados
53
after being transported from the Sahara by Volz (1973) (hereafter V73) at LW wavelengths,
54
whereas different CRI datasets (Patterson et al., 1977; Shettle and Fenn, 1979; d’Almeida et
55
al., 1991) are used in the SW. Recent laboratory measurements of dust samples collected
56
over many different deserts suggest that the imaginary part of the SW and LW CRI as
57
assumed in models are upper bound values that can lead to a strong overestimate of the dust
spectral absorption and biases in DRE (Di Biagio et al., 2017, hereafter DB17; Di Biagio et
59
al., 2019).
60
4. Most global and regional models do not include LW scattering in their radiative scheme.
61
However, the contribution of scattering is relevant as it could increase the LW DRE at the
62
Top‒of‒the‒Atmosphere (TOA) by 50% (Dufresne et al., 2002; Sicard et al., 2014; Osipov
63
et al., 2015). Up to now only two studies (Miller et al., 2006; Kok17) try to account for
64
missing LW scattering by artificially augmenting the retrieved TOA DRE by 23%.
65
Nonetheless, this correction represents only about half of the value inferred by Dufresne et
66
al. (2002), Sicard et al. (2014), and Osipov et al. (2015).
67
5. Dust particles are usually assumed as spherical in models. While this simplification may
68
considerably impact the extinction efficiency (Qext) and AOD calculations (Dubovik et al.,
69
2006; Kok17, Potenza et al., 2016), it was demonstrated to have only a limited influence on
70
the TOA DRE (considering a more realistic phase function results in less than 5% and 10%
71
difference compared to spherical dust in the SW and LW ranges, Bellouin et al., 2004;
72
Colarco et al., 2014; however, a larger effect might be expected if a Bidirectional Reflectance
73
Distribution Function, BRDF, surface albedo is assumed in models, Osipov et al., 2015).
74
In this study we present a novel evaluation of the global DRE by mineral dust aerosols and
75
its SW and LW components based on new global model simulations. We constrain the size
76
distribution of dust in the source regions and its AOD at 550 nm (AOD550) in our simulations based
77
on field observations, incorporating dust sizes beyond 20 µm diameter. We correct the dust DRE
78
for accounting the LW scattering effect following Dufresne et al. (2002). For the first time in global
79
simulations we take into account regional variations of the LW CRI, as documented in DB17, to
80
estimate the dust spectral optical properties. In the present study we assume that dust particles are
81
spherical.
82
We compare simulated dust SW and LW direct radiative effect efficiency (DREE) with
83
available observations (including space‒borne sensors) over Northern Africa, Asia, the Atlantic
84
Ocean, and the Mediterranean basin.
85
2. Method 86
Global aerosol simulations are performed with the LMDZOR‒INCA model (Schulz, 2007;
87
Balkanski et al., 2010) which couples interactively the LMDZ (Laboratoire de Météorologie
88
Dynamique) atmospheric General Circulation Model, the ORCHIDEE land surface model and the
89
INCA (INteraction with Chemistry and Aerosols) aerosol module. The radiative transfer module
90
includes a six‒band (0.185‒4.0 µm) version of the Fouquart and Bonnel (1980) scheme in the SW
91
and the RRTMG (Rapid Radiative Transfer Model for Global Circulation Models) radiative
92
scheme in sixteen bands between 3.33 and 1000 µm.
93
2.1 Constraining the size distribution of dust aerosols 94
A superposition of lognormal modes is used to represent the aerosol size distribution in
95
LMDZOR‒INCA (Schulz, 2007). Each mode is described by two variables: a Mass Median
Diameter (MMD) and a geometric standard deviation (σ). The MMD in each mode varies during
97
the simulation in order to account for all processes that increase or deplete the aerosol atmospheric
98
concentration. In contrast, the width of the size distribution (measured by σ) is kept constant. The
99
shape of the dust size distribution at emission is constrained by fitting the dataset recently used by
100
Kok17 (Fig. 1a), but augmented to include missing particles larger than 20 um with airborne
101
measurements taken during the FENNEC campaign in Western Sahara for airborne dust less than
102
12 hours after emission (Ryder et al., 2013a, 2013b) (Fig. 1b). FENNEC is the only campaign that
103
measured the dust size distribution up to 150 µm in diameter very close to source areas. We fit the
104
extended size distribution with four lognormal modes with respective MMD equal to 1 µm (σ=1.8),
105
2.5 µm (σ=2), 7 µm (σ=1.9), and 22 µm (σ=2). The relative mass contribution (mi) by each mode
106
to the total emitted size, retrieved by fitting the ensemble of the observational dataset, is 0.6%
107
(±0.1%), 4.3% (±0.4%), 31.5% (±1.8%) and 63.6% (±2.2%) for modes at 1, 2.5, 7, and 22 µm
108
MMD, respectively (Fig. 1b). The ratio of the PM2 (D ≤ 2 µm) to PM20 (D ≤ 20 µm) emitted mass
109
is 4.7%, within the 3.5‒5.7% range indicated by Kok17.
110
The average size distribution of atmospheric dust is in agreement with in situ and remote
111
sensing field observations taken after few days of transport in Northern Africa, the Mediterranean,
112
and across the Atlantic Ocean (Fig. 1c). The model captures well the coarse component of the dust
113
size as measured in the field but does not represent the peaks in volume distribution below about
114
0.5 µm shown in field data, which are documented to consist of fine anthropogenic particles mixed
115
in the dust plume (Chou et al., 2008; Kandler et al., 2011).
116
The size‒resolved dust load in our model also agrees with new field observations indicating
117
that, after few days of transport at Cape Verde, dust particles larger than 5 um (20 µm) account for
118
60% (0‒12%) of the mass (Ryder et al., 2019). Our model data extracted over the same area and
119
time period show 63% and 11.5% of the mass for D > 5 µm and D > 20 µm, respectively.
120
2.2 Constraining the spectral CRI of dust 121
To further constrain simulations we use a novel observational dataset of regionally‒averaged
122
LW CRI published by DB17 for nineteen natural dust aerosol samples collected in arid and semi‒
123
arid regions of the world (Africa, Asia, America, Australia). These nineteen samples were selected
124
from a much larger assemblage to represent the global variability of the dust content of LW‒active
125
minerals (clays, quartz, and calcite), and therefore of LW CRI. Published radiative closure studies
126
based on aircraft radiation data (Meloni et al., 2018; Granados‒Muñoz et al., 2019)and satellite
127
radiance observations (Liuzzi et al., 2017; Banks et al., 2018; Song et al., 2018) confirm the
128
improved capability of the DB17 dataset to represent the regional variations in the dust LW DRE
129
compared to the V73 CRI.
130 131
132
1
Dubovik et al. (2002; 2
Weinzierl et al. (2009); 3
Formenti et al. (2011); 4
Ryder et al. (2013b) ‒ SAL (Saharan Air Layer); 5
Ryder et al.
133
(2013b) ‒ aged dust; 6 Chen et al. (2011); 7 Weinzierl et al. (2011); 8 Weinzierl et al. (2017) ‒ Cape Verde; 9 Ryder et al. (2018); 10
134
Formenti et al. (2001); 11 Maring et al. (2003); 12 Denjean et al. (2016b); 13 Weinzierl et al. (2017) ‒ Barbados. 14 Denjean et al. (2016a)
135
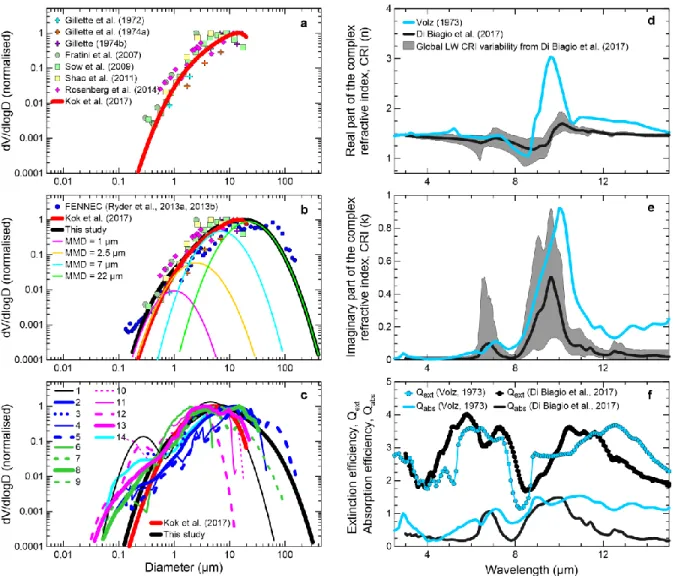
Figure 1. Volume size distributions dV/dlogD and longwave optical properties of the dust aerosols. a Size
136
distribution of the emitted dust reported by Kok17 (Kok et al., 2017) obtained by fitting the reported dataset
137
ensemble. b Size distribution of the emitted dust retrieved in this study. Similar to panel a, the distribution is
138
obtained by fitting the Kok17 dataset ensemble but also includes the FENNEC dataset that represents fresh
139
dust (<12 h from emission). The contribution by the four different modes to our fitted size is shown. c.
140
Globally‒averaged atmospheric dust size distribution obtained from model simulations in this study (weighted
141
by the global mass load of each mode) and in Kok17. Field data from campaigns in Northern Africa (blue
142
lines), the Mediterranean (cyan lines), eastern Atlantic Ocean (green lines) and Western Atlantic Ocean (pink
143
lines) are shown for comparison. Retrieved dust size from AERONET is also reported. All size data in panels
144
a‒c, including the scattering data and the fitting lines from Kok17, are normalized to 1 at the maximum of the
145
volume distribution. d‒e Longwave real and imaginary parts of the CRI from V73 (Volz, 1973) and DB17 (Di
146
Biagio et al., 2017). The black line represents the average spectral values from DB17, while the shaded grey
147
area envelopes the minimum and the maximum of the DB17 dataset representing the CRI regional variability.
148
f Spectral absorption (Qabs) and extinction (Qext) efficiencies estimated from Mie calculations for a particle of
149
D = 10 µm and V73 and DB17 CRI.
In the present study, the base model simulations use the mean wavelength‒dependent LW
151
CRI values by DB17. The minimum and maximum of the imaginary part from DB17 (and
152
associated real parts from Kramers‒Kronig relationships) serve to represent the envelope of the
153
regional variations in CRI. Figure 1d‒f illustrates the important finding that the imaginary parts
154
of the CRI from DB17 is lower than reported by V73, resulting in a lower absorption over most of
155
the spectrum. Figure 1f also illustrates the relative importance of scattering versus absorption at
156
longwave wavelengths, i.e. Qabs is only a fraction of Qext,.
157
In the SW range we employ the spectral CRI from Balkanski et al. (2007) computed assuming
158
that dust contains an average 1.5% of hematite by volume. This assumption corresponds to 1.52‒
159
0.0017i at 550 nm and proved to produce good agreement of the simulated SW TOA DRE and
160
satellite observations (Balkanski et al., 2007). This SW CRI falls at the mean of the values recently
161
reported by Di Biagio et al. (2019) for dust from major global sources.
162
2.3 Constraining the dust emission flux, atmospheric load and optical depth 163
The total emission flux (Etot) is 13689 Tg yr‒1 in our simulations, amounting to 5023 Tg yr‒1
164
for D>20 µm and 8666 Tg yr‒1 for D ≤ 20 µm, a value that is at the upper bound of the emission
165
flux range obtained by Escribano et al. (2017) through a source inversion approach. The Etot is
166
partitioned between the four modes following their mass percent contribution to the emitted size,
167
resulting in E1=80, E2.5=584, E7=4308, and E22=8717 Tg yr‒1, respectively. We set the Etot value
168
in order to have a resulting global and annual mean dust AOD550 within the range from recent
169
synthesis of observations (0.030 ± 0.005) (Ridley et al., 2016) and at the same time both the PM10
170
(D ≤ 10 µm) and PM20 dust loads the closest as possible to the reported range by Kok17 (13‒29
171
Tg and 14‒33 Tg, respectively). The dust AOD550 in our simulations is 0.026 for a total load of
172
38.9 Tg, of which 26 Tg for PM10 and 34.1 Tg for PM20.
173
2.4 Global simulations and DRE estimate 174
We run the model separately for each of the four size modes and for the multimodal size
175
distribution. Emission is set at E1, E2.5, E7, and E22 for single‒mode simulations and at Etot for the
176
combined multimodal run. We repeat single‒mode simulations by assuming different LW CRI
177
datasets (mean, min, max from DB17 and V73). For the multimodal simulation we assume the
178
mean LW CRI from DB17 only. A reference simulation with no dust aerosols is performed.
179
The SW and LW DRE at the TOA and at the surface are calculated for clear‒ and all‒sky
180
conditions as the difference in shortwave and longwave radiative fluxes with and without dust.
181
The dust feedbacks on climate are not activated in our simulations, i.e. dust is a passive tracer, and
182
the perturbation to radiative fluxes from dust is only diagnostic.
183
The dust AOD550 and the DRE are averaged spatially (globally or over specific regions) and
184
temporally (annually or monthly/seasonally) for the evaluation of the global and annual averages
185
and for comparison with satellite and field observations. The SW and LW DREE is calculated as
186
the ratio of the DRE to AOD550.
As longwave scattering by dust is not accounted for in the model radiative scheme, we
188
correct the LW DRE assuming a multiplicative factor of 2.04 (±0.18) (unitless) at TOA and 1.18
189
(±0.01) at the surface based on Dufresne et al.(2002). This corresponds to 51% contribution of
190
scattering to the LW DRE at TOA and 15% at the surface. Note that this correction, estimated for
191
dust of D ≤ 10 µm, might be a lower approximation of the LW scattering by coarse dust.
192
The uncertainty on the dust DRE and DREE arises from a combination of uncertainties in
193
the: (i) emissions, representation of the size distribution of dust and its spatio‒temporal variability
194
(i.e., transport and deposition processes in model), which can be expressed as a single uncertainty
195
of the model skill to simulate the dust AOD550; (ii) dust vertical profile; (iii) refractive index
196
assumptions and its global variability; (iv) dust shape assumptions; (v) treatment of aerosol‒
197
radiation interactions; and (vi) host model uncertainties. The overall uncertainty on the dust DRE
198
is calculated by adding in quadrature all listed uncertainties in the assumption that error sources
199
are independent. The resulting relative uncertainty on the global annual mean TOA DRE (DREE)
200
is estimated to be 85% (88%) in the SW and 69% (72%) in the LW as 90% confidence intervals
201
(CI). More details are provided in the Supplementary Information.
202
3. Results 203
3.1 Model‒observations comparison of the dust radiative effect efficiency 204
Table 1 shows the comparison of our model estimates of the clear‒sky SW and LW DREE 205
with those reported by field studies based on satellite and ground‒based observations. Comparing
206
the DREE allows eliminating differences due to the variable regional load, optically represented
207
by the AOD550. Observations correspond to monthly and seasonal averages in different regions
208
close to African and Asian sources and along the transport pathway straddling along the Atlantic
209
Ocean and the Mediterranean.
210
The DREE values from model simulations are in good agreement with observations in the LW.
211
Using the CRI by DB17 allows reproducing observations within the uncertainty range, both close
212
to the sources and remotely. Results for the V73 CRI are most of the time at the upper bound of
213
field retrieved DREE intervals. Several field studies considered for comparison make use of a
214
certain degree of modelling to derive the dust DREE. Our model results for DREE LW are in best
215
agreement with those providing observational‒only estimates.
216
The DREE comparison is generally worse in the SW, but a very good agreement is obtained
217
over the Tropical Atlantic. Differences in the SW range may arise from the different spectral
218
coverage between the observational products and the model, and also the different methods applied
219
for DREE retrieval and averaging (see Supplementary Information).
220
Note that the total DREE computed by adding up the DRE from single mode simulations is up
221
to 30% (SW) and 7% (LW) lower in absolute value than obtained from the multimodal run.
222 223 224
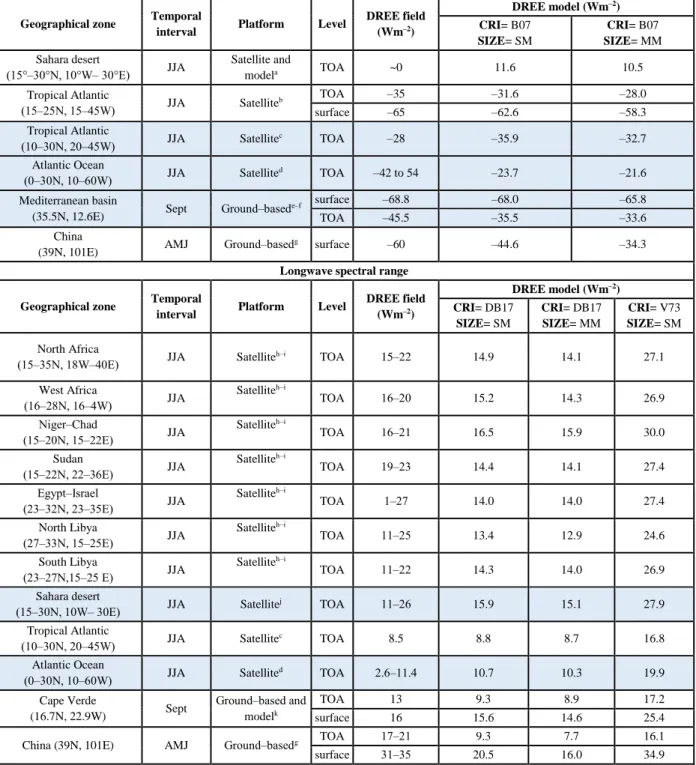
Shortwave spectral range
Geographical zone Temporal
interval Platform Level
DREE field (Wm‒2) DREE model (Wm‒2) CRI= B07 SIZE= SM CRI= B07 SIZE= MM Sahara desert (15°‒30°N, 10°W‒ 30°E) JJA Satellite and modela TOA ~0 11.6 10.5 Tropical Atlantic (15‒25N, 15‒45W) JJA Satelliteb TOA ‒35 ‒31.6 ‒28.0 surface ‒65 ‒62.6 ‒58.3 Tropical Atlantic
(10‒30N, 20‒45W) JJA Satellitec TOA ‒28 ‒35.9 ‒32.7 Atlantic Ocean
(0‒30N, 10‒60W) JJA Satellited TOA ‒42 to 54 ‒23.7 ‒21.6 Mediterranean basin
(35.5N, 12.6E) Sept Ground‒based
e‒f surface ‒68.8 ‒68.0 ‒65.8
TOA ‒45.5 ‒35.5 ‒33.6
China
(39N, 101E) AMJ Ground‒based
g surface ‒60 ‒44.6 ‒34.3
Longwave spectral range
Geographical zone Temporal
interval Platform Level
DREE field (Wm‒2) DREE model (Wm‒2) CRI= DB17 SIZE= SM CRI= DB17 SIZE= MM CRI= V73 SIZE= SM North Africa
(15‒35N, 18W‒40E) JJA Satelliteh‒i TOA 15‒22 14.9 14.1 27.1 West Africa (16‒28N, 16‒4W) JJA Satelliteh‒i TOA 16‒20 15.2 14.3 26.9 Niger‒Chad (15‒20N, 15‒22E) JJA Satelliteh‒i TOA 16‒21 16.5 15.9 30.0 Sudan (15‒22N, 22‒36E) JJA Satelliteh‒i TOA 19‒23 14.4 14.1 27.4 Egypt‒Israel (23‒32N, 23‒35E) JJA Satelliteh‒i TOA 1‒27 14.0 14.0 27.4 North Libya (27‒33N, 15‒25E) JJA Satelliteh‒i TOA 11‒25 13.4 12.9 24.6 South Libya (23‒27N,15‒25 E) JJA Satelliteh‒i TOA 11‒22 14.3 14.0 26.9 Sahara desert
(15‒30N, 10W‒ 30E) JJA Satellitej TOA 11‒26 15.9 15.1 27.9 Tropical Atlantic
(10‒30N, 20‒45W) JJA Satellitec TOA 8.5 8.8 8.7 16.8 Atlantic Ocean
(0‒30N, 10‒60W) JJA Satellited TOA 2.6‒11.4 10.7 10.3 19.9 Cape Verde (16.7N, 22.9W) Sept Ground‒based and modelk TOA 13 9.3 8.9 17.2 surface 16 15.6 14.6 25.4
China (39N, 101E) AMJ Ground‒basedg TOA 17‒21 9.3 7.7 16.1
surface 31‒35 20.5 16.0 34.9
a Patadia et al. (2009); b Li et al. (2004) ; c Song et al. (2018) ; d Christopher and Jones (2007) ; e di Sarra et al. (2008); f Di Biagio et al. (2010);
225
g Hansell et al. (2012); h Zhang and Christopher (2003); i Brindley and Russel (2009); j Yang et al. (2009); k Hansell et al. (2010)
226
JJA = June‒July‒August, AMJ = April‒Mai‒June; SM = Single modes simulations (sum of single modes DRE); MM = Multimodal size
227
distribution simulations; B07 = Balkanski et al. (2007); DB17 = Di Biagio et al. (2017); V73= Volz (1973)
228 229
Table 1. Model‒observations comparison of the shortwave and longwave dust clear‒sky direct radiative effect
230
efficiency (DREE) at the surface and the Top‒of‒the‒Atmosphere (TOA) for different size assumptions and
231
complex refractive index (CRI) data. We indicate in blue the studies that do not rely on modelling to derive the
232
DREE.
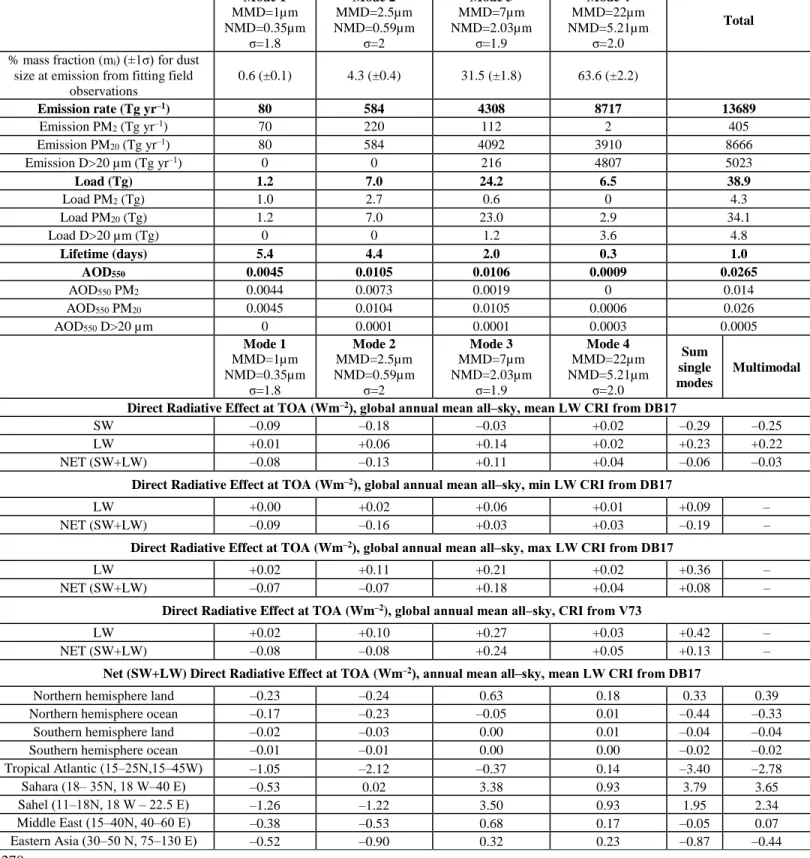
3.2 Dust global DRE: role of coarse particles and sensitivity to the refractive index 234
Table 2 summarizes the contribution of dust particles of different sizes and CRI to the various 235
processes and variables in our simulations. The global annual mean all‒sky DRE of mineral dust
236
at TOA is –0.25 W m‒2 (–0.04 to –0.46 W m‒2, 90% CI) for the SW and +0.22 W m‒2 (+0.07 to
237
+0.37 W m‒2, 90% CI) for the LW as obtained for the multimodal simulation. The net TOA DRE
238
is –0.03 W m‒2, which corresponds to ‒0.29 to +0.23 Wm‒2 within 90% CI. The value of the net
239
TOA DRE is given by the sum of a positive effect over land and a negative effect over oceans,
240
particularly over the Northern Hemisphere where most of the dust is found.
241
The modes at 1 and 2.5 µm account for a tiny fraction of emission (less than 5%) but are
242
responsible for 21% of the dust load, 57% of AOD550 and most of the SW cooling. The opposite
243
is true for the mode at 22 µm that represents 64% of emission but only 17% of load, 3% of AOD550
244
and has a lower but not negligible contribution to both SW and LW DRE. In contrast, the mode at
245
7 µm amounts to 32% of emission, 60% of load, 40% of AOD550 and more than 60% of DRE LW.
246
The fraction of dust above 20 µm diameter is estimated from modes at 7 and 22 µm to contribute
247
to 37% of the total emission, 12% of the load, and 2% of the AOD550, and to account for about
248
30% of the DRE of the mode at 22 µm. The key role of particles larger than 20 µm however does
249
not only rely on their direct contribution to the DRE, but mostly on the fact that their inclusion
250
reduces the contribution by smaller (cooling) particles to the global dust cycle.
251
The SW DRE is negative (cooling) for the 1, 2.5, and 7 µm modes and positive (warming) for
252
the 22 µm mode, while the total (SW+LW) effect is negative for the 1 and 2.5 µm modes and
253
positive for the 7 and 22 µm modes. These global values mask the sharp contrast existing between
254
the positive SW values in the vicinity of source regions and the negative values over oceanic areas,
255
as can be seen in Table 2 comparing TOA DRE over the Sahara desert and the Tropical Atlantic.
256
Using the V73 CRI data results in a LW DRE of +0.42 Wm‒2, with a net SW+LW positive
257
effect of +0.13 Wm‒2 (sum of single mode simulations). Using the mean CRI data from DB17
258
reduces the LW DRE by almost a factor two for each mode simulation compared to V73. Varying
259
the LW CRI between the minimum and maximum of the values indicated by DB17 also changes
260
the sign of the net DRE from ‒0.19 to +0.08 Wm‒2
due to the variation of the DRE LW between
261
+0.09 Wm‒2 and +0.36 Wm‒2, respectively. The CRI is therefore one of the largest source of
262
uncertainty of the dust DRE.
263 264 265 266 267 268 269
Mode 1 MMD=1µm NMD=0.35µm σ=1.8 Mode 2 MMD=2.5µm NMD=0.59µm σ=2 Mode 3 MMD=7µm NMD=2.03µm σ=1.9 Mode 4 MMD=22µm NMD=5.21µm σ=2.0 Total
% mass fraction (mi) (±1σ) for dust
size at emission from fitting field observations 0.6 (±0.1) 4.3 (±0.4) 31.5 (±1.8) 63.6 (±2.2) Emission rate (Tg yr‒1) 80 584 4308 8717 13689 Emission PM2 (Tg yr‒1) 70 220 112 2 405 Emission PM20 (Tg yr‒1) 80 584 4092 3910 8666 Emission D>20 µm (Tg yr‒1) 0 0 216 4807 5023 Load (Tg) 1.2 7.0 24.2 6.5 38.9 Load PM2 (Tg) 1.0 2.7 0.6 0 4.3 Load PM20 (Tg) 1.2 7.0 23.0 2.9 34.1 Load D>20 µm (Tg) 0 0 1.2 3.6 4.8 Lifetime (days) 5.4 4.4 2.0 0.3 1.0 AOD550 0.0045 0.0105 0.0106 0.0009 0.0265 AOD550 PM2 0.0044 0.0073 0.0019 0 0.014 AOD550 PM20 0.0045 0.0104 0.0105 0.0006 0.026 AOD550 D>20 µm 0 0.0001 0.0001 0.0003 0.0005 Mode 1 MMD=1µm NMD=0.35µm σ=1.8 Mode 2 MMD=2.5µm NMD=0.59µm σ=2 Mode 3 MMD=7µm NMD=2.03µm σ=1.9 Mode 4 MMD=22µm NMD=5.21µm σ=2.0 Sum single modes Multimodal
Direct Radiative Effect at TOA (Wm‒2), global annual mean all‒sky, mean LW CRI from DB17
SW ‒0.09 ‒0.18 ‒0.03 +0.02 ‒0.29 ‒0.25
LW +0.01 +0.06 +0.14 +0.02 +0.23 +0.22
NET (SW+LW) ‒0.08 ‒0.13 +0.11 +0.04 ‒0.06 ‒0.03
Direct Radiative Effect at TOA (Wm‒2), global annual mean all‒sky, min LW CRI from DB17
LW +0.00 +0.02 +0.06 +0.01 +0.09 ‒
NET (SW+LW) ‒0.09 ‒0.16 +0.03 +0.03 ‒0.19 ‒
Direct Radiative Effect at TOA (Wm‒2), global annual mean all‒sky, max LW CRI from DB17
LW +0.02 +0.11 +0.21 +0.02 +0.36 ‒
NET (SW+LW) ‒0.07 ‒0.07 +0.18 +0.04 +0.08 ‒
Direct Radiative Effect at TOA (Wm‒2), global annual mean all‒sky, CRI from V73
LW +0.02 +0.10 +0.27 +0.03 +0.42 ‒
NET (SW+LW) ‒0.08 ‒0.08 +0.24 +0.05 +0.13 ‒
Net (SW+LW) Direct Radiative Effect at TOA (Wm‒2), annual mean all‒sky, mean LW CRI from DB17
Northern hemisphere land ‒0.23 ‒0.24 0.63 0.18 0.33 0.39
Northern hemisphere ocean ‒0.17 ‒0.23 ‒0.05 0.01 ‒0.44 ‒0.33
Southern hemisphere land ‒0.02 ‒0.03 0.00 0.01 ‒0.04 ‒0.04
Southern hemisphere ocean ‒0.01 ‒0.01 0.00 0.00 ‒0.02 ‒0.02
Tropical Atlantic (15‒25N,15‒45W) ‒1.05 ‒2.12 ‒0.37 0.14 ‒3.40 ‒2.78 Sahara (18‒ 35N, 18 W‒40 E) ‒0.53 0.02 3.38 0.93 3.79 3.65 Sahel (11‒18N, 18 W ‒ 22.5 E) ‒1.26 ‒1.22 3.50 0.93 1.95 2.34 Middle East (15‒40N, 40‒60 E) ‒0.38 ‒0.53 0.68 0.17 ‒0.05 0.07 Eastern Asia (30‒50 N, 75‒130 E) ‒0.52 ‒0.90 0.32 0.23 ‒0.87 ‒0.44 270
Table 2. Summary of results of our global simulations. We report the contribution of dust particles of different
271
sizes and complex refractive index (CRI) to emissions, atmospheric load, lifetime, AOD550, and the shortwave
272
(SW), longwave (LW), and net direct radiative effect (DRE).
273 274
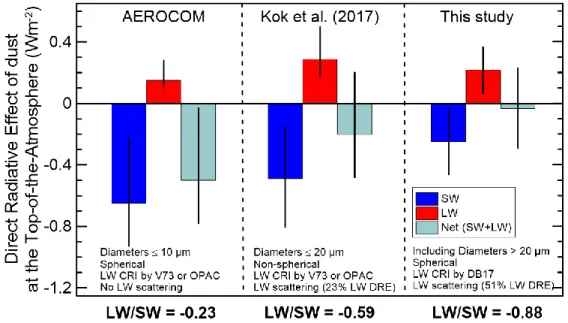
4. Discussion: towards an observationally‒constrained dust DRE 275
Figure 2 summarizes recent developments resulting from applying observational constraints 276
to dust global models including size and optical properties. The inclusion of the coarse mode up
277
to 20 µm in Kok17 and its further extension in the present study leads to a progressive reduction
278
of the SW cooling when compared to the AEROCOM (Aerosol Comparisons between
279
Observations and Models, Huneeus et al., 2011) estimate for PM10 dust (‒0.65 Wm‒2 median value
280
in AEROCOM models, ‒0.49 Wm‒2 in Kok17, ‒0.25 Wm‒2 in the present study).
281
We assume for the first time a LW CRI constrained by laboratory measurements, and we also
282
account for the strong scattering effect of dust in the same spectral range. Our estimated dust LW
283
DRE of +0.22 Wm‒2 is in between the AEROCOM median estimate of +0.15 Wm‒2 and the +0.29
284
Wm‒2 publishedby Kok17. The LW DRE represents on average between 23 and 59% of the SW
285
perturbation at TOA from past literature. Here, the LW contribution amounts to 88% of the SW
286
term at TOA.
287
The reduction of SW cooling and the increase of the LW/SW ratio also result in a progressive
288
reduction of the net DRE from the strong negative values of AEROCOM (‒0.50 Wm‒2) to our
289
estimate of ‒0.03 Wm‒2. However, we stress that because net TOA DRE is geographically varying
290
and can have opposing sign, this can hide large impacts with potentially relevant implications for
291
regional climate (Albani and Mahowald, 2019). In analogy with their study, we report an absolute
292
value of net TOA DRE (global annual average) of 0.32 Wm‒2.
293 294
295
b
296
Figure 2. Top‒of‒the‒atmosphere global annual mean all‒sky shortwave (SW), longwave (LW), and net dust
297
direct radiative effect as obtained in AEROCOM models, in Kok et al. (2017) and in this study. AEROCOM
298
estimate is from Figure 4 in Kok et al. (2017). The inserts detail main assumptions including the used complex
299
refractive index (CRI) data (OPAC is Optical properties of Aerosols and Clouds, Hess et al., 1998), if the LW
300
scattering correction is applied and its percentage of the TOA LW DRE.
5. Conclusions 302
Our model simulations indicate that the global net DRE of dust is close to zero, due to
303
almost opposing SW (cooling) and LW (warming) effects. This global value is also the result of
304
the sum of a positive effect over land, in particular over the Sahara, and a negative effect over
305
oceans.
306
We find that accounting for dust beyond 20 µm diameter reduces the SW cooling compared
307
to previous studies, while the LW DRE remains in the range of previous estimates due to the
308
compensating effects of updating size, LW CRI and scattering. Based on our sensitivity
309
calculations we stress the importance of including regional differences in the CRI and a more
310
realistic representation of the dust size distribution and LW scattering both in global and regional
311
models since they affect the magnitude and sign of the dust DRE. Also, we highlight the necessity
312
for more field measurements to better constrain the emitted dust size distribution at D ≥ 20 µm.
313
Our results suggest that current climate models might significantly overestimate the dust
314
global cooling effect, thus also biasing estimates of the total aerosol radiative perturbation.
315
Although it remains an open question whether global dust loading will increase or decrease in the
316
future, our study indicates that the spatial variability of dust net DRE could be more complex than
317
previously thought in driving global feedbacks, with a potentially important role of dust DRE on
318 regional climate. 319 320 Acknowledgements 321
The laboratory experiments to retrieve the dust refractive indices in Di Biagio et al. (2017) that
322
feed this work had received funding from the European Union’s Horizon 2020 research and
323
innovation program through the EUROCHAMP‒2020 Infrastructure Activity under grant
324
agreement no. 730997. They were supported by the French national programme LEFE/INSU (Les
325
Enveloppes Fluides et l’Environnement / Institut National des Sciences de l’Univers) and by the
326
OSU‒EFLUVE (Observatoire des Sciences de l’Univers‒Enveloppes Fluides de la Ville à
327
l’Exobiologie) through dedicated research funding to the RED‒DUST project. The authors
328
acknowledge the CNRS‒INSU for supporting the CESAM chamber as national facility and the
329
AERIS datacenter (www.aeris‒data.fr) for distributing and curing the data produced by the
330
CESAM chamber through the hosting of the EUROCHAMP datacenter
331
(https://data.eurochamp.org). The present project conducted at IPSL (Institut Pierre Simon
332
Laplace) used the HPC (High Performance Computing) resources of TGCC (Très Grand Centre
333
de calcul du CEA, Commissariat à l´énergie atomique et aux énergies alternatives) under the
334
allocations 2018‒A0050102201, and 2019‒A0050102201 (project gen2201) provided by GENCI
335
(Grand Équipement National de Calcul Intensif). Y. Balkanski and O. Boucher were partly
336
supported by the CRESCENDO project, funded by the European Union’s Horizon 2020
337
programme, Grant Agreement no. 641816. C. Di Biagio was supported by the CNRS via the Labex
338
L‒IPSL, which is funded by the ANR (grant no. ANR‒10‒LABX‒0018). S. Albani acknowledges
funding from the European Union’s Horizon 2020 research and innovation programme under the
340
Marie Skłodowska‒Curie grant agreement No 708119, for the project “DUSt, Climate, and the
341
Carbon Cycle” (DUSC3). The authors wish to acknowledge C. Denjean, C. L. Ryder, and J. Kok
342
for providing the size distribution data shown in Fig. 1. C. Di Biagio also wishes to thank J. Kok
343
and J.‒L. Dufresne for useful discussions. The authors wish to thank the reviewers, Y. Huang and
344
S. Osipov, for their helpful comments that helped to improve the quality of the paper.
345 346
Data availability 347
The LMDZOR‒INCA input data, run configuration and output diagnostic variables are publicly
348
available at http://doi:10.5281/zenodo.3531929. Complex refractive indices from Di Biagio et al.
349
(2017) used here are freely available within the Library of Advanced Data Products (LADP) of the
350
EUROCHAMP datacenter (https://data.eurochamp.org/data‒access/optical‒properties/). The
351
complex refractive index data from Volz (1973) are available at http://eodg.atm.ox.ac.uk/ARIA/.
352
The size data used for comparison in Fig. 1c and the satellite data in Table 1 are described in the
353
Supplementary Information and accessible from the main publications. Data in Fig. 3 are available
354
from Kok et al. (2017) and the present study.
355 356
Conflicts of interest 357
The authors declare no conflicts of interests.
358 359
References 360
Albani, S., & Mahowald, N. (2019). Paleodust insights into dust impacts on climate. Journal of
361
Climate, 32, 7897–7913, https://doi.org/10.1175/JCLI‒D‒18‒0742.1 .
362
Balkanski Y., D. Jacob, G. Gardner, W. Graustein, And K. K. Turekian (1993). Tropospheric
363
Residence Times of Continental Aerosols derived from a Three Dimensional Simulation of
364
210Pb, Journal of Geophysical Research: Atmosphere, 98, pp. 20573‒20586.
365
Balkanski, Y., Schulz, M., Claquin, T., Moulin, C., & Ginoux, P. (2004). Global Emissions of
366
Mineral Aerosol: Formulation and Validation using Satellite Imagery, Springer Netherlands,
367
Dordrecht, 239–267, https://doi.org/10.1007/978‒1‒4020‒2167‒1_6.
368
Balkanski, Y., Schulz, M., Claquin, T., & Guibert, S. (2007). Reevaluation of Mineral aerosol
369
radiative forcings suggests a better agreement with satellite and AERONET data. Atmospheric
370
Chemistry and Physics, 7, 81‒95, https://doi.org/10.5194/acp‒7‒81‒2007.
371
Balkanski, Y., Myhre, G., Gauss, G., Rädel, G., Highwood, E.J., & Shine, K. P. (2010). Direct
372
radiative effect of aerosols emitted by transport: from road, shipping and aviation. Atmospheric
373
Chemistry and Physics , 10, 4477‒4489, https://doi.org/10.5194/acp‒10‒4477‒2010.
374
Banks, J. R., Schepanski, K., Heinold, B., Hünerbein, A., & Brindley, H. E. (2018). The influence
375
of dust optical properties on the colourof simulated MSG‒SEVIRI Desert Dust infrared
376
imagery. Atmospheric Chemistry and Physics, 18, 9681–9703, https://doi.org/10.5194/acp‒18‒
377
9681‒2018.
Bellouin, N., Boucher, O., Vesperini, M., & Tanré, D. (2004). Estimating the direct aerosol
379
radiative perturbation: Impact of ocean surface representation and aerosol non‐sphericity.
380
Quarterly Journal of the Royal Meteorological Society, 130: 2217‒2232.
381
doi:10.1256/qj.03.136.
382
Bohren, C. F., & Huffman, D. R. (1983). Absorption and scattering oflight by small particles,
383
Wiley, New York.
384
Boucher, O., et al. (2013). Clouds and Aerosols. In: Climate Change 2013: The Physical Science
385
Basis. Contribution of Working Group I to the Fifth Assessment Report of the
386
Intergovernmental Panel on Climate Change [Stocker, T.F., D. Qin, G.‒K. Plattner, M. Tignor,
387
S.K. Allen, J. Boschung, A. Nauels, Y. Xia, V. Bex and P.M. Midgley (eds.)]. Cambridge
388
University Press, Cambridge, United Kingdom and New York, NY, USA.
389
Brindley, H.E., & Russell, J.E. (2009). An assessment of Saharan dust loading and the
390
corresponding cloud‒free longwave direct radiative effect from geostationary satellite
391
observations. Journal of Geophysical Research: Atmosphere, 114, D23201,
392
doi:10.1029/2008JD011635.
393
Chen, G., Ziemba, L.D., Chu, D.A., Thornhill, K.L., Schuster, G.L., Winstead, E.L., et al. (2011).
394
Observations of Saharan dust microphysical and optical properties from the Eastern Atlantic
395
during NAMMA airborne field campaign. Atmospheric Chemistry and Physics, 11, 723‒740,
396
https://doi.org/10.5194/acp‒11‒723‒2011.
397
Chou C., Formenti, P., Maillé, M., Ausset, P., Helas, G., Harrison, M., & Osborne, S. (2008). Size
398
distribution, shape, and composition of mineral dust aerosols collected during the African
399
Monsoon Multidisciplinary Analysis Special Observation Period 0: Dust and Biomass‒Burning
400
Experiment field campaign in Niger, January 2006. Journal of Geophysical Research:
401
Atmosphere, 113, D00C10, doi:10.1029/2008JD009897.
402
Christopher, S.A., & Jones, T. (2007). Satellite‒based assessment of cloud‒free net radiative effect
403
of dust aerosols over the Atlantic Ocean. Geophysical Research Letters, 34, L02810,
404
doi:10.1029/2006GL027783.
405
Colarco, P. R., Nowottnick, E. P., Randles, C. A., Yi, B., Yang, P., Kim, K.‐M., Smith, J. A., &
406
Bardeen, C. G. ( 2014). Impact of radiatively interactive dust aerosols in the NASA GEOS‐5
407
climate model: Sensitivity to dust particle shape and refractive index. Journal of Geophysical
408
Research: Atmosphere, 119, 753– 786, doi:10.1002/2013JD020046.
409
d’Almeida, G. A., P. Koepke, & E. P. Shettle (1991). Atmospheric Aerosols: Global Climatology
410
and Radiative Characteristics. A. Deepak Pub, Hampton, 561 p.
411
Denjean, C., Cassola, F., Mazzino, A., Triquet, S., Chevaillier, S., Grand, N., et al. (2016a). Size
412
distribution and optical properties of mineral dust aerosols transported in the western
413
Mediterranean. Atmospheric Chemistry and Physics, 16, 1081–1104,
414
https://doi.org/10.5194/acp‒16‒1081‒2016.
415
Denjean, C., Formenti, P., Desboeufs, K., Chevaillier, S., Triquet, S., Maillé, M., et al. (2016b).
416
Size distribution and optical properties of African mineral dust after intercontinental transport.
417
Journal of Geophysical Research: Atmosphere, 121, 7117–7138, doi: 10.1002/2016JD024783.
418
Di Biagio, C., di Sarra, A., & Meloni, D. (2010) Large atmospheric shortwave radiative forcing
419
by Mediterranean aerosols derived from simultaneous ground‐based and spaceborne
420
observations and dependence on the aerosol type and single scattering albedo. Journal of
421
Geophysical Research: Atmosphere,115, D10209, doi:10.1029/2009JD012697.
Di Biagio, C., Boucher, H., Caquineau, S., Chevaillier, S., Cuesta, J., & Formenti, P. (2014a).
423
Variability of the infrared complex refractive index of African mineral dust: experimental
424
estimation and implications for radiative transfer and satellite remote sensing. Atmospheric
425
Chemistry and Physics, 14, 11093‒11116, https://doi.org/10.5194/acp‒14‒11093‒2014.
426
Di Biagio ,C., P. Formenti, S.A. Styler, E. Pangui, & J.‒F. Doussin (2014b). Laboratory chamber
427
measurements ofthe longwave extinction spectra andcomplex refractive indices of African and
428
Asian mineral dusts. Geophysical Research Letters, 41, 6289–6297,
429
doi:10.1002/2014GL060213.
430
Di Biagio, C., Formenti, P., Balkanski, Y., Caponi, L., Cazaunau, M., Pangui, E., et al. (2017).
431
Global scale variability of the mineral dust long‒wave refractive index: a new dataset of in situ
432
measurements for climate modeling and remote sensing. Atmospheric Chemistry and Physics,
433
17, 1901–1929, https://doi.org/10.5194/acp‒17‒1901‒2017.
434
Di Biagio, C., Formenti, P., Balkanski, Y., Caponi, L., Cazaunau, M., Pangui, E., et al. (2019).
435
Complex refractive indices and single scattering albedo of global dust aerosols in the shortwave
436
spectrum and relationship to iron content and size, Atmospheric Chemistry and Physics
437
Discussion, https://doi.org/10.5194/acp‒2019‒145.
438
di Sarra, A., Pace, G., Meloni, D., De Silvestri, L., Piacentino, S., & Monteleone, F. (2008).
439
Surface shortwave radiative forcing of different aerosol types in the central Mediterranean,
440
Geophysical Research Letters, 35, L02714, doi:10.1029/2007GL032395.
441
Dubovik, O., Holben, B., Eck, T.F., Smirnov, A., Kaufman, Y.J., King, M.D., Tanré, D., &
442
Slutsker, I. (2002). Variability of absorption and optical properties of key aerosol types
443
observed in worldwide locations. Journal of the Atmospheric Science, 59, 590‒608,
444
https://doi.org/10.1175/1520‒0469(2002)059<0590:VOAAOP>2.0.CO;2.
445
Dubovik, O., Sinyuk, A., Lapyonok, T., Holben, B.N., Mishchenko, M., Yang, P., et al. ( 2006).
446
Application of spheroid models to account for aerosol particle nonsphericity in remote sensing
447
of desert dust, Journal of Geophysical Research: Atmosphere, 111, D11208,
448
doi:10.1029/2005JD006619.
449
Dufresne, J.L., Gautier, C., Ricchiazzi, P. & Fouquart, Y. (2002). Longwave scattering effects of
450
mineral aerosols. Journal of the Atmospheric Science, 59, 1959‒1966,
451
https://doi.org/10.1175/1520‒0469(2002)059<1959:LSEOMA>2.0.CO;2.
452
Escribano, J., Boucher, O., Chevallier, F., & Huneeus, N. (2017). Impact of the choice of the
453
satellite aerosol optical depth product in a sub‒regional dust emission inversion. Atmospheric
454
Chemistry and Physics, 17, 7111–7126, https://doi.org/10.5194/acp‒17‒7111‒2017.
455
Formenti, P., Andreae, M. O., Lange, L., Roberts, G., Cafmeyer, J., Rajta, I., Maenhaut, W.,
456
Holben, B. N., Artaxo, P., & Lelieveld, J. (2001). Saharan dust in Brazil and Suriname during
457
the Large‐Scale Biosphere‐Atmosphere Experiment in Amazonia (LBA) ‐ Cooperative LBA
458
Regional Experiment (CLAIRE) in March 1998. Journal of Geophysical Research:
459
Atmosphere, 106(D14), 14919–14934, doi: 10.1029/2000JD900827.
460
Formenti, P., Rajot, J. L., Desboeufs, K., Saïd, F., Grand, N., Chevaillier, S., & Schmechtig, C
461
(2011). Airborne observations of mineral dust over western Africa in the summer Monsoon
462
season: spatial and vertical variability of physico–chemical and optical properties. Atmospheric
463
Chemistry and Physics, 11, 6387–6410, https://doi.org/10.5194/acp‒11‒6387‒2011.
464
Fouquart, Y. and Bonnel, B. (1980) Computations of Solar Heating of the Earth’s Atmosphere—
465
A New Parameterization. Beitrage zur Physik der Atmosphare, 53, 35‒62.
Fratini, G., Ciccioli, P., Febo, A., Forgione, A. & R. Valentini (2007). Size‒segregated fluxes of
467
mineral dust from a desert area of northern China by eddy covariance. Atmospheric Chemistry
468
and Physics, 7, 2839‒2854, https://doi.org/10.5194/acp‒7‒2839‒2007.
469
Fu, Q., and K. N. Liou (1993), Parameterization of the radiative properties of cirrus clouds, J.
470
Atmos. Sci., 50, 2008 – 2025, doi:10.1175/1520–0469(1993)050<2008:POTRPO>2.0.CO;2.
471
Gillette, D.A., Blifford, I.H. & Fenster, C.R. (1972). Measurements of aerosol size distributions
472
and vertical fluxes of aerosols on land subject to wind erosion. Journal of Applied Meteorology,
473
11, 977‒987, https://doi.org/10.1175/1520‒0450(1972)011<0977:MOASDA>2.0.CO;2.
474
Gillette, D.A., Blifford, I.H. & Fryrear, D.W. (1974a). Influence of wind velocity on size
475
distributions of aerosols generated by wind erosion of soils. Journal of Geophysical Research:
476
Atmosphere , 79, 4068‒4075, doi:10.1029/JC079i027p04068.
477
Gillette, D.A. (1974b), On the production of soil wind erosion having the potential for long range
478
transport. Journal of Geophysical Research: Atmosphere, 8, 734‒744.
479
Granados‒Muñoz, M. J., Sicard, M., Román, R., Benavent‒Oltra, J. A., Barragán, R., Brogniez,
480
G., et al. (2019). Impact of mineral dust on shortwave and longwave radiation: evaluation of
481
different vertically resolved parameterizations in 1‒D radiative transfer computations.
482
Atmospheric Chemistry and Physics, 19, 523–542, https://doi.org/10.5194/acp‒19‒523‒2019.
483
Hansell, R.A., Tsay, S.C., Ji, Q., Hsu, N.C., Jeong, M.J., Wang, S.H., Reid, J.S., Liou, K.N., &
484
Ou, S.C. (2010). An Assessment of the Surface Longwave Direct Radiative Effect of Airborne
485
Saharan Dust during the NAMMA Field Campaign. Journal of the Atmospheric Science, 67,
486
1048‒1065, https://doi.org/10.1175/2009JAS3257.1.
487
Hansell, R. A., et al. (2012), An assessment of the surface longwave direct radiative effect of
488
airborne dust in Zhangye, China, during the Asian Monsoon Years field experiment (2008),
489
Journal of Geophysical Research: Atmosphere , 117, D00K39, doi:10.1029/2011JD017370.
490
Hess, M., P. et al. (1998), Optical properties of aerosols and clouds: The software package OPAC.
491
Bulletin of the American Meteorological Society, 79(5), 831–844,
492
https://doi.org/10.1175/1520‒0477(1998)079<0831:OPOAAC>2.0.CO;2.
493
Hourdin, F., Mauritsen, T., Gettelman, A., Golaz, J.‐C., Balaji, V., Duan, Q., et al. (2017). The art
494
and science of climate model tuning. Bulletin of the American Meteorological
495
Society, 98(3), 589–602, https://doi.org/10.1175/bams‒d‒15‒00135.1.
496
Huneeus, N., Schulz, M., Balkanski, Y., Griesfeller, J., Prospero, J., Kinne, S., et al. (2011). Global
497
dust model intercomparison in AeroCom phase I, Atmospheric Chemistry and Physics, 11(15),
498
7781–7816, doi:10.5194/acp‒11‒7781‒2011.
499
Kandler, K. , Lieke, K. , Benker, N. , Emmel, C. , Küpper, M. , Müller‐Ebert, D., et al. (2011),
500
Electron microscopy of particles collected at Praia, Cape Verde, during the Saharan Mineral
501
Dust Experiment: particle chemistry, shape, mixing state and complex refractive index. Tellus
502
B, 63: 475‒496. doi:10.1111/j.1600‒0889.2011.00550.x.
503
Kaufman, Y. J., Koren, I., Remer, L. A., Tanre, D., Ginoux, P., & Fan, S. (2005). Dust transport
504
and deposition observed from the Terra–Moderate Resolution Imaging Spectroradiometer
505
(MODIS) spacecraft over the Atlantic Ocean. Journal of Geophysical Research: Atmosphere,
506
110, D10S12, doi:10.1029/2003JD004436.
507
Koffi, B., et al. (2012), Application of the CALIOP layer product to evaluate the vertical
508
distribution of aerosols estimated by global models: Aerocom phase I results, J. Geophys. Res.,
509
117, D10201, doi:10.1029/2011JD016858.
Kok, J. F. (2011). A scaling theory for the size distribution of emitted dust aerosols suggests
511
climate models underestimate the size of the global dust cycle. Proceedings of the National
512
Academy of Sciences, 108(3), 1016, https://doi.org/10.1073/pnas.1014798108.
513
Kok, J. F., Ridley, D. A., Zhou, Q., Miller, R. L., Zhao, C., Heald, C. L., Ward, D. S., Albani, S.,
514
& Haustein, K. (2017). Smaller desert dust cooling effect estimated from analysis of dust size
515
and abundance. Nature Geoscience, 10, 274‒278, https://doi.org/10.1038/ngeo2912.
516
Li, F., Vogelmann, A.M., & Ramanathan, V. (2004). Saharan Dust Aerosol Radiative Forcing
517
Measured from Space. Journal of Climate, 17, 2558‒2571, https://doi.org/10.1175/1520‒
518
0442(2004)017<2558:SDARFM>2.0.CO;2.
519
Liao, H., & Seinfeld, J. H. (1998). Radiative forcing by mineral dust aerosols: sensitivity to key
520
variables. Journal of Geophysical Research: Atmosphere, 103, 31637–31646,
521
doi:10.1029/1998JD200036.
522
Liuzzi, G., Masiello, G., Serio, C., Meloni, D., Di Biagio, C., & Formenti, P. (2017), Consistency
523
of dimensional distributions and refractive indices of desert dust measured over Lampedusa
524
with IASI radiances. Atmospheric Measurements Techniques, 10, 599‒615,
525
https://doi.org/10.5194/amt‒10‒599‒2017.
526
Mahowald, N., Albani, S., Kok, J. F., Engelstaedter, S., Scanza, R., Ward, D. S., & Flanner, M. G.
527
(2014). The size distribution of desert dust aerosols and its impact on the Earth system. Aeolian
528
Research, 15, 53‒71, doi: 10.1016/j.aeolia.2013.09.002.
529
Maring, H., Savoie, D. L., Izaguirre, M. A., Custals, L., & Reid, J. S. (2003). Mineral dust aerosol
530
size distribution change during atmospheric transport, Journal of Geophysical Research:
531
Atmosphere, 108, 8592, doi:10.1029/2002jd002536.
532
Meloni, D., di Sarra, A., Brogniez, G., Denjean, C., De Silvestri, L., Di Iorio, T., et al. (2018).
533
Determining the infrared radiative effects of Saharan dust: a radiative transfer modelling study
534
based on vertically resolved measurements at Lampedusa. Atmospheric Chemistry and Physics,
535
18, 4377‒4401, https://doi.org/10.5194/acp‒18‒4377‒2018.
536
Miller, R. L., Tegen, I., & Perlwitz, J. (2004). Surface radiative forcing by soil dust aerosols and
537
the hydrologic cycle. Journal of Geophysical Research: Atmosphere , 109, D04203,
538
doi:10.1029/2003JD004085.
539
Miller, R.L., Cakmur, R.V., Perlwitz, J.P., Geogdzhayev, I.V., Ginoux, P., Kohfeld, K.E., et al.
540
(2006). Mineral dust aerosols in the NASA Goddard Institute for Space Sciences ModelE
541
atmospheric general circulation model. Journal of Geophysical Research: Atmosphere, 111,
542
D06208, doi:10.1029/2005JD005796.
543
Osipov, S., Stenchikov, G., Brindley, H., and Banks, J. (2015). Diurnal cycle of the dust
544
instantaneous direct radiative forcing over the Arabian Peninsula. Atmospheric Chemistry and
545
Physics, 15, 9537–9553, https://doi.org/10.5194/acp‒15‒9537‒2015.
546
Patadia, F., Yang, E.‒S., & Christopher, S.A. (2009). Does dust change the clear sky top of
547
atmosphere shortwave flux over high surface reflectance regions? Geophysical Research
548
Letters, 36, L15825, doi:10.1029/2009GL039092.
549
Patterson, E.M., Filette, D. A., & Stockton, B. H. (1977). Complex index of refraction between
550
300 and 700 nm for Saharan aerosols. Journal of Geophysical Research: Atmosphere, 82,
551
3153–3160, 1977, doi:10.1029/JC082i021p03153.
Potenza, M.A.C., Albani, S., Delmonte, B., Villa, S., Sanvito, T., Paroli, B., Pullia, A., Baccolo,
553
G., Mahowald, N., & Maggi, V. (2016). Shape and size constraints on dust optical properties
554
from the Dome C ice core, Antarctica. Scientific Reports, 6, 28162; doi: 10.1038/srep28162.
555
Rajeev, K., and V. Ramanathan, 2001: Direct observations of clearsky aerosol radiative forcing
556
from space during the Indian Ocean experiment. J. Geophys. Res., 106, 17 221–17 235,
557
doi:10.1029/2000JD900723.
558
Ridley, D. A., Heald, C. L., Kok, J. F., & Zhao, C. (2016). An observationally‒constrained
559
estimate of global dust aerosol optical depth. Atmospheric Chemistry and Physics, 16,
560
15097_15117, https://doi.org/10.5194/acp‒16‒15097‒2016.
561
Rosenberg, P. D., Parker, D. J., Ryder, C. L., Marsham, J. H., Garcia‐Carreras, L., Dorsey, J. R.,
562
et al. (2014). Quantifying particle size and turbulent scale dependence of dust flux in the Sahara
563
using aircraft measurements. Journal of Geophysical Research: Atmosphere, 119, 7577‒7598,
564
doi:10.1002/2013JD021255.
565
Ryder, C. L., Highwood, E. J., Rosenberg, P. D., Trembath, J., Brooke, & J. K., Bart (2013a).
566
Optical properties of Saharan dust aerosol and contribution from the coarse mode as measured
567
during the Fennec 2011 aircraft campaign. Atmospheric Chemistry and Physics, 13, 303‒325,
568
https://doi.org/10.5194/acp‒13‒303‒2013.
569
Ryder, C. L., Highwood, E. J., Lai, T. M., Sodemann, H., & Marsham, J. H. (2013b). Impact of
570
atmospheric transport on the evolution of microphysical and optical properties of Saharan dust.
571
Geophysical Research Letters, 40, 2433– 2438, doi:10.1002/grl.50482.
572
Ryder, C. L., Marenco, F., Brooke, J. K., Estelles, V., Cotton, R., Formenti, P., et al. (2018).
573
Coarse‒mode mineral dust size distributions, composition and optical properties from AER‒D
574
aircraft measurements over the tropical eastern Atlantic. Atmospheric Chemistry and Physics,
575
18, 17225‒17257, https://doi.org/10.5194/acp‒18‒17225‒2018.
576
Ryder, C. L., Highwood, E. J., Walser, A., Seibert, P., Philipp, A., & Weinzierl, B. (2019). Coarse
577
and Giant Particles are Ubiquitous in Saharan Dust Export Regions and are Radiatively
578
Significant over the Sahara. Atmospheric Chemistry and Physics Discussion,
579
https://doi.org/10.5194/acp‒2019‒421.
580
Satheesh, S. K., & V. Ramanathan (2000). Large differences in tropical aerosol forcing at the top
581
of the atmosphere and Earth’s surface, Nature, 405, 60–63, doi:10.1038/35011039.
582
Schulz, M. (2007). Constraining Model Estimates of the Aerosol Radiative Forcing, Thèse
583
d’Habilitation à Diriger des Recherches, Université Pierre et Marie Curie, Paris VI.
584
Séférian, R., Baek, S., Boucher, O., Dufresne, J.‒L., Decharme, B., Saint‒Martin, D., & Roehrig,
585
R. (2018). An interactive ocean surface albedo scheme (OSAv1.0): formulation and evaluation
586
in ARPEGE‒Climat (V6.1) and LMDZ (V5A), Geoscientific Model Development, 11, 321–
587
338, https://doi.org/10.5194/gmd‒11‒321‒2018.
588
Shao, Y., Ishizuka, M., Mikami, M. & Leys, J.F. (2011). Parameterization of size‒resolved dust
589
emission and validation with measurements. Journal of Geophysical Research‒Atmospheres,
590
116, D08203, doi:10.1029/2010JD014527.
591
Shettle, P. E. & Fenn, R. W. (1979). Models for the aerosols of the lower atmosphere and the
592
effects of humidity variations on their optical properties. AFCRL Tech. Report, 79 0214,
593
Research Papers No. 676, Air Force Cambridge Research Laboratory, Hanscom Airforce Base,
594
MA., 100 pp.
Sicard, M., Bertolín, S., Mallet, M., Dubuisson, P., & Comerón, A. (2014). Estimation of mineral
596
dust long‒wave radiative forcing: sensitivity study to particle properties and application to real
597
cases in the region of Barcelona. Atmospheric Chemistry and Physics, 14, 9213‒9231,
598
https://doi.org/10.5194/acp‒14‒9213‒2014.
599
Sokolik, I., & Toon, O. (1999). Incorporation of mineralogical composition into models of the
600
radiative properties of mineral aerosol from UV to IR wavelengths. Journal of Geophysical
601
Research: Atmosphere, 104(D8), 9423‒9444.
602
Song, Q., Zhang, Z., Yu, H., Kato, S., Yang, P., Colarco, P., Remer, L. A., & Ryder, C. L. (2018).
603
Net radiative effects of dust in the tropical North Atlantic based on integrated satellite
604
observations and in situ measurements. Atmospheric Chemistry and Physics, 18, 11303–11322,
605
https://doi.org/10.5194/acp‒18‒11303‒2018.
606
Sow, M., Alfaro, S.C., Rajot, J.L. & Marticorena, B. (2009). Size resolved dust emission fluxes
607
measured in Niger during 3 dust storms of the AMMA experiment. Atmospheric Chemistry and
608
Physics, 9, 3881‒3891, https://doi.org/10.5194/acp‒9‒3881‒2009.
609
Stier, P., Schutgens, N. A. J., Bellouin, N., Bian, H., Boucher, O., Chin, M., et al.. (2013). Host
610
model uncertainties in aerosol radiative forcing estimates: results from the AeroCom Prescribed
611
intercomparison study. Atmospheric Chemistry and Physics, 13, 3245‒3270,
612
https://doi.org/10.5194/acp‒13‒3245‒2013.
613
van der Does, M., Knippertz, P. Zschenderlein, P. Giles Harrison R. & Stuut J.‒B. W. (2018). The
614
mysterious long‒range transport of giant mineral dust particles, Science Advances, 4, 12, DOI:
615
10.1126/sciadv.aau2768.
616
Volz, F. E. (1972), Longwave refractive index of atmospheric aerosol substances, Appl. Opt., 11,
617
755–759, https://doi.org/10.1364/AO.11.000755.
618
Volz, F. E. (1973). Longwave optical constants of ammonium sulfate, Sahara dust; volcanic
619
pumice and flyash. Applied Optics, 12, 564–568, https://doi.org/10.1364/AO.12.000564.
620
Wang, J., Doussin, J. F., Perrier, S., Perraudin, E., Katrib, Y., Pangui, E., & Picquet–Varrault, B.
621
(2011). Design of a new multi–phase experimental simulation chamber for atmospheric
622
photosmog, aerosol and cloud chemistry research. Atmospheric Measurements Techniques, 4,
623
2465–2494, doi:10.5194/amt–4–2465–2011.
624
Weinzierl, B., Petzold, A. , Esselborn, M. , Wirth, M. , Rasp, K. , Kandler, K., et al. (2009).
625
Airborne measurements of dust layer properties, particle size distribution and mixing state of
626
Saharan dust during SAMUM 2006. Tellus B, 61B, 96‒117, doi:10.1111/j.1600‒
627
0889.2008.00392.x.
628
Weinzierl, B., Sauer, D., Esselborn, M., Petzold, A., Veira, A., Rose, M., et al. (2011).
629
Microphysical and optical properties of dust and tropical biomass burning aerosol layers in the
630
Cape Verde region – An overview of the airborne in‒situ and lidar measurements during
631
SAMUM‒2. Tellus B, 63B(4), 589‒618, http://dx.doi.org/10.1111/j.16000889.2011.00566.x
632
Weinzierl, B., Ansmann, A., Prospero, J. M., Althausen, D., Benker, N., Chouza, F., et al. (2017).
633
The Saharan Aerosol Long‒range Transport and Aerosol‒cloud‒interaction experiment:
634
Overview and Selected Highlights, Bulletin of the American Meteorological Society, 98, 1427–
635
1451, doi: 10.1175/BAMS‒D‒15‒00142.
636
Yang, E.‒S., Gupta, P., & Christopher, S.A. (2009). Net radiative effect of dust aerosols from
637
satellite measurements over Sahara. Geophysical Research Letters, 36, L18812,
638
doi:10.1029/2009GL039801.
Zhang, J., & Christopher, S.A. (2003). Longwave radiative forcing of Saharan dust aerosols
640
estimated from MODIS, MISR, and CERES observations on Terra. Geophysical Research
641
Letters, 30(23), 2188, doi:10.1029/2003GL018479.
642
Zhang, L., Li, Q. B., Gu, Y., Liou, K. N., & Meland, B. (2013). Dust vertical profile impact on
643
global radiative forcing estimation using a coupled chemical‒transport–radiative‒transfer
644
model. Atmospheric Chemistry and Physics, 13, 7097‒7114, https://doi.org/10.5194/acp‒13‒
645
7097‒2013.