HAL Id: hal-01258712
https://hal.sorbonne-universite.fr/hal-01258712
Submitted on 19 Jan 2016
HAL is a multi-disciplinary open access archive for the deposit and dissemination of sci-entific research documents, whether they are pub-lished or not. The documents may come from teaching and research institutions in France or abroad, or from public or private research centers.
L’archive ouverte pluridisciplinaire HAL, est destinée au dépôt et à la diffusion de documents scientifiques de niveau recherche, publiés ou non, émanant des établissements d’enseignement et de recherche français ou étrangers, des laboratoires publics ou privés.
Distributed under a Creative Commons Attribution| 4.0 International License
sensory dysfunction in amyotrophic lateral sclerosis
Caroline Iglesias, Sina Sangari, Mohamed-Mounir El Mendili, Habib Benali,
Véronique Marchand-Pauvert, Pierre-François Pradat
To cite this version:
Caroline Iglesias, Sina Sangari, Mohamed-Mounir El Mendili, Habib Benali, Véronique Marchand-Pauvert, et al.. Electrophysiological and spinal imaging evidences for sensory dysfunction in
amyotrophic lateral sclerosis. BMJ Open, BMJ Publishing Group, 2015, 5 (2), pp.e007659.
Electrophysiological and spinal imaging
evidences for sensory dysfunction
in amyotrophic lateral sclerosis
Caroline Iglesias,1Sina Sangari,1Mohamed-Mounir El Mendili,1Habib Benali,1 Véronique Marchand-Pauvert,1Pierre-François Pradat1,2
To cite: Iglesias C, Sangari S, El Mendili M-M,et al. Electrophysiological and spinal imaging evidences for sensory dysfunction in amyotrophic lateral sclerosis.BMJ Open 2015;5: e007659. doi:10.1136/ bmjopen-2015-007659
▸ Prepublication history for this paper is available online. To view these files please visit the journal online (http://dx.doi.org/10.1136/ bmjopen-2015-007659).
CI and SS are co-first authors; VM-P and P-FP are co-last authors.
Received 13 January 2015 Revised 29 January 2015 Accepted 2 February 2015
For numbered affiliations see end of article. Correspondence to Dr Véronique Marchand-Pauvert; veronique.marchand@upmc. fr ABSTRACT
Objectives:The prevalence of sensory impairment at an early stage of amyotrophic lateral sclerosis (ALS) is still debated. The study aim was to investigate the anatomofunctional properties of sensory pathways in patients with ALS, combining spinal diffusion tensor imaging (DTI) and somatosensory evoked potentials (SEPs).
Design:Case–control study.
Settings:ALS referral centre and laboratory of biomedical imaging (Paris, France).
Participants:Well-characterised group of 21 patients with ALS with moderate disability (mean amyotrophic lateral sclerosis Functional Rating Scale (ALSFRS) score 39.3±1.0) and no clinical sensory signs and control group of 21 gender and age-matched healthy subjects.
Outcome measures:Fractional anisotropy and diffusivity of the dorsal columns at C5-T1 levels (DTI metrics) and SEPs after median and ulnar nerve stimulations (latency and amplitude of N9 and N20 components).
Results:Abnormal DTI metrics indicated anatomical damages of ascending sensory fibres in∼60% of patients (p<0.05). Raw SEPs (μV) were smaller in ∼40% of patients but the difference with healthy subjects was not significant ( p>0.16). Their normalisation to prestimulus activity strengthened the difference between groups ( p<0.05) and allowed identification of∼60% of patients with abnormal values. According to N9 latency, the peripheral conduction time was normal in patients ( p>0.32) but based on N20 latency, the central conduction time (between spinal cord and parietal cortex) was found to be slower (p<0.05). Significant correlation was found between DTI metrics and N9 amplitude (p<0.05). Altered SEPs were also correlated with the disease duration (p<0.05). Taken together, spinal imaging and electrophysiology helped to identify∼85% of patients with subclinical sensory defect while separated methods revealed abnormal values in∼60%.
Conclusions:Sensory impairments have been underestimated at early stages of ALS. These results show for the first time the interest to combine electrophysiology and imaging to assess non-motor system involvement in ALS.
Trial registration number:IDRCB2012-A00016-37.
INTRODUCTION
Amyotrophic lateral sclerosis (ALS) is the most common motor neuron disease charac-terised by degeneration of upper as well as lower motor neurons. Postmortem anatomo-pathology has also revealed degeneration of sensory fibres but to a lesser extent than motor axons, and it has been suggested that the sensory system might be similarly affected as the motor system, but the degeneration is less advanced at the time of death.1–3 Peripheral and central degeneration of sensory pathways have also been reported in presymptomatic ALS mice, suggesting that the sensory defect occurs at a very early stage of the degenerative process.4–6 Accordingly, sensory nerve biopsy7 and multiparametric spinal imaging of the dorsal column8 have revealed subclinical anatomical damage in patients, including those at an early disease stage after diagnosis. From a pathophysio-logical perspective, the role of sensory
Strengths and limitations of this study
▪ For the first time, spinal diffusion tensor imaging (DTI) and electrophysiological recordings were coupled to evaluate the anatomofunctional prop-erties of sensory pathways in humans. This com-bined approach and the normalisation of somatosensory evoked potentials revealed sub-clinical sensory defects in 85% patients with amyotrophic lateral sclerosis (ALS).
▪ The anatomical damages of dorsal columns revealed by spinal DTI were correlated to the depression of the peripheral afferent volley revealed by the lower amplitude of N9 which further supports the fact that sensory defects can occur at an early stage of ALS.
▪ Subclinical sensory impairments can manifest in ALS and should no longer cause doubt on the diagnosis. The defect was correlated to the disease duration but a follow-up study would confirm the progressive sensory affection.
involvement in the degenerative process in ALS is still unknown. From a clinical perspective, while discreet sensory clinical impairment does not exclude ALS diag-nosis, it is declared atypical or even excluded when sensory abnormalities are major.9 10 Because of these uncertainties, better characterisation of the sensory involvement in well-characterised populations of ALS is needed.
Sensory nerve action potentials (SNAPs) and somato-sensory evoked potentials (SEPs), routinely used to assess sensory pathways, have been investigated exten-sively in patients with ALS. Except in three studies,11–13 abnormal SEPs were reported, on average, in about 1/3 patients without clinical sensory deficits.7 14–22 The abnormality increases with disease severity,20 23–28and is more common when stimulating lower limb peripheral nerves than those of upper limbs.16 17 25 29However, the anatomical substrate of altered SEPs demonstrated in previous studies remains disputed. Indeed, altered cor-tical SEPs were not always associated with abnormal SNAPs and/or cervicobrachial SEPs (N9). Moreover, altered SNAPs were most often observed in patients exhibiting sensory signs or symptoms, or were some-times related to associated medical conditions (
poly-neuropathy, median or ulnar nerve entrapment
neuropathies).12 20 25 27–30 In line with this, the various components of cortical SEPs are not altered unequally, whether in amplitude and/or latency, and given the multiple origins of the SEP components,31 some authors have suggested that abnormal SEPs in ALS are not due to sensory defects but to abnormal cortico-cortical interactions.24 32
Until now, it has therefore been difficult to establish a link between anatomical and functional alterations of sensory pathways in ALS, given that the latter are based on SEPs, that depends on peripheral afferent inputs and cortico-subcortical excitability.31 Moreover, the origin of the neural sources, discrimination of which is based on the latency of SEP components, becomes uncertain when SEPs are delayed. Thus, the aim of the present work was to test, in typical patients with ALS with distal motor dys-functions in upper limbs and no sensory symptoms, whether abnormal metrics of dorsal column imaging are associated with altered SEPs, with a focus on N9 and N20 components, which depend mainly on the peripheral afferent volley.31 In addition, to control for experiment-dependent variability of electrophysiological measure-ments, a limitation for the interpretation of previous studies, we propose to normalise SEP amplitude to improve evaluation of interindividual differences, as per-formed when studying muscular recordings.33
METHODS Participants
Inclusion criteria were: (1) probable or definite ALS according to the El Escorial criteria, (2) absence of
sensory symptoms or signs (normal touch,
proprioception and nociception), (3) motor weakness in hand muscles (median and ulnar nerve territories) on the electrophysiologically explored side and (4) absence of medical conditions associated with peripheral neur-opathy (eg, diabetes, alcoholism, neurotoxic drugs, nerve entrapment, neuropathy). Twenty one patients with ALS were enrolled in the study (all but one spor-adic; 5 females, 56.3±2 years old, range 37–76) and 21 aged- and gender-matched neurologically intact par-ticipants (controls; 5 females, 56.6±2.1 years old, range 33–73). The disease duration from the onset of weak-ness was 26.6±3.6 months. All patients but one were treated with riluzole (100 mg/day) and α-tocopherol (1000 mg/ day). Clinical measures included manual muscle testing, total Amyotrophic Lateral Sclerosis Functional Rating Scale (ALSFRS)-R and assessment of hand motor performance by the ALSFRS-R subscore for handwriting, hand muscles testing and the nine hole peg test (table 1).
Spinal diffusion tensor imaging
Image acquisitions were performed using a 3 T MRI system (TIM Trio, Siemens Healthcare, Erlangen, Germany) and neck/spine coil. Cardiac-gated diffusion tensor imaging (DTI) was performed using a single shot echo-planar imaging (EPI) sequence with monopolar scheme. The axial slice was positioned perpendicular to the spinal cord, in the middle of each vertebral level between C2-T2 vertebral levels (8 slices) but the acquisi-tion was optimised for C5-T1 (figure 1A). Imaging para-meters were:field of view =128 mm, TR/TE=700/96 ms, voxel size =1×1×5 mm3, parallel acquisition: R=2, b-value 1000 s/mm2, 64 directions, 2 repetitions, acquisition time 10 min. For a comprehensive description of the MRI acquisition parameters, the readers are invited to refer to a previous paper.34
Electrophysiology
Electrophysiological investigations were performed the same day as the MRI in each participant. Median and ulnar nerves were stimulated (1 ms rectangular electrical stimulation; DS7A, Digitimer Ltd, Hertfordshire, UK) at the wrist level using bipolar surface electrodes (0.5 cm2, 1 cm apart). All controls were stimulated on the domin-ant side, according to The Edinburgh handedness inven-tory;35 right side in 20 participants and left side in 1. Patients with ALS were stimulated on the most affected side (distal hand weakness) or on the dominant side when both sides were equally affected: 17 patients were stimulated on the dominant right side, 1 patient on the dominant left side and 3 patients on the left non-dominant but more affected side. Perceptual and motor thresholds (PT and MT, respectively; figure 2) were esti-mated in both nerves. Stimulus intensity was then adjusted at 9×PT in each subject. A recording surface electrode was stuck in the supraclavicular fossa (Erb’s point) ipsilateral to the stimulations with a reference elec-trode on the contralateral supraclavicular fossa. A needle electrode was inserted in the scalp, 4 cm lateral and 2 cm
posterior from Cz, in front of the primary somatosensory cortex (S1) contralateral to the stimulations with a surface electrode for a reference on the ipsilateral ear lobe. Electrophysiological signals were filtered (band-width 30–3000 Hz) and amplified (×10 000; D360
8-Channel Patient Amplifier, Digitimer Ltd,
Hertfordshire, UK) before being digitally stored (2 kHz sampling rate) on a personal computer for offline ana-lysis (Power 1401 and Signal Software, CED, Cambridge, UK). Each recording session consisted of 200 ulnar nerve and 200 median nerve stimuli alternated randomly (2 Hz). Three recording sessions were performed for each participant.
Data analysis DTI
Motion correction was applied slice-by-slice using FSL FLIRT with three degrees of freedom (Tx, Ty, Rz). Diffusion tensor and its related metrics, fractional anisot-ropy (FA), axial (λ⁄⁄) and radial (λ⊥) and mean diffusivity
(MD), were estimated on a voxel-wise basis. The region of interest (ROI), limited to the hemidorsal region ipsilat-eral to the electrical stimulations, was manually defined on each slice using geometry-based information. To avoid any user bias, the ROI was defined on the mean diffusion weighted images by an experienced segmentation oper-ator (MMEM;figure 1A).8 34Furthermore, during ROIs
classification, the operator opted for a conservative approach by excluding pixels that were at the cord/corti-cospinalfluid or white matter/grey matter interfaces.
Electrophysiology
Peak latencies of N9 (Erb’s point) and N20 (parietal) were evaluated in each subject. The peripheral conduc-tion velocity (CVp) was calculated according to the distance between stimulating electrodes and C7 vertebra and N9 latency. The central conduction velocity (CVc) was calculated according to the distance between C7 and parietal cortex and the difference between N9 and N20 latencies. Peak-to-peak amplitude of N9 (figure 3A, B) and amplitude of the first positivity of N20 (figure 3C, D) were measured and normalised to the prestimulus activity (calculated over a 100 ms period, excluding the stimulus artefact). Given the variability of prestimulus activity, the SD of prestimulus activity was calculated and multiplied by 2 (2×SD) to define the positive and negative limits of background activity (dotted lines in figure 3A, D). This procedure is com-monly used to determine when the activity significantly changes from background activity after stimuli. Because these limits give a good estimation of prestimulus activity amplitude, we used the procedure to normalise the amplitude of SEPs.
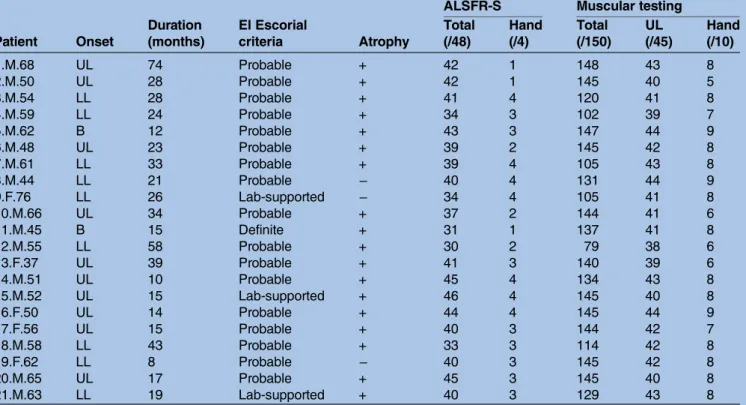
Table 1 Clinical data
ALSFR-S Muscular testing Patient Onset Duration (months) El Escorial criteria Atrophy Total (/48) Hand (/4) Total (/150) UL (/45) Hand (/10) 1.M.68 UL 74 Probable + 42 1 148 43 8 2.M.50 UL 28 Probable + 42 1 145 40 5 3.M.54 LL 28 Probable + 41 4 120 41 8 4.M.59 LL 24 Probable + 34 3 102 39 7 5.M.62 B 12 Probable + 43 3 147 44 9 6.M.48 UL 23 Probable + 39 2 145 42 8 7.M.61 LL 33 Probable + 39 4 105 43 8 8.M.44 LL 21 Probable − 40 4 131 44 9 9.F.76 LL 26 Lab-supported − 34 4 105 41 8 10.M.66 UL 34 Probable + 37 2 144 41 6 11.M.45 B 15 Definite + 31 1 137 41 8 12.M.55 LL 58 Probable + 30 2 79 38 6 13.F.37 UL 39 Probable + 41 3 140 39 6 14.M.51 UL 10 Probable + 45 4 134 43 8 15.M.52 UL 15 Lab-supported + 46 4 145 40 8 16.F.50 UL 14 Probable + 44 4 145 44 9 17.F.56 UL 15 Probable + 40 3 144 42 7 18.M.58 LL 43 Probable + 33 3 114 42 8 19.F.62 LL 8 Probable − 40 3 145 42 8 20.M.65 UL 17 Probable + 45 3 145 40 8 21.M.63 LL 19 Lab-supported + 40 3 129 43 8
Patient: rank.gender (F, female; M, male).age (years old); Onset: first clinical signs manifested in upper limb (UL) or lower limb (LL) or bulbar (B); Duration of the disease in months; El Escorial criteria for amyotrophic lateral sclerosis (ALS): definite ALS (Definite), clinically probable ALS (Probable), Clinically probable—laboratory supported ALS (Lab-supported); Atrophy observed (+) or not (−) on the side explored during the electrophysiological investigations; ALSFR-S: total score of the revised ALS functional resting scale (Total/maximal score 48) and for handwriting (Hand/4); Muscular testing: in upper and lower limbs and in the neck (Total/150), on the side explored during the
Statistics
First, each DTI and electrophysiological metric was inde-pendently compared between groups using unpaired t tests. Then, the metrics found to be significantly modi-fied in patients were retained for further analyses to test the relationships between these metrics and clinical fea-tures for the group of participants. Thus, multiple regres-sion analyses were performed to test the link betweenλ⊥,
MD, N9, N20 and CVc according to the subject groups. In addition, Pearson correlation analyses were performed to investigate the relationships between clinical features and λ⊥, MD, N9 and N20. The 95% CI of control data
was calculated for DTI and electrophysiological metrics. These intervals were used to fix the limits of normal values in order to identify the patients exhibiting abnor-mal data with a risk of error less than 5%. Statistical ana-lysis was conducted using StatEL software (http://www. adscience.eu) and the significance level was set at p value <0.05. Arithmetical means are indicated ±1SEM.
RESULTS
Spinal DTI metrics
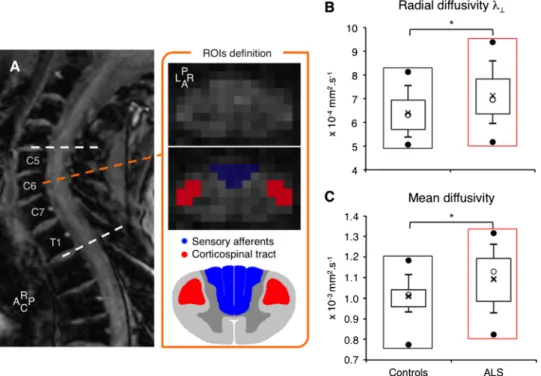
The box plot charts infigure 1B, C show the distribution ofλ⊥and MD, respectively, in the hemidorsal region of
the spinal cord, corresponding to the posterior
column-medial lemniscus pathway ipsilateral to electrical stimuli delivered when investigating SEPs (see below), in 20 controls and 19 patients (due to artefacts, 1 control and 2 patients were excluded). On average, both metrics were significantly higher in patients than in controls (unpaired t test, p<0.05). Abnormal values of λ⊥ and
MD were observed in 11/19 patients (57.9%). The dif-ferences in λ⊥ and MD were not accompanied by a
sig-nificant change in FA or λ⁄⁄ ( p=0.29 and 0.06,
respectively).
Similar analyses were also performed on the lateral region corresponding to the lateral corticospinal tract. On average, λ⊥ and MD were also higher in patients
than in controls ( p<0.01 and 0.05, respectively) and FA was smaller ( p<0.05); λ⁄⁄ was not significantly different
between groups ( p=0.42).
Electrophysiological measurements
Figure 2 shows the mean PT and MT for median and ulnar nerves in controls and patients. While PT for both nerves was similar between controls and patients ( p=0.93 and 0.73 for median and ulnar nerves, respect-ively;figure 2A), MT was higher in patients, reaching the statistically significant level for the ulnar nerve (p<0.05 and 0.12 for the median nerve;figure 2B). The stimulus
Figure 1 Spinal diffusion tensor imaging metrics. (A) T2-weighted MRI sagittal slice (rostro (R)—caudal (C) axis) and mean diffusion-weighted images (C6 vertebra level) in one patient with amyotrophic lateral sclerosis (ALS). For each level between C5 and T1 (dashed white lines), the posterior (P, in blue) and left (L) and right (R, in red) region of interests (ROIs) were drawn manually on the mean diffusion-weighted images to include most of the posterior column-medial lemniscus pathway (sensory pathways) and lateral corticospinal tracts (motor pathways), respectively. The posterior ROI was split in two parts for the right and left side of the spinal cord, according to the antero (A)—posterior axis and the slice centre of mass. Box plot charts showing distribution of data for the radial (B) and mean diffusivity (C) in controls (black rectangles) and in patients with ALS (red rectangles): the top and bottom line of the box correspond to the 75th centile (top quartile) and 25th centile (bottom quartile), respectively, and the open circle in the box, to the 50th centile (median). The two bars extend from the 10th centile (bottom centile) to the 90th centile (top centile). The bar caps delimit outliers. The top and bottom filled circles indicate the maximum and minimum values, respectively. The cross within the box indicates the arithmetical mean. *p<0.05.
intensity used for evoking SEPs (9×PT) was above MT for both nerves in all controls and in 16/21 patients for the median nerve and in 18/21 patients for the ulnar nerve.
Significant difference between groups was not observed in peak latency for N9 (for which one patient was excluded because of artefacts) nor for N20 (table 2; 0.25<p<0.93). N9 latency only depended on the periph-eral conduction time (between stimulating electrodes and Erb’s point) and was thus used to estimate the CVp. For both nerves, the CVp was found to be similar in patients and controls ( p=0.56 and 0.32, in median and ulnar nerve, respectively). The CVc (between spinal cord and parietal cortex) was estimated by subtracting N20 and N9 latencies. It was slower in patients than in controls, reaching statistical significance for the median nerve only ( p<0.05, and 0.08 for the ulnar nerve).
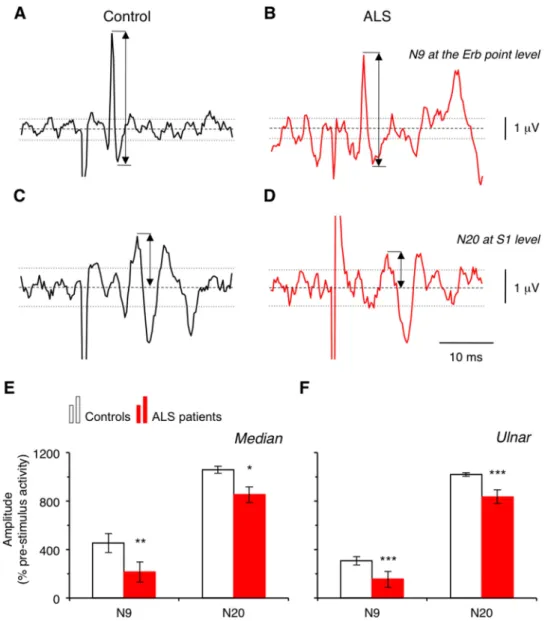
Figure 3A, D shows the raw signals in one control (AC) and 1 patient (BD). Both N9 (AB) and N20 (CD) were smaller in the patient compared to the control. On average, the raw amplitude (inμV) of both N9 and N20 was smaller in patients than in controls, but the differ-ence did not reach statistical significance (0.16<p<0.42;
table 2). When normalised, the difference between groups became significant (p<0.01 and 0.001 for N9 in
median and ulnar nerve, respectively, and p<0.05 for N20; figure 3E, F), which confirmed that the peripheral volley (N9) and the first component of early cortical SEP (N20) were smaller in the patient group. No signi fi-cant correlation was observed between the amplitudes of N9 and N20 (Pearson, p=0.67).
Abnormal N9 was observed in 17/20 patients (85%) for the ulnar nerve and in 9/20 patients (45%) for the median nerve. Abnormal N20 was observed in 11/21 patients (52.4%) for the ulnar nerve and in 10/21 patients (47.6%) for the median nerve. On average, the SEP normalisation helped to identify 57.5% of patients with abnormal values while 41.3% exhibited abnormal raw data (inμV).
Relationships between DTI and electrophysiological metrics
The scatter plots in figure 4 show the dispersion of N9 and N20 amplitudes according to MD (dorsal column ipsilateral to stimulation site) for controls and patients, for median as well as ulnar nerves (Dixon test did not detect any aberrant values). Multiple regression analyses further confirmed the significant difference between groups, in N9 and N20 amplitudes. In addition, signi fi-cant relationships were found between DTI metrics and N9 (except forλ⊥and N9 from ulnar) but not with N20
(see statistics in table 3). Similarly, significant relation-ships were observed between the CVc and λ⊥ ( p<0.05)
and MD ( p<0.01) for the median nerve.
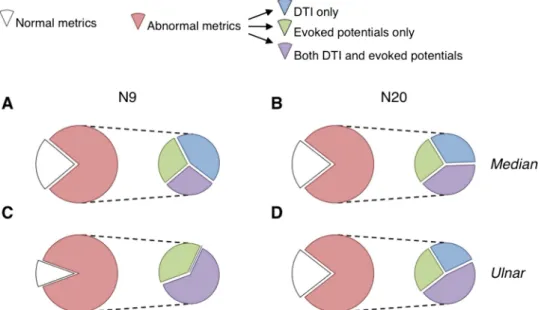
Figure 5 shows that a larger proportion of patients exhibited abnormal DTI metrics and/or evoked poten-tials (84.7±3.8% on average; red portion) compared to patients having normal metrics (white portion). Among the patients exhibiting at least one abnormal metric, 44.4±7.1% have both abnormal DTI and evoked poten-tials ( purple subportions). Similar proportions were found when comparing the DTI metrics and the CVc.
Correlation with clinical features
Multiple regression analyses were performed to investi-gate the relationships between DTI and electrophysio-logical metrics and clinical features. λ⊥, MD, N9 and
N20 were not correlated with any clinical features related to hand motor performance (ALSFRS-R sub-score for handwriting, hand muscle testing, nine hole peg test; 0.27<p<0.79).
Pearson correlation analyses revealed a significant depres-sion of N20 according to the disease duration (R2=0.17 and 0.15 for ulnar and median nerve, respectively; p<0.05). N9 significantly decreased with disease duration for median nerve only (R2=0.19, p<0.05; R2=−0.05, p=0.74 for ulnar nerve). No significant relationship was found between disease duration and spinal DTI metrics (p>0.3).
DISCUSSION
The main result of the present study is that by coupling spinal DTI and electrophysiology, almost 85% patients with ALS with subclinical sensory defect in an upper
Figure 2 Perceptual and motor threshold for median and ulnar nerve stimuli. Mean perceptual (A) and motor (B) thresholds for median nerve (left columns) and for ulnar nerve (right columns) estimated in the group of controls (open columns) and of patients with amyotrophic lateral sclerosis (red columns). Vertical bars are ±1 SEM. *p<0.05.
limb could be identified. Considered separately, each technique revealed abnormal values in less than 60% patients. The second novelty of this study is that normalisation helped to identify more patients with abnormal SEP from a 40% detection rate when expressed in μV, to 60% when taking into account the level of prestimulus activity. This study has also shown a significant relationship between DTI metrics and N9, and a significant depression of evoked potentials with disease duration.
Reliability of spinal DTI
Spinal DTI metrics were found to be significantly altered in patients, which gives further support for early anatom-ical damage of the dorsal columns in ALS. Compared to our previous study,8 the patients in the present study
exhibited less motor weakness especially in proximal upper limb muscles. Accordingly,λ⊥for the lateral
corti-cospinal tracts was lower in the present study compared to the previous one, which supports a less severe impair-ment of the motor pathways in the patients investigated here. Moreover, while the relationship between motor and sensory deficits has not been characterised so far, some studies have reported increased SEP alteration with the disease severity.20 23–28Given that the degener-ation is likely to be slower in sensory pathways than in motor pathways,2one would expect a smallerλ⊥for the
dorsal columns in the present study, compared to the previous one,8which was the case. Thus, the comparison between the two studies indicates that spinal DTI is a reliable and very sensitive method for detecting anatom-ical tract defects at spinal level.
Figure 3 N9 and N20 amplitude. Raw signal (inμV) from recordings at the Erb point level (A and B) and at cortical level (in front of S1, C and D) in one healthy subject (control, A and C; black lines) and in one patient with amyotrophic lateral sclerosis (ALS, B and D; red lines). Dashed lines indicate the 0 level. Upper and lower dotted lines indicate +2×SD and−2×SD levels, respectively. Group data showing the mean amplitude of N9 (left) and of N20 (right) normalised to prestimulus activity in controls (open columns) and in patients with ALS (red columns) after median (E) and ulnar nerve stimulation (F). Vertical bars are±1 SEM. *p<0.05, **p<0.01 and ***p<0.001.
Normalisation of electrophysiological measurements
The amplitude of SNAPs and SEPs produced by mixed nerve stimulation are usually compared using the raw signals expressed inμV. However, it is well known in elec-trophysiology that intrinsic (background activity, individ-ual bioelectrical characteristics) and extrinsic factors (single-use electrodes, whose properties and position can slightly differ across experiments) can influence the
signals, which accounts for the huge interindividual and intraindividual variability of EEG recordings.36 Some studies on visual evoked potentials in humans have revealed the influence of the level of prestimulus EEG activity on the size of the evoked potentials and reported better reliability with normalised data.37 38 Here, SEPs were normalised to 2×SD of prestimulus activity, which is commonly used to evaluate the level of activity before conditioning, and to determine when the poststimulus signal deviates significantly from background activity. Normalisation of evoked potentials to this value allowed the basal activity to be taken into account and reduced the variability due to noise. Comparison of normalised data strengthened the differences between groups, helped to identify more patients with abnormal values and indicated a greater mean suppression from 20% (in raw data) to 50% (when normalised) for N9 and <5% to 20% for N20 (according to the mean values in controls). The comparison of raw and normalised data suggests that abnormal SNAPs and SEPs in ALS might have been previously underestimated.
Alteration of peripheral volleys
Histological evidence for sensory nerve degeneration has only been found in lower limbs with sural nerve biopsies.3In upper limbs, abnormal SNAPs were found
mainly in patients with clinical sensory
signs.7 12 20 25 27 29 30 To some extent, we found analo-gous results because the characteristics of N9 (Erb’s
Table 2 N9 and N20 characteristics
Median Ulnar
Controls ALS Controls ALS N9 Latency 10.7±0.2 10.8±0.2 11.4±0.2 11.3±0.2 CVp 65.9±0.9 66.6±0.7 62.1±0.9 63.5±1.1 Amplitude 6.1±0.5 5.1±0.5 5.3±0.8 4.2±0.4 N20 Latency 19.0±0.4 19.5±0.3 19.2±0.3 19.6±0.3 CVc 31.5±1.2 28.3±1.0* 33.4±1.4 30.3±1.2 Amplitude 7.4±0.2 7.2±0.2 7.4±0.2 7.0±0.2 Latency: mean peak latency (ms±1 SEM) of N9 recorded at the Erb point, and of N20 recorded at the level of primary
somatosensory cortex (S1) for median and ulnar nerves, in controls and patients with amyotrophic lateral sclerosis. CVp: peripheral conduction velocity (m/s±1 SEM) according to N9 peak latency and the distance between stimulation site and C7 vertebra. CVc: central conduction velocity (m/s±1 SEM) according to the difference between N20 and N9 peak latencies and the distance between C7 vertebra and recording site, in front of S1. Amplitude: peak-to-peak amplitude of N9 and peak amplitude of N20 (μV). *p<0.05.
Figure 4 Relationships between diffusion tensor imaging and electrophysiological metrics. N9 (A and C) and N20 (B and D) amplitude (% 2×SD of the prestimulus activity) plotted against the mean diffusivity (×10−3mm2/s) for median nerve (A and B) and for ulnar nerve (C and D). Each open circle represents one control and each red circle, one patient with amyotrophic lateral sclerosis.
point) were as in controls: similar peak latency and similar CVp with no significant change in the mean raw amplitude (in μV). However, abnormal raw values were observed in 20–50% of patients and the normalisation strengthened the difference between groups, which further supports subclinical peripheral abnormalities.27 Our group of patients was very homogenous in regard to hand muscle weakness in the median and ulnar nerve territories, which might account for the higher propor-tion of patients exhibiting abnormal N9 compared to previous studies.21–23Alternatively, a reduced antidromic volley in motor axons may account for N9 depression. However, a study performed in patients with pro-nounced or complete loss of motor axons in the median nerve failed to reveal any change in N9.39 According to
hand motor weakness, we found a higher MT in patients and, in some, the conditioning stimuli used to evoke SEPs were below MT. However, these patients did not exhibit the smallest N9 and there was no link between abnormal N9 values and MT. Lastly, the relationship between spinal DTI and N9 further supports the fact that the latter depends mainly on the peripheral sensory afferent volley31and its alteration in ALS.
Origin of the impairments along the sensory pathways
The present changes in spinal DTI metrics give further evidence for anatomical impairments of sensory path-ways in ALS. The alteration of N9 amplitude, without changes in peripheral conduction velocity, suggests loss of peripheral sensory axons.3–6
Table 3 Results of multiple regression analyses
Regression Group λ⊥ MD Residuals
Median N9 0.27 0.013* 212.3 0.025* 2.04×10+6 0.05* −1.96×10+6 0.024* 673.4 0.14 N20 0.13 <0.05* 290.8 <0.014* 1.87×10+6 0.14 −1.21×10+6 0.24 491.4 0.38 Ulnar N9 0.39 <0.001*** 136.4 <0.01** 7.51×10+5 0.1 −8.40×10+5 0.028* 392.0 0.06 N20 0.21 <0.034* 241.8 <0.014* 1.96×10+6 0.06 −1.34×10+6 0.12 629.9 0.18 Regression: R2and p value of multiple regression for N9 and N20 produced by median or ulnar nerve stimuli. Group: effect of the group of participants (amyotrophic lateral sclerosis vs controls), coefficient and p value.λ⊥: Effect of the radial diffusivity, coefficient and p value. MD: effect of the mean diffusivity, coefficient and p value. Residuals: coefficient and p value of the constant.
*p<0.05, **p<0.01 and ***p<0.001.
Figure 5 Patient data distribution. Proportion of patients exhibiting normal (white portion) and abnormal diffusion tensor imaging (DTI) metrics and/or abnormal amplitude of N9 (A and B) or N20 (C and D; red portion) for the median (A and B) and ulnar nerve (C and D). Among the patients with abnormal metrics (red portion), the proportion of patients with abnormal DTI metrics only (and thus normal evoked potentials) is illustrated by the blue subportion, the proportion of patients with abnormal evoked potential only (and thus normal DTI) is illustrated by the green subportion, and the proportion of patients with abnormal DTI metrics and abnormal evoked potentials is illustrated by the purple subportion.
The first cortical component N20 was delayed and depressed to a lesser extent than N9. The absence of cor-relation between the alterations of N9 and N20 can be explained by the fact that at a stimulus intensity producing maximal N20, N9 reached half its maximal size, and this intensity can be at or slightly above MT.40 Therefore, at the stimulus intensity we used (9×PT, which was above MT in most participants), N20 was likely to be maximal and, because of saturation, the measurements might have been less sensitive at a cortical level than at a peripheral level. However, N20 not only depends on the sensory afferent inputs, but also to central processing.40 Accordingly, a recent cerebral MRI study has shown atrophy in the thal-amus,41 suggesting that the thalamocortical relay for sensory information may be altered in ALS. In line with this, we found a slower CVc in patients than in controls, without any change in CVp. Therefore, abnormal N9 and N20, together with impaired spinal DTI reported here, give strong evidence for subclinical sensory defects in ALS at peripheral as well as central levels.
Comparing median nerve and skin stimuli suggests that N20 mainly depends on cutaneous inputs to the 3b area.31 42–44Thus, altered N20 from median nerve stimu-lation could suggest impaired cutaneousfibres. However, if low-threshold cutaneous afferents were affected, this would have influenced PT, which was found unchanged. Alternatively, changes could be due to proprioceptive afferents. Cutaneousfields innervated by median nerve are larger than those innervated by ulnar nerve but 75% intrinsic hand muscles are innervated by ulnar nerve. Additionally, SEPs from mixed nerves in lower limbs, probably more motor than the median nerve (such as ulnar nerve), are mainly produced by proprioceptive afferents.45 Therefore, impaired proprioceptive inputs would affect SEPs produced by ulnar nerve more than those produced by median nerve, which was the case.
The absence of clinical sensory signs, of correlation between sensory defect and motor symptoms and the fact that DTI metrics for the lateral corticospinal tract were more affected than those for the dorsal columns suggest that the impairment of sensory pathways was less than that of motor systems. However, the correlation with disease duration suggests that the degeneration of sensory pathways is progressive.
CONCLUSIONS
The combination of normalised electrophysiological measurements and spinal DTI metrics suggest that sensory deficits in ALS have been previously underesti-mated and gives further evidence for early degeneration in sensory pathways at peripheral as well as central levels. These results show, for the first time, the benefit of combining electrophysiology and biomedical imaging to assess non-motor system involvement in ALS.
Author affiliations
1Sorbonne Universités, UPMC Univ Paris 06, CNRS, INSERM, Laboratoire d’Imagerie Biomédicale, Paris, France
2Département des Maladies du Système Nerveux, AP-HP, Hôpital Pitié-Salpêtrière, Paris, France
Acknowledgements The authors thank Dr N Leforestier, Dr T Lenglet, Dr F Salachas, Dr G Bruneteau and Dr V Meininger for their help in patient recruitment, and Dr R Morizot-Koutlidis for her help in the experimental design for SEP recordings. They also thank C Macia, K Nigaud, F Humbert and R Valabrègue for their valuable technical assistance during MRI acquisitions, which were performed at CENIR-ICM Hôpital Pitié-Salpêtrière. Their gratitude also goes to S Blancho for her help to obtain the approval of the local ethics committee and for monitoring the project. At last, they deeply thank Dr Anna Hudson (Neuroscience Research Australia) for scrutinising the English.
Contributors VM-P and P-FP were involved in conception and design of research and P-FP in patient selection. CI, SS and VM-P were responsible for acquisition and analysis of electrophysiological data, CI and M-MEM for MRI acquisitions, and M-MEM for DTI analysis. CI, SS, M-MEM and VM-P was responsible for statistical analysis; HB for supervision of MRI and statistical analysis; CI, SS, M-MEM, VM-P and P-FP for interpretation of the data; and CI, M-MEM and VM-P for drafting of the manuscript and figures. All authors have approved the final version of the manuscript.
Funding This work was supported by IRME (ID RCB 2012-A00016-37) and ANR (ANR-12-JSV4-0007-01). CI was supported by a grant from FRM, M-MElM by IHU-A-ICM Pitié-Salpêtrière (ANR-10-IAIHU-06), and SS by a grant from UPMC.
Competing interests None.
Patient consent Obtained.
Ethics approval The study conformed to the standards set by the latest revision of the Declaration of Helsinki and has been approved by the ethics committee of Pitie-Salpetriere Hospital (CPP-Ile-de-France VI).
Provenance and peer review Not commissioned; externally peer reviewed.
Data sharing statement No additional data are available.
Open Access This is an Open Access article distributed in accordance with the Creative Commons Attribution Non Commercial (CC BY-NC 4.0) license, which permits others to distribute, remix, adapt, build upon this work non-commercially, and license their derivative works on different terms, provided the original work is properly cited and the use is non-commercial. See: http:// creativecommons.org/licenses/by-nc/4.0/
REFERENCES
1. Kawamura Y, Dyck PJ, Shimono M, et al. Morphometric comparison of the vulnerability of peripheral motor and sensory neurons in amyotrophic lateral sclerosis.J Neuropathol Exp Neurol 1981;40:667–75.
2. Averback P, Crocker P. Regular involvement of Clarke’s nucleus in sporadic amyotrophic lateral sclerosis.Arch Neurol1982;39:155–6. 3. Bradley WG, Good P, Rasool CG, et al. Morphometric and
biochemical studies of peripheral nerves in amyotrophic lateral sclerosis.Ann Neurol1983;14:267–77.
4. Guo YS, Wu DX, Wu HR, et al. Sensory involvement in the SOD1-G93A mouse model of amyotrophic lateral sclerosis.Exp Mol Med2009;41:140–50.
5. King AE, Blizzard CA, Southam KA, et al. Degeneration of axons in spinal white matter in G93A mSOD1 mouse characterized by NFL and alpha-internexin immunoreactivity.Brain Res
2012;1465:90–100.
6. Sabado J, Bado J, Casanovas A, et al. Accumulation of misfolded SOD1 in dorsal root ganglion degenerating proprioceptive sensory neurons of transgenic mice with amyotrophic lateral sclerosis. BioMed Res Int2014;2014:e852163.
7. Hammad M, Silva A, Glass J, et al. Clinical, electrophysiologic, and pathologic evidence for sensory abnormalities in ALS.Neurology 2007;69:2236–42.
8. Cohen-Adad J, Mendili MME, Morizot-Koutlidis R, et al. Involvement of spinal sensory pathway in ALS and specificity of cord atrophy to lower motor neuron degeneration.Amyotroph Lateral Scler Front Degener2013;14:30–8.
9. De Carvalho M, Dengler R, Eisen A, et al. Electrodiagnostic criteria for diagnosis of ALS.Clin Neurophysiol2008;119:497–503. 10. Pouget J. Critères électro-neuro-myographiques de la sclérose
latérale amyotrophique. Rev Neurol Paris 2008;162:4S34–42. 11. Wirguin I, Brenner T, Argov Z, et al. Multifocal motor nerve
conduction abnormalities in amyotrophic lateral sclerosis.J Neurol Sci1992;112:199–203.
12. De Carvalho M, Swash M. Nerve conduction studies in amyotrophic lateral sclerosis.Muscle Nerve2000;23:344–52.
13. Machii K, Ugawa Y, Kokubo Y, et al. Somatosensory evoked potential recovery in Kii amyotrophic lateral sclerosis/parkinsonism– dementia complex (Kii ALS/PDC).Clin Neurophysiol
2003;114:564–8.
14. Anziska BJ, Cracco RQ. Short-latency somatosensory evoked potentials to median nerve stimulation in patients with diffuse neurologic disease.Neurology1983;33:989–93.
15. Bosch EP, Yamada T, Kimura J. Somatosensory evoked potentials in motor neuron disease.Muscle Nerve1985;8:556–62.
16. Matheson JK, Harrington HJ, Hallett M. Abnormalities of multimodality evoked potentials in amyotrophic lateral sclerosis. Arch Neurol1986;43:338–40.
17. Radtke RA, Erwin A, Erwin CW. Abnormal sensory evoked potentials in amyotrophic lateral sclerosis.Neurology 1986;36:796–801.
18. Zanette G, Polo A, Gasperini M, et al. Far-field and cortical somatosensory evoked potentials in motor neuron disease.Muscle Nerve1990;13:47–55.
19. Shefner JM, Tyler HR, Krarup C. Abnormalities in the sensory action potential in patients with amyotrophic lateral sclerosis.Muscle Nerve 1991;14:1242–6.
20. Constantinovici A. Abnormal somatosensory evoked potentials in amyotrophic lateral sclerosis. Romanian J Neurol Psychiatry Rev Roum Neurol Psychiatr 1993;31:273–8.
21. Georgesco M, Salerno A, Carlander B, et al. [Somatosensory evoked potentials in amyotrophic lateral sclerosis and primary lateral sclerosis]. Rev Neurol (Paris) 1994;150:292–8.
22. Ogata K, Tobimatsu S, Furuya H, et al. Sporadic amyotrophic lateral sclerosis showing abnormal somatosensory evoked potentials: a report of three cases. Fukuoka Igaku Zasshi 2001;92:242–50. 23. Lawyer T Jr, Netsky MG. Amyotrophic lateral sclerosis.AMA Arch
Neurol Psychiatry1953;69:171–92.
24. Dustman RE, Snyder EW, Callner DA, et al. The evoked response as a mesure of cerebral dysfunction. In: Begleiter H, ed. Evoked brain potentials and behavior. New York: Plenum Press, 1979:321–63. 25. Cosi V, Poloni M, Mazzini L, et al. Somatosensory evoked potentials
in amyotrophic lateral sclerosis.J Neurol Neurosurg Psychiatry 1984;47:857–61.
26. Gregory R, Mills K, Donaghy M. Progressive sensory nerve dysfunction in amyotrophic lateral sclerosis: a prospective clinical and neurophysiological study.J Neurol1993;240:309–14. 27. Mondelli M, Rossi A, Passero S, et al. Involvement of peripheral
sensory fibers in amyotrophic lateral sclerosis: electrophysiological study of 64 cases.Muscle Nerve1993;16:166–72.
28. Hamada M, Hanajima R, Terao Y, et al. Median nerve somatosensory evoked potentials and their high-frequency oscillations in amyotrophic lateral sclerosis.Clin Neurophysiol 2007;118:877–86.
29. Georgesco M, Salerno A, Camu W. Somatosensory evoked potentials elicited by stimulation of lower-limb nerves in amyotrophic lateral sclerosis.Electroencephalogr Clin Neurophysiol
1997;104:333–42.
30. Schulte-Mattler WJ, Jakob M, Zierz S. Focal sensory nerve abnormalities in patients with amyotrophic lateral sclerosis.J Neurol Sci1999;162:189–93.
31. Mauguiere F. Somatosensory evoked potentials: normal responses, abnormal waveforms, and clinical applications in neurological diseases. In: Niedermeyer E, Lopez da Silva F. eds.
Electroencephalography: basic principles, clinical applications, and related fields. Philadelphia, PA, USA: Lippincott Williams & Wilkins, 2005:54.1–54.53.
32. Palma V, Guadagnino M, Brescia Morra V, et al. Multimodality evoked potentials in sporadic amyotrophic lateral sclerosis: a statistical approach. Electromyogsr Clin Neurophysiol 1993;33:167–71.
33. De Luca CJ. A practicum on the use of sEMG signals in movement sciences. 2008. http://www.delsys.com/KnowledgeCenter/Practicum. html.
34. Cohen-Adad J, El Mendili MM, Lehéricy S, et al. Demyelination and degeneration in the injured human spinal cord detected with diffusion and magnetization transfer MRI.NeuroImage 2011;55:1024–33.
35. Oldfield RC. The assessment and analysis of handedness: the Edinburgh inventory.Neuropsychologia1971;9:97–113. 36. Arieli A, Sterkin A, Grinvald A, et al. Dynamics of ongoing activity:
explanation of the large variability in evoked cortical responses. Science1996;273:1868–71.
37. Klistorner AI, Graham SL. Electroencephalogram-based scaling of multifocal visual evoked potentials: effect on intersubject amplitude variability. Invest Ophthalmol Vis Sci 2001;42:2145–52.
38. You Y, Thie J, Klistorner A, et al. Normalization of visual evoked potentials using underlying electroencephalogram levels improves amplitude reproducibility in rats.Invest Ophthalmol Vis Sci 2012;53:1473–8.
39. Sonoo M, Hatanaka Y, Tsukamoto H, et al. N10 component in median nerve somatosensory evoked potentials (SEPs) is not an antidromic motor potential.Clin Neurophysiol2004;115: 2645–9.
40. Gandevia SC, Burke D. Saturation in human somatosensory pathways.Exp Brain Res1984;54:582–5.
41. Bede P, Elamin M, Byrne S, et al. Basal ganglia involvement in amyotrophic lateral sclerosis.Neurology2013;81:2107–15. 42. Gandevia SC, Burke D. Projection of thenar muscle afferents to
frontal and parietal cortex of human subjects.Electroencephalogr Clin Neurophysiol1990;77:353–61.
43. Allison T, McCarthy G, Wood CC, et al. Potentials evoked in human and monkey cerebral cortex by stimulation of the median nerve a review of scalp and intracranial recordings.Brain
1991;114:2465–503.
44. Kunesch E, Knecht S, Schnitzler A, et al. Somatosensory evoked potentials elicited by intraneural microstimulation of afferent nerve fibers. J Clin Neurophysiol 1995;12:476–87.
45. Gandevia S, Burke D, McKeon B. The relationship between the size of a muscle afferent volley and the cerebral potential it produces. J Neurol Neurosurg Psychiatry1982;45:705–10.
amyotrophic lateral sclerosis
evidences for sensory dysfunction in
Electrophysiological and spinal imaging
Benali, Véronique Marchand-Pauvert and Pierre-François Pradat Caroline Iglesias, Sina Sangari, Mohamed-Mounir El Mendili, Habib
doi: 10.1136/bmjopen-2015-007659
2015 5: BMJ Open
http://bmjopen.bmj.com/content/5/2/e007659
Updated information and services can be found at:
These include:
References
#BIBL
http://bmjopen.bmj.com/content/5/2/e007659
This article cites 42 articles, 7 of which you can access for free at:
Open Access
http://creativecommons.org/licenses/by-nc/4.0/ non-commercial. See:
provided the original work is properly cited and the use is
non-commercially, and license their derivative works on different terms, permits others to distribute, remix, adapt, build upon this work
Commons Attribution Non Commercial (CC BY-NC 4.0) license, which This is an Open Access article distributed in accordance with the Creative
service
Email alerting
box at the top right corner of the online article.
Receive free email alerts when new articles cite this article. Sign up in the
Collections
Topic
Articles on similar topics can be found in the following collections (75)Radiology and imaging (269) Neurology
Notes
http://group.bmj.com/group/rights-licensing/permissions
To request permissions go to:
http://journals.bmj.com/cgi/reprintform
To order reprints go to:
http://group.bmj.com/subscribe/