In the footsteps of Mackintosh and Innis:
Tracking Canada's economic centre of gravity since the Great Depression (doi:10.3138/cpp.2018-015)
Sébastien Breau*
McGill University, Department of Geography Montreal, QC
&
Senior Fellow, Donald J. Savoie Institute Moncton, NB
E-mail: sebastien.breau@mcgill.ca *Corresponding author
Brian Toy
McGill University, Department of Geography Montreal, QC
Mark Brown and Ryan Macdonald Statistics Canada, Economic Analysis Division
Ottawa, ON Oliver T. Coomes
McGill University, Department of Geography Montreal, QC
23 August 2018 4 Tables and 4 Figures
Abstract: This paper tracks the historical movement in Canada’s economic centre of gravity (ECG) since the early 20th century. A simple weighted mean centre approach is applied to a novel dataset containing long-run estimates of household income at the provincial level. The analysis reveals that from 1926 to 2013, Canada’s ECG shifted westward by a net distance of 204 km. Concomitant with this broad geographical shift, we identify six distinct historical moments during which major spatial realignments occurred, including a significant west to east move during the Great Depression years and two
important east to west shifts during the energy-driven resource booms of the 1970s and post-2000 period. Time series modeling confirms that the ups and downs of resource commodity prices are indeed strongly associated with historical movements of the ECG in Canada.
Key words: Canada’s economic centre of gravity; westward shift; long-run provincial time series. Mots clés: Centre de gravité de l’économie Canadienne; déplacement vers l’ouest; séries
2 1. Introduction
It has often been said that if some countries have too much history, Canada has too much geography1. In 1923, Mackintosh was one of the first commentators to claim that scholars needed to pay more attention to the geographic and economic factors that shape the country’s history. To understand the course of Canada’s westward development, he argued, we need to examine the role played by the production and export of staples. A decade later, this idea would feature prominently in Innis’ (1933) work who argued that much of Canadian economic history could be understood as a series of staples exploitation waves, with different regions of the country developing and contributing more
economically at distinct times. Each wave of staples exploitation was characterized by its own pattern of settlement, linkages to other economic activities, interactions with the centre, and set of institutional arrangements (Brodie 1989). Innis’ staples theory would go on to have a profound impact on Canadian political economy and debates about regional development in the country (see, for instance, Watkins 1963; Economic Council of Canada 1977; Brodie 1989; Savoie 1992; Hayter and Barnes 1990; Barnes et al. 2001; Olewiler 2017).
Questions about the shifting political economic landscape of Canada have resurfaced of late following the post-2000 energy-driven resource boom. In Looking West, Berdahl and Gibbins (2014) argue that after decades of transformative changes, wrought by globalization, technological innovation, resource development, immigration and demographic ageing, the economic and political map of Canada has been redrawn with an ever increasing ‘tipping’ towards the west. Bricker and Ibbitson (2013) refer to the Big Shift to describe concomitant changes in Canada’s socio-economic and political landscape. Whether we like it or not, they argue, what was once a country that was mainly oriented to the Atlantic world is now increasingly becoming part of the Pacific world. Pitts (2008) has gone so far as to describe this westward shift as the “most important economic phenomenon in Canada’s 140-year plus life” (p.12).
3 To document the westward shift, researchers have relied on a battery of economic indicators that generally show an increase in the relative strength of western provincial economies compared to the rest of Canada. Bricker and Ibbitson (2013, p.92), for instance, write, “[i]n 1985, Manitoba, Saskatchewan, Alberta and British Columbia collectively accounted for 32 percent of Canada’s gross domestic product (GDP). In 2010, the figure was 36 percent.” Other studies point to western Canada’s more dynamic labour markets (with lower unemployment rates and higher participation rates than the national average), faster population growth, slower aging demographic, higher levels of private capital investments and a rising proportion of corporate head offices (Beckstead and Brown 2006; Ray et al. 2013; Siddiq and Babins 2013). In the end, the evidence converges towards a commonly held view: the westward shift in the country’s economic centre has been a steady drift, now decades old (Berdahl and Gibbins 2014).
Yet where exactly is Canada’s economic centre of gravity (ECG), just how far west has it shifted over time, and has its movement been smooth or episodic? We seek to answer this question by employing a simple mean centre approach, a technique borrowed from population geographers who have long used it to track changes in a country’s spatial distribution in population. The novelty here is that the mean centre approach we adopt is applied to a new dataset that provides long-term estimates of provincial-level household income figures from 1926 to 2013 (Baldwin and Macdonald 2012;
Macdonald 2015)2. Identifying the ECG and tracking changes in its direction and extent of movement over such a long period provides a new way of exploring and interpreting some of the underlying forces that have shaped Canada’s recent economic history. To that end, and taking a cue from Mackintosh, we examine whether resource booms (busts) are associated with westward (eastward) shifts in Canada’s ECG through time. This is done by assessing the correspondence of boom and bust eras and shifts in the ECG and formally testing the association between changing resource prices (see Macdonald, 2017) and movements of Canada’s ECG.
4 Overall, we find that the country’s ECG shifted from east to west by about 204 km over the 1926 to 2013 period with a slight tilt from south to north of about 35 km. Though the predominant direction of change is indeed towards the west, the shift has been neither slow or steady, but rather episodic and revealingly so. We identify six distinct moments during which there have been major historical
‘realignments’ reflecting changes in the industrial structure and trade activities of different regions. Among these, we identify three periods of west-to-east movements (the single largest one associated with the Great Depression years) and three predominant east-to-west shifts, including the resource-booms of the 1970s and post-2000 era. In turn, these westward and eastward shifts are strongly associated with long-run rises and falls in resource prices. Canada’s economic geography has and continues to be fundamentally tied to its resource base, with oscillations in resource prices profoundly affecting the historical movement of Canada’s economic centre of gravity.
2. Measuring geographic centres
There is a long history of using mean centre points in geographical research to summarize and track how the spatial distribution of population changes over time. In 1874, the US Census Bureau published one of the earliest attempts to determine the country’s centre of population. Defined as the centre of gravity of the country’s population, it was also described as its ‘balance point’ where an imaginary, flat,
weightless and rigid map of the United States would balance perfectly if everyone counted in the census were of identical weight (US Census Bureau 2011; Plane and Rogerson 2015). Since then, with every decennial census, movement in this balance point, or the ‘average location’ of the population (Hayford, 1902), has been tracked to describe the history and geography of settlement in the US, and to
summarize the changing features of population such as the spatial distribution of births, deaths, immigration and emigration. Considerable media attention is given in the U.S. to the publication of this
5 location (Aboufadel and Austin 2006) and it is often listed in popular almanacs and statistical abstracts of various kinds (Rogerson 2015)3.
Recent debates over the impact of globalization and, in particular, the emergence of China as an economic superpower have led economists to employ the concept of a geographical centre of gravity in order to describe the world’s shifting distribution of economic activity. Using a three-dimensional projection (where the origin is given by the Earth’s core) and national GDP figures allocated to 392 cities across the globe, Grether and Mathys (2009) locate the world’s economic centre of gravity (WECG) in the mid-1970s just beneath the north-eastern coast of Iceland. By the mid-2000s, their calculations show that the WECG had shifted eastward to Spitzbergen, an island part of the Svalbard archipelago off the northern coast of Norway roughly 1990 km from Iceland. Using a similar approach with a more extensive dataset (which includes national GDP figures for a larger set of cities along with rural proxies as well), Quah (2011) finds that the WECG shifted approximately 4800 km eastward, from a location in the mid-Atlantic Ocean in 1980 to somewhere close to Izmir (Turkey) by 2008. Extrapolating forward to 2050, Quah (2011) also predicts that the WECG will continue to shift east to eventually lie somewhere between India and China. A similar analysis has yet to be undertaken for Canada.
3. Methodology 3.1. Data sources
The primary economic data used for our analysis come from Statistics Canada’s newly developed long-run estimates of economic variables for provinces (see CANSIM Table 384-5000). This dataset, originally compiled to examine patterns of income convergence across Canadian provinces (see Brown and Macdonald, 2015), links three different vintages of data from the Canadian System of National Accounts to provide a unique time series of historical estimates for household income and consumer prices from
6 1926 to 2013. As key definitions and concepts vary across vintages, the challenge in producing such a time series lies in how the data sources are linked. Here, the historical estimates are linked based on their growth rates: figures from the latest national accounts are projected back through time using the growth rates of the historical estimates going back to 1926. The advantage of using growth rates (and not regression-based estimates) to back-cast through time is that the magnitude of historical events can be preserved (for more details, see Macdonald 2015).
To examine movements in the economic center of gravity, household income is used. Household income is defined as the sum of compensation to employees, net mixed income and net property income, before taxes and transfers. Measured as such, household income reflects production rather than disposable income. While it would be preferable to use gross domestic product (GDP) so as to include gross operating surplus (profits) in the production measure, only household income measures are available over the long period from 1926 to 2013. In order to incorporate the longest time span available, we therefore adopt household income measures.
Household income does follow similar trends to GDP as regions with more capital tend to pay higher wages, and regions that grow more rapidly tend to see more rapid household income growth. The addition of gross operating surplus (profits) tends to accentuate these movements, and to add a larger amplitude to cyclical changes. To the extent, therefore, that the use of household income rather than GDP biases results, they will tend to under-estimate the distance travelled by the economic center of gravity, and to reduce the amplitude of cyclical changes; they can thus be viewed as, at a minimum, a lower bound for the movement4.
We use the nominal rather than real value of household income because nominal incomes induce workers to move across regions, and nominal income is used to demonstrate the relative share of production from one province versus another. Moreover, metrics related to investment or financial reporting, such as rate of return or return on equity, are based on nominal flows which reflect price
7 movements that influence returns. Nevertheless, as a robustness check, the real values were also computed based on a major-city CPI, and the results were found to be consistent5.
3.2. Calculating the economic centre of gravity
Canada’s economic centre of gravity (ECG) is calculated using the weighted mean center of the X and Y coordinates associated with the centroids of each province. More formally, the ECG is defined as:
𝑋𝑋�
𝑡𝑡=
∑ 𝐻𝐻𝐻𝐻𝑖𝑖𝑖𝑖𝑋𝑋𝑖𝑖 𝑛𝑛 𝑖𝑖=1 ∑𝑛𝑛𝑖𝑖=1𝐻𝐻𝐻𝐻𝑖𝑖𝑖𝑖, 𝑌𝑌�
𝑡𝑡=
∑𝑛𝑛𝑖𝑖=1𝐻𝐻𝐻𝐻𝑖𝑖𝑖𝑖𝑌𝑌𝑖𝑖 ∑𝑛𝑛𝑖𝑖=1𝐻𝐻𝐻𝐻𝑖𝑖𝑖𝑖,
where Xi and Yi represent the longitudinal and latitudinal coordinates of each province’s centroid (n = 10
provinces) and HIit the household income level of each province (i.e., its relative economic ‘weight’) at
time t (1926 to 2013). The location of the mean centre will, of course, depend on how it is projected on a two-dimensional surface. Here, we use the cartographic boundary files produced by Statistics Canada which are portrayed in Lambert conformal conic projection and are based on the North American Datum of 1983. As these boundary files depict the standard geographic areas with the shoreline of the major land mass of Canada and its coastal islands, they provide good directional and shape relationships for generating representative points in the mid-latitudes that have a mainly east-to-west extent. In other words, areal distortions, in terms of scale and distance, are minimized throughout the region of interest and will only increase as we move away from the standard parallels (Statistics Canada, 2012 and 2015 for more details).
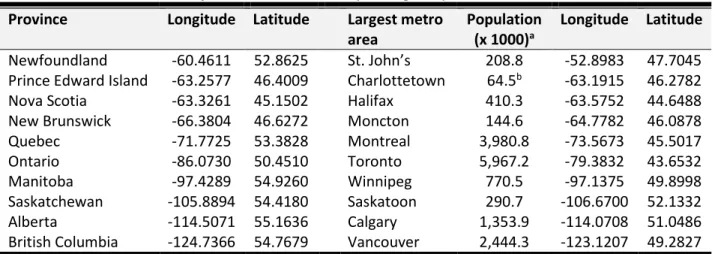
For analytical purposes, the XY coordinates of each province’s centroid are delineated in two different ways. The first approach is based on the common geographic centroid of a province, that is the XY point location representing its geographic centre. The centre is the point at which a physical cut-out of the shape of each province on a flat 2-dimensional map would be perfectly balanced on the head of a
8 pin. Given that the country stretches from east to west across the continent with a discontinuous
ecumene, as an alternate to the geographic centre of each province, our second set of centroid
coordinates is based on the XY centroid location of each province’s largest metropolitan area (according to 2013 population estimates, see Table 1). The rationale is that these metropolitan areas represent the largest economic centres of activities in each province.
[Table 1]
While the ECG can readily be calculated for both of these sets of coordinates, we recognize an important limitation in that they assume the centroid of each province or city is fixed in time. Instead, we know that significant shifts in economic activity occur within each province. To capture intra-provincial shifts, more geographically detailed data on household income would be required. These data are not
currently available over a sufficient period of time6.
4. Results
4.1. Directional shifts in Canada’s ECG
Figure 1 presents the first map of Canada’s ECG based on the geographic centroids of provinces. To facilitate the tracking and interpretation of movements in the country’s ECG, key dates are identified along with major historical shifts in the inset map (see also the timeline presented in Table 2).
The westward shift in Canada’s economic centre of gravity since just prior to the Great
Depression is clearly visible on this map. In 1926, Canada’s ECG was located at a latitude of 52°13'N and longitude of 89°05'W in the northwest corner of the province of Ontario. Specifically, the centre was situated on a small remote island in Totogan Lake, roughly 416 km due north of Thunder Bay (the nearest community, some 44 km east, is Neskantaga First Nation – formerly known as Lansdowne House
9 – on the shores of Attawapiskat Lake). By 2013, Canada’s ECG was located at a latitude of 52°43'N and longitude of 92°01'W, a point close to Windigo Lake approximately 211 km east of the Manitoba border. In terms of distances, the ECG has thus shifted a net 204 km from east to west and slightly north by about 35. The amplitude of this shift over time is even more pronounced when considering the maximum range values (see bottom panel of Table 2) based on the most easterly and southerly
coordinates of the ECG (which are, respectively, in 1931 at a longitude of 87°41'W and 1941 at a latitude of 51°92'N).
[Figure 1 and Table 2]
In many respects, the east-west movement and the south-north movement reflect the same phenomenon. Southern Ontario is the largest regional economy in Canada and it extends below the 49th parallel. As a result, almost any shift east or west would necessitate a north-south adjustment based purely on Canada’s geography. For the purposes of this paper, we focus on the east-west movement in the ECG as it tends to be a better indicator of the tension between differential growth patterns, more so than the north-south movement.
The net westward shift of 204 km is not trivial in terms of magnitude. To put things into
perspective, if we take the straight-line distance (“as the crow flies”) between St. John’s, Newfoundland and Vancouver, British Columbia, as our barometer (a total of 5,005 km), the westward movement represents a 4.1% shift in the ECG7.
Perhaps more interesting than the general trend westward, are moments of directional shifts that mark important eras in Canadian economic history. We observe six major changes in direction that occurred over this nearly 90-year period studied. The first major shift observed takes place from 1926 to 1931 as the ECG moves from west to east by roughly 114 km. Much of this shift occurred between 1928 and 1931 as the Canadian economy was swept into the worldwide downswing of the Great Depression.
10 Although no region was spared (by 1933, one-fifth of the Canadian labour force was without work; see Safarian 2009), the impact of the decline was uneven across the country. At the time, the Canadian economy was still heavily oriented towards agricultural production (see Figure 2). Wheat and wheat flour were the country’s leading exports, accounting for as much as 50% of the world’s total wheat exports in the late 1920s (Easterbrook and Aitken 1975). As prices for these commodities collapsed on world markets, together with a mix of flawed production technologies and poor weather conditions, the Prairie Provinces, which relied heavily on agricultural exports, suffered the most severe drop in incomes (Safarian 2009, p.84).
[Figure 2]
The decline associated with the Great Depression continued until 1933 when the level of annual real GDP reached its low point, down 28% from its pre-depression level in 1929 (Cross and Bergevin 2012). Although it is difficult to speak of a recovery, this period does signal the beginning of a turnaround corresponding to the second directional shift in the ECG. Exports began to rise again as prices for key commodities stabilized and previously imposed restrictions on international trade were eased between Canada and its main trading partners (with the UK following the 1932 Ottawa
Agreements and the US in a series of treaties signed in the mid-1930s providing some concessions to the severe duties under the Smoot-Hawley Act). Growth in the forestry sector (pulp and paper in particular) resumed and the 1934 passing of the Gold Reserve Act in the US (which saw the nominal price of gold re-evaluated from $20.67 to $35 per ounce) led to a gold rush in Canada which propelled the non-ferrous mining sector forward. All told, the country’s ECG shifted from east to west by about 53 km during this slow and – what Safarian (2009) has referred to as – incomplete recovery. The westward shift would progress by another 64 km from 1939 to 1948, as WWII saw the Canadian economy ‘retooled’ to
11 meet the industrial demands of the war effort. Traditional agricultural production expanded, as did metals and manufacturing industries primarily concentrated in Central Canada.
The third directional shift took place from 1948 to 1950 as the province of Newfoundland joined Confederation (officially at midnight on March 31st, 1949). Fisheries, and especially cod, were the primary staple of the provincial economy at the time, and the pulp and paper and mining industries were beginning to thrive. When Newfoundland joined Canada, the country’s ECG moved roughly 44 km eastward.
Interestingly, the period stretching from 1950 to 1970, which can be described as one of robust and sustained economic growth (Nicholson 2003; Norrie et al. 2007), is also characterized by very little movement in the nation’s ECG (barely 1 km in net total movement). For much of the 1950s, natural resources developments and exports continued their expansion. Mining related activities grew rapidly in Quebec (asbestos, gold, copper and lead), Ontario (iron ore, nickel, cobalt), Manitoba (nickel), and Saskatchewan (uranium and new discoveries of potash deposits). Aluminum production was also expanded in Quebec’s Saguenay region and in Kitimat, British Columbia, to serve the fast-growing world aviation industry (Baldwin and Macdonald, 2012). The discovery of crude oil at Leduc, Alberta, in 1947 also marked the beginning of a new era that would eventually see oil and gas activities supplant agriculture as the province’s primary industry.
The short distance oscillations of the ECG continued throughout the 1960s as the rapid expansion of the country’s manufacturing sector forged ahead (this was the heyday of postwar Fordism), especially to the benefit of the Canadian heartland8 where the growing concentration of US branch plants played a prominent role (Courchene and Telmer 1998; Wallace 2002). 1965 was an especially pivotal year as the Canada-US Auto Pact came into effect. An example of ‘managed trade’ (i.e., targeted towards the specific removal of tariffs on new vehicles and original equipment parts between the two countries), the Auto Pact would significantly alter the country’s trade patterns which
12 still remained dominated by natural resources even though their relative importance had gradually fallen over time (see Figure 2)9. The growth of the aerospace, telecommunications and pharmaceutical industries which are predominantly located around the Montreal, Toronto and Ottawa metropolitan areas, also explains the lack of movement in the country’s ECG at the time.
The fourth major realignment of Canada’s ECG – this time to the west – came in the 1970s and can be explained by two major events. On the one hand, western Canada was increasingly feeling the pull of Japan’s rapidly growing economy (which had become the world’s second largest economy) and its thirst for natural resources. Mining activities and pulp and paper mills in British Columbia, in
particular, benefited from the surge in demand from the Asian market (Bradbury 1978). The other major development at the time was on the energy front. While Alberta was already enjoying steady income growth from its oil and gas industries (following the construction of a series of pipelines in the 1950s and the 1961 National Oil Policy which ensured a market for its energy resources), the oil shocks of the 1970s fuelled further growth in the sector. Domestic oil production, buoyed by the 1973 OPEC embargo (which saw the price of Brent crude rise from $2.48 per barrel in 1972 to US$11.58 per barrel in 1974), hit peak output of 114 million cubic meters in 1973 (or roughly 1.96 million barrels per day, a level not seen again until the mid-1990s)10 before levelling off to an average of 90.4 million cubic meters over the remainder of the decade. This surge in production is clearly visible in Figure 2, and coincides with the first energy boom in Canada which translated in a 128 km westward shift in the ECG from 1970 to 1981.
The following decade saw a fifth major directional change take place. After rapid escalations in 1973 and 1979, world oil prices stabilized or declined modestly during the early 1980s before collapsing in 1986. Combined with the National Energy Program, which encouraged greater Canadian ownership of the oil industry and capped the domestic price for oil below international prices, fewer investments in large scale projects in Alberta slowed development in the sector. At the same time, Canada’s
13 auto sector as it adjusted to greater competition from Japanese automakers (Holmes 1996). Other technology intensive activities (e.g., aerospace, biotechnology, and telecommunications) also expanded with more and more R&D also coming from the service sector (e.g., software design and development, producer services, engineering and scientific services) (Britton 1996). This amalgam of economic developments translated into a 63 km shift of the ECG back towards the east.
Since the late 1980s, however, the country’s ECG has steadily been moving westward. From 1988 to 2013, the ECG moved from east to west by 179 km. Within this broad sixth shift, we can identify two distinct periods. First, while moving some 67 km west, the ECG during the 1990s also slightly shifted from north to south by some 3 km. Although small in distance, this shift represents one of the few times the ECG has drifted from its gradual and steady south-to-north progression since the post-war years. In many ways, it signaled the continuation of a southward realignment in the ECG which began in the late 1980s with the implementation of the Canada-US Free Trade Agreement (1988) and its successor NAFTA (1994). During this period, the dollar was also devaluing rapidly which gave further incentive for central Canada manufacturers to expand their operations. By 1999, this trend had resorbed itself and the east-to-west shift also came to a halt as output from new energy projects were coming on-line in the east (the Hibernia off-shore oil field in Newfoundland and gas production from Sable Island in Nova Scotia).
The second distinct movement corresponds to the 112 km westward shift that occurred between 2000 and 2013. After the 1970s, this shift represents the second largest movement in the ECG since 1926 and, again, it can be attributed to a second energy resource boom in Western Canada (see Figure 2). Throughout the 1990s, the growth of the iron, steel, auto and aircraft sectors had largely overshadowed that of the energy sector such that the share of exports attributable to natural resources had fallen to its lowest point on record (36% in 1999) (Baldwin and Macdonald 2012). With the rapid growth of non-conventional oil resources in Alberta during the 2000s, now Canada’s primary source of oil, and an expansion of natural gas activities in nearby Saskatchewan and British Columbia, the decline
14 had reversed itself and the share of resources in exports rose again to 53% by 2010. Given the
expansiveness of the post-2000 resource boom11, it is no wonder economists expressed concern over the possible impacts of the so-called ‘natural resource curse’ on the Canadian economy (e.g., Cross 2008; Boyce and Emery 2011)!
[Figure 3]
Our discussion so far has focused on the movement of Canada’s ECG as it is defined by the geographic centroids of provinces. Figure 3 maps an alternate ECG using the XY centroid location of each province’s largest metropolitan area instead. The striking feature here is that the ECG lies historically not in Canada but south of the border, in the United States, in the northwestern peninsula of Michigan, close to the city of Marquette on the shores of Lake Superior. In 1926, the ECG – based on metropolitan centroids – would be located at a latitude of 46°38'N and longitude of 86°70'W. That is roughly 660 km south-east from the ECG calculated using the geographic centroids of provinces. By 2013, the ECG is found at a latitude of 46°50'N and longitude of 89°42'W, a point just 33 kilometers due north of the Wisconsin border. Compared to the province-based ECG from above, the east-west distance in the movement of the city-centroids ECG is similar though the south to north shift is slightly less pronounced (which reflects the relatively more compact spatial distribution of metropolitan centres). More
importantly, the six major moments in the directional changes of the ECG are also evident on this map. If the idea of having an ECG that lies outside of Canada at first seems somewhat unnatural, it does reflect the fact that our country is not a convex set. With Toronto as the largest metropolitan economy, the anchor of the Golden Horseshoe in southern Ontario (situated at a latitude of 43°65'N), the ECG is pulled southward considerably. The latter finding using a different set of centroid coordinates based on a more disaggregated geography does raise the classic problem of what areal unit of analysis
15 should be adopted for tracking movements in the ECG (see Openshaw 1983). For the time being, we are limited by the data currently available but in a future paper based on Census Division level estimates of household income we will be able to re-estimate and compare movements in the ECG using a finer geography.
4.2. Resource prices and Canada’s economic centre of gravity
As noted above, one of the most striking characteristics of the six major shifts in Canada’s ECG is the role of natural resources. While the types of resource may have changed (e.g., from fish and wood to wheat to oil), the pattern is quite clear: rising resource prices are associated with westward shifts in the ECG.
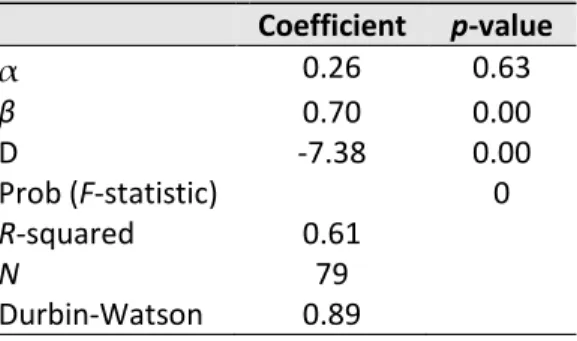
Here we test this association more formally by regressing changes in the long-run Bank of Canada Commodity Price Index (BCPI) with east-west (longitude) shifts in the ECG. The BCPI is an index that expresses changes in global, $US prices for commodities important to Canada (Kolet and
Macdonald 2012)12. Extending from 1870 to 2015, the long-run version of the BCPI is particularly useful here because it was constructed to consistently trace resource price shifts over a long period of time that encompasses the study period. It consists of a basket of 23 commodities whose weights change through time to reflect the overall composition of production (see Macdonald 2017 for more details).
[Figure 4]
Figure 4 presents the east/westward shifts in the ECG compared to growth in commodity prices from the BCPI over the study period. We use a 9-year moving average to present a trend because both series are quite volatile making it difficult to extract an underlying signal from the noise. Both series follow the same path through time with rising resource prices associated with westward shifts in the
16 ECG (positive changes) and falling resource prices resulting in the opposite. To formally test this
relationship, we begin by regressing the BCPI on the ECG such that:
𝐸𝐸𝐸𝐸𝐸𝐸9𝑡𝑡= 𝛼𝛼 + 𝛽𝛽𝐵𝐵𝐸𝐸𝐵𝐵𝐵𝐵9𝑡𝑡+𝑙𝑙 + 𝐷𝐷 + 𝜀𝜀𝑡𝑡,
where ECG9 is the nine-year moving average of the ECG in year t and the vector BCPI9 is the nine-year moving average of the BCPI in year t with l leads (+) and lags (-), and D is a binary variable for the early depression years, 1929 to 1934, where there is a clear break in the series. There is a positive and significant association between the one-year lag of the BCPI9 and the westward shift in the ECG, but no association with the other leads and lags. That is, there is a one-year delay in the reaction of the ECG to changes in the BCPI, but no more than that. Similarly, there is no association with leads in the BCPI. Using a more parsimonious specification with just a one-year lag in the BCPI leads to qualitatively similar results and an adjusted R-square of 0.61 (see Table 3). Hence, about 60% of the variation in the east-west movement in the ECG is accounted for by the BCPI and an indicator variable for the depression.
We also tested the direction of the association between the ECG and BCPI using Granger Causation for the period after World War 2. Our findings suggest that a change in the BCPI is associated with a change in the ECG, but not otherwise (see Table 4). Overall, the intuition that resource prices are strongly associated with shifts in Canada’s economic centre through time is supported. Canada’s economic history, as expressed through its ECG, is accounted for – to a remarkable degree – by one resource-based price index.
[Tables 3 and 4]
17 We set out to track movements in Canada’s economic centre of gravity. Our results show that there has been a net westward shift in the country’s ECG of 204 km from 1926 to 2013 along with a net south to north shift of 35 km. Further, within this period we have identified six different moments during which major historical realignments have occurred (not only from east-to-west, but also west-to-east). In a nod to Mackintosh and Innis, we also find these realignments to be strongly associated with the long-run cyclical ups and downs of commodity prices.
Though an abstract construct, the ECG (or centre point) does provide a convenient and novel way of graphically summarizing distributional tendencies across the country’s economic landscape. In particular, tracking changes in the ECG’s direction and extent of movement over such a long period of time helps us illustrate key historical moments in Canadian economic development. To be sure, there is also room for improvement from a methodological point of view. With the development of a more geographically disaggregated dataset based on Census Divisions as regional units of analysis, we will be able to explore more carefully how intra-provincial shifts in economic activities have influenced the trajectory of the ECG, albeit over a shorter period of time.
Looking forward, it will also be interesting to see how the ECG evolves in the face of new
political economic challenges and opportunities. Economic conditions in Alberta have changed markedly following a pronounced decline in the price of oil that began in 2014 as West Texas Intermediate fell from US$105.79 per barrel in June of that year to US$30.32 per barrel in February of 2016. Today, business investments in the province remain lower than in the post-2000 energy boom era even if global commodity prices are now slowly recovering. Questions also arise as to how the continued growth of Asian economies and evolving multilateral trade agreements will affect the country’s trading relations and partnerships. In addition, how will population ageing and what some observers are calling the Great Demographic Imbalance (Saillant 2016) shape the fortunes of different regions across the country? If
18 anything, our historical overview of movements in the ECG suggests that all of these forces will likely play a major role in shaping the future of Canada’s economic geography.
19 Bibliography
Aboufadel, E., and D. Austin. 2006. A new method for computing the mean center of population of the United States, Professional Geographer, 58(1): 65-69.
Baldwin, J. and R. Macdonald. 2012. Natural resources, the terms of trade, and real income growth in Canada: 1870 to 2010. Economic Analysis Research Paper Series. Ottawa, ON: Statistic Canada.
Barmore, F. E. 1993. Center here, center there, center everywhere! The geographic center of Wisconsin and the USA: Concepts, comments and misconceptions. The Wisconsin Geographer, 9: 8-21.
Barnes, T., Hayter, R. and E. Hay. 2001. Stormy weather: cyclones, Harold Innis and Port Alberni, BC, Environment and Planning A, 33: 2127-2147.
Berdahl, L. and R. Gibbins. 2014. Looking West: Regional Transformation and the Future of Canada. Toronto, ON: University of Toronto Press.
Boyce, J. R. and J. C. H. Emery. 2011. Is a negative correlation between resource abundance and growth sufficient evidence that there is a ‘resource curse’? Resource Policy, 36: 1-13.
Bradbury, J. H. 1978. The instant towns of British Columbia: A settlement response to the metropolitan call on the productive base, in Vancouver: Western Metropolis, edited by L. J. Evenden, Western Geographical Series No. 16. Victoria, BC: University of Victoria, pp. 117-133.
Bricker, D. and J. Ibbitson. 2013. The Big Shift – The Seismic Change in Canadian Politics, Business, and Culture and What it Means for Our Future. Toronto, ON: Harper Collins.
Britton, J. N. H. 1996. High-tech Canada, in Canada and the global economy: The geography of structural and technological change, edited by J. N. H. Britton. Kingston, ON: McGill-Queen’s University Press, pp. 255-272.
Brown, M. and R. Macdonald. 2015. Provincial convergence and divergence in Canada, 1926 to 2011. Economic Analysis Research Paper Series. Ottawa, ON: Statistic Canada.
Brodie, J. 1989. The political economy of regionalism, in New Canadian Political Economy, edited by W. Clement and G. Williams. Montreal, QC: McGill-Queen’s University Press, pp.138-159.
Campbell, M. 2015. It should be an easy question: What’s Canada’s geographic centre? But groups in Manitoba and Nunavut say they’re right. Maclean’s (29 June 2015).
Courchene, T. and C. R. Telmer. 1998. From Heartland to North American Region State: The Social, Fiscal and Federal Evolution of Ontario. Toronto, ON: University of Toronto.
Cross, P. 2008. The role of natural resources in Canada’s economy, Canadian Economic Observer, Ottawa, ON: Statistics Canada.
Cross, P. and P. Bergevin. 2012. Turning points: Business cycles in Canada since 1926. Commentary No. 366. Toronto, ON: CD Howe Institute.
20 Easterbrook, W. T. and H. G. J. Aitken. 1975. Canadian Economic History. Toronto, ON: McMillan.
Economic Council of Canada. 1977. Living together: A study of regional disparities. Ottawa, ON: Government of Canada.
Ernstson, U. 2015. Featured Graphic. Mean centre of population for Sweden, 1810-2010. Environment and Planning A, 47: 1595-1596.
Grether, J. M., and N. A. Mathys. 2010. Is the world's economic centre of gravity already in Asia?, Area, 42(1): 47-50.
Hayter, R., and T. Barnes. 1990. Innis’ staple theory, exports and recession: British Columbia, 1981-86, Economic Geography, 66(2): 156-173.
Hayford, J. F. 1902. What is the center of an area, or the center of a population? Publications of the American Statistical Association, 8(58): 47-58.
Holdsworth, D. W., and D. Kerr. 2000. Historical Atlas of Canada: Volume III: Addressing the Twentieth Century. University of Toronto Press.
Holmes, J. 1996. Restructuring in a continental production system, in Canada and the global economy: The geography of structural and technological change, edited by J. N. H. Britton. Kingston, ON: McGill-Queen’s University Press, pp. 230-254.
Innis, H. A. 1933. Problems of staple production in Canada. Toronto, ON: Ryerson Press. Jackman, P. 2011. Revealed: The true centre of Canada, Globe and Mail (21 January 2011).
Macdonald, R. 2015. Constructing provincial time series: A discussion of data sources and methods. Income and expenditure accounts technical series. Ottawa, ON: Statistic Canada.
Macdonald, R. 2017. A long-run version of the Bank of Canada Commodity Price Index, 1870 to 2015. Analytical Studies Research Paper Series, No. 399. Ottawa, ON: Statistics Canada.
Mackintosh, W. A. 1923. Economic factors in Canadian history, The Canadian Historical Review, 4(1): 12-25.
Nicholson, P. 2003. The growth story: Canada’s long-run economic performance and prospects. International Productivity Monitor, Centre for the Study of Living Standards (CSLS), 7: 3-23.
Olewiler, N. 2017. Canada’s dependence on natural capital wealth: Was Innis wrong? Canadian Journal of Economics, 50(4): 927-964.
Openshaw, S. 1983. The modifiable areal unit problem. Norfolk: GeoBooks.
21 Plane, D. A., and P. A. Rogerson. 2015. On tracking and disaggregating center points of population, Annals of the Association of American Geographers, 105(5): 968-986.
Quah, D. 2011. The global economy's shifting centre of gravity, Global Policy, 2(1): 3-9.
Ray, D. M., Lamarche, R. H. and I. R. MacLachlan. 2013. Restoring the “regional” to regional policy: A regional typology of Western Canada, Canadian Public Policy, 39(3): 411-429.
Rogerson, P. A. 2015. A new method for finding geographic centers, with application to US states, Professional Geographer, 67(4): 686-694.
Safarian, A. E. 2009. The Canadian economy in the great depression, 3rd edition. McGill-Queen’s University Press.
Saillant, R. 2016. A Tale of Two Countries: How the Great Demographic Imbalance is Pulling Canada Apart. Halifax, NS: Nimbus Publishing Ltd.
Savoie, D. J. 1992. Regional Economic Development: Canada’s Search for Solutions, 2nd edition. Toronto, ON: University of Toronto Press.
Siddiq, F. and S. Babins. 2013. Trends in population growth inequality across subnational jurisdictions in Canada, Canadian Public Policy, 39: S41-S64.
Statistics Canada. 2012. Boundary files, reference guide (Catalogue no. 92-160-G). Ottawa: ON. Statistics Canada. 2015. Map projection (Catalogue no. 92-195-X). Ottawa: ON.
US Census Bureau. 2011. Centers of population computation for the United States, 1950-2010. Washington, DC: US Department of Commerce.
Wallace, I. 2002. A geography of the Canadian economy. Don Mills, ON: Oxford University Press. Watkins, M. H. 1963. A staple theory of economic growth, Canadian Journal of Economics and Political Science, 29: 141-158.
22 Tables and Figures
Table 1. Provincial and metropolitan area centroids (unweighted) Province Longitude Latitude Largest metro
area Population (x 1000)a Longitude Latitude
Newfoundland -60.4611 52.8625 St. John’s 208.8 -52.8983 47.7045
Prince Edward Island -63.2577 46.4009 Charlottetown 64.5b -63.1915 46.2782
Nova Scotia -63.3261 45.1502 Halifax 410.3 -63.5752 44.6488
New Brunswick -66.3804 46.6272 Moncton 144.6 -64.7782 46.0878
Quebec -71.7725 53.3828 Montreal 3,980.8 -73.5673 45.5017
Ontario -86.0730 50.4510 Toronto 5,967.2 -79.3832 43.6532
Manitoba -97.4289 54.9260 Winnipeg 770.5 -97.1375 49.8998
Saskatchewan -105.8894 54.4180 Saskatoon 290.7 -106.6700 52.1332
Alberta -114.5071 55.1636 Calgary 1,353.9 -114.0708 51.0486
British Columbia -124.7366 54.7679 Vancouver 2,444.3 -123.1207 49.2827 Notes: aThe population of metropolitan areas is based on 2013 estimates (CANSIM Tables 051-0056). bThe population estimate for the Charlottetown census agglomeration is based on the 2011 NHS. Table 2. Timeline of major historical shifts in the Canadian economy’s center of gravity
Years Distance (km) Direction Defining political economic events East-West shifts
1926 to 1931 114 East Great Depression, US imposes Smooth-Hawley Tariff Act (1930).
1931 to 1939 53 West Great Depression ‘aftermath’ continues.
1939 to 1948 64 West WWII and post-war economic transition/boom.
1948 to 1950 44 East Newfoundland joins Confederation (April 1st, 1949).
1950 to 1970 1 West-East Little “net” movement in center of gravity. 1970 to 1981 128 West Oil shocks (1973, 1979) → oil and gas boom out
west.
1981 to 1988 63 East National Energy Program years, softening of world energy prices, recession (early 1980s).
1988 to 2013 179 West Bulk of shift (112 km) occurs post-2000 as the resource boom leads to increased energy
production out west. Short blip (16 km) from West to East following the Great Recession years (2008 to 2010).
Net 1926 to 2013 204 West
South-North shift
Net 1926 to 2013 35 North Gradual shift north though southern deviation from 1987 to 1989 following the implementation of the Canada-US FTA (this southern drift
continued shortly into the early 1990s) Maximum range values in shifts
1931 to 2013 318 West 1931 is the most easterly point in the ECG. 1941 to 2013 55 North 1941 is the most southerly point in the ECG.
23 Table 3. Economic centre of gravity as a function of commodity prices
Coefficient p-value α 0.26 0.63 ϐ 0.70 0.00 D -7.38 0.00 Prob (F-statistic) 0 R-squared 0.61 N 79 Durbin-Watson 0.89
Table 4. Granger causality after WW2
F-statistic Prob. Commodity price change does not Granger cause ECG change 3.8 0.0
ECG does not Granger cause BCPI price growth 0.0 1.0
N = 60
24 Figure 1. Canada’s economic center of gravity (based on provincial centroids), 1926-2013
25 Figure 2. Share of production of resource products, 1926 to 2013
Notes: Production of major resource commodities important for trade. Data series prepared by Statistics Canada’s Economic Analysis Division.
0.00 10.00 20.00 30.00 40.00 50.00 60.00 70.00 1926 1929 1932 1935 1938 1941 1944 1947 1950 1953 1956 1959 1962 1965 1968 1971 1974 1977 1980 1983 1986 1989 1992 1995 1998 2001 2004 2007 2010 2013 Per cen ta ge s ha re
26 Figure 3. Canada’s economic center of gravity (based on metropolitan centroids), 1926-2013
27 Figure 4. Commodity price growth vs. east-west movements in Canada’s economic centre of gravity
-15.00 -10.00 -5.00 0.00 5.00 10.00 15.00 20.00 1920 1927 1934 1941 1948 1955 1962 1969 1976 1983 1990 1997 2004 2011
Percent (BCPI); kms West(+), East(-) (ECG)
28 Acknowledgements
The authors are grateful to Ruilan Shi and Donald Savoie for helpful comments on an earlier version of the paper. Parts of the manuscript were written while S. Breau was a fellow in residence at the Donald J. Savoie Institute (Université de Moncton) during the summer of 2017. All views expressed in the article are those of the authors and do not necessarily reflect the views of Statistics Canada. Finally, the paper is dedicated to the thousands of students of GEOG-216 at McGill University who over the years have sat in through lectures on Canada in the Global Economy.
29 Endnotes
1 This notion was popularized in a speech by Prime Minister William Lyon Mackenzie King to the House of Commons in 1936.
2 The lack of a consistent and continuous time series on household income figures below the national-level is arguably one of the reasons such an empirical exercise was not carried out earlier.
3 Although it has not received as much media attention in Canada, the Globe and Mail (see Jackman 2011) and Maclean’s (see Campbell 2015) did run stories recently about the geographical centre of the country.
4 We thank one of the reviewers for pointing this out.
5 Note that although historical estimates for the consumer price indexes (CPIs) are not available for provinces, they are for Halifax, Saint John, Montreal, Toronto, Winnipeg, Regina, Calgary and Vancouver from 1926 to 2013. The CPI for St. John’s is only available from 1952 onwards thus the average of Halifax and Saint John is used as a proxy for the 1949 to 1951 period. Likewise, the CPI for Charlottetown is only available from 1974 onwards (here, Saint John is the reference for 1926 to 1973). City-specific CPIs were thus applied to our provincial income estimates in order to produce a real income series (expressed in $2002). Results are available from the authors upon request. 6 The authors are currently working on the development of a dataset that will allow us to explore such dynamics. 7 And if we use existing international studies of movements in population centres of gravity (PCG) as a benchmark for comparison, this 4.1% shift lies in-between Sweden’s 1.8% southerly shift in PCG from 1930 to 2010 (Ernstson 2015) and the US’s westward progression in PCG of 11.8% over the same period of study (Plane and Rogerson 2015).
8 This harkens back to the heartland-hinterland debate which was a focal point of the 1970s-80s literature on the spatial dimensions of Canadian regionalism (e.g., Ray 1985; McCann 1998). The heartland-hinterland (or core-periphery) approach is a meaningful framework for regional analysis, especially at a finer scale where intra-provincial shifts in economic activity can be examined. As stated in Section 3.2, while we are currently working on developing a dataset that will allow us to investigate such dynamics more closely, the focus of this paper is on the broader east-west movements in the ECG; a spatial progression that is part of what Holdsworth and Kerr (2000) have called the country’s ‘Great Transformation’ during the 20th century.
9 Up through the early 1960s, agriculture, forestry, non-ferrous metals and non-metallic minerals still accounted for 80% of all Canadian exports (Baldwin and Macdonald 2012).
10 CANSIM Tables 126-0001 and 126-0002.
11 It is interesting to note, however, that the Great Recession of 2008-09 did momentarily halt the ECG’s westerly progression (with a 15 km west to east realignment from 2008 to 2009 alone).
12 Because the BCPI is measured in $US, the force of rising commodity prices can differ between periods with floating exchange rates and periods with fixed exchange rates. As a robustness check, a measure of $CDN BCPI was substituted for the $US BCPI, and the results were essentially unchanged.