Contents lists available atScienceDirect
Environment International
journal homepage:www.elsevier.com/locate/envintE
ffects of climate and fine particulate matter on hospitalizations and deaths
for heart failure in elderly: A population-based cohort study
Alain Vanasse
a,b,⁎, Denis Talbot
c,d, Fateh Chebana
e, Diane Bélanger
c,e, Claudia Blais
f,g,
Philippe Gamache
f, Jean-Xavier Giroux
e, Roxanne Dault
a, Pierre Gosselin
c,d,e,f,gaDepartment of Family Medicine and Urgent Medicine, Faculty of Medicine and Health Sciences, Université de Sherbrooke, 3001 12e Avenue Nord, Sherbrooke, J1H 5N4,
QC, Canada
bResearch Center of the Centre hospitalier universitaire de Sherbrooke– Université de Sherbrooke, 3001 12e Avenue Nord, Sherbrooke, J1H 5N4, QC, Canada cResearch Center of the Centre hospitalier universitaire de Québec - Université Laval, 1050 Chemin Sainte-Foy, Québec, G1S 4L8, QC, Canada
dDepartment of Social and Preventive Medicine, Faculty of Medicine, Université Laval, Pavillon Ferdinand-Vandry, 1050 Avenue de la Médecine, Québec, G1V 0A6, QC,
Canada
eThe Eau Terre Environnement Research Center, Institut national de la recherche scientifique, 490 Rue de la Couronne, Québec, G1K 9A9, QC, Canada fInstitut national de santé publique du Québec, 945 Avenue Wolfe, Québec, G1V 5B3, QC, Canada
gFaculty of Pharmacy, Université Laval, Pavillon Ferdinand-Vandry, 1050 Avenue de la Médecine, Québec, G1V 0A6, QC, Canada
A R T I C L E I N F O
Keywords: Heart failure Elderly Climate changes Fine particulate matter Lag effect
Canada
A B S T R A C T
Background: There are limited data on the effects of climate and air pollutant exposure on heart failure (HF) within taking into account individual and contextual variables.
Objectives: We measured the lag effects of temperature, relative humidity, atmospheric pressure and fine par-ticulate matter (PM2.5) on hospitalizations and deaths for HF in elderly diagnosed with this disease on a 10-year period in the province of Quebec, Canada.
Methods: Our population-based cohort study included 112,793 elderly diagnosed with HF between 2001 and 2011. Time dependent Cox regression models approximated with pooled logistic regressions were used to evaluate the 3- and 7-day lag effects of daily temperature, relative humidity, atmospheric pressure and PM2.5 exposure on HF morbidity and mortality controlling for several individual and contextual covariates. Results: Overall, 18,309 elderly were hospitalized and 4297 died for the main cause of HF. We observed an increased risk of hospitalizations and deaths for HF with a decrease in the average temperature of the 3 and 7 days before the event. An increase in atmospheric pressure in the previous 7 days was also associated with a higher risk of having a HF negative outcome, but no effect was observed in the 3-day lag model. No association was found with relative humidity and with PM2.5regardless of the lag period.
Conclusions: Lag effects of temperature and other meteorological parameters on HF events were limited but present. Nonetheless, preventive measures should be issued for elderly diagnosed with HF considering the burden and the expensive costs associated with the management of this disease.
1. Introduction
It has already been shown through multiple lines of evidence that climate is changing across the planet, largely as a result of human ac-tivities (Intergovernmental Panel on Climate Change, 2013). Global
temperature is warming. Climate is more variable and unpredictable. Donat et al. (2013)predict that days and nights will be warmer, not to mention an increase in the occurrence and the duration of heat waves. In some parts of the world as in the province of Quebec, Canada, winters will remain cold and extreme cold snaps will occur despite the
http://dx.doi.org/10.1016/j.envint.2017.06.001
Received 6 December 2016; Received in revised form 30 May 2017; Accepted 1 June 2017
⁎Corresponding author at: PRIMUS Research Group, Department of Family Medicine and Urgent Medicine, Faculty of Medicine and Health Sciences, Université de Sherbrooke, 3001
12th Avenue North, Sherbrooke, J1H 5N4, QC, Canada.
E-mail addresses:[email protected](A. Vanasse),[email protected](D. Talbot),[email protected](F. Chebana),
[email protected](D. Bélanger),[email protected](C. Blais),[email protected](P. Gamache),[email protected](J.-X. Giroux),
[email protected](R. Dault),[email protected](P. Gosselin).
Abbreviations: AIC, Akaike information criterion; BIC, Bayesian information criterion; CAs, Census agglomerations; CHDs, Coronary heart diseases; CMAs, Census metropolitan areas; CNS, Central nervous system; CSDs, Census subdivisions; CTs, Census tracts; CVDs, Cardiovascular diseases; DAs, Dissemination areas; GEE, Generalized estimating equation; HF, Heart failure; ICD, International classification of diseases; INSPQ, Institut national de santé publique du Québec; km, Kilometer; kPa, Kilopascal; NAPS, National Air Pollution Surveillance; ORNL DAAC, Oak Ridge National Laboratory Distributed Active Archive Center; PM2.5, Fine particulate matter; QICDSS, Quebec Integrated Chronic Disease Surveillance System
0160-4120/ Crown Copyright © 2017 Published by Elsevier Ltd. All rights reserved.
global warming (Ouranos, 2015).
Natural environment of the province of Quebec is characterized, among others, by the vastness of the landscape. With an area of 1,667,441 square kilometers (km), the province of Quebec extends to nearly 2000 km from south to north and 1500 km from east to west. As a result of its extensive area and the relief of the territory, Quebec has several distinct climate areas and ecosystems. In the center of Quebec, average temperatures vary from−16 °C in winter to 12 °C in summer whereas itfluctuates from −8 °C to 20 °C in the south of the province (Ouranos, 2015).
Climate changes affect, above all, vulnerable populations, including individuals with chronic diseases, elderly and disadvantaged people (Basu and Samet, 2002; Kenny et al., 2010; Doyon et al., 2008). Ex-treme temperatures, such as extended heat waves or cold snaps, in-crease morbidity, mortality and health resource utilization for heart failure (HF) when combined with an advanced age and a low-income neighbourhood (Hawkins et al., 2012). Moreover, several atmospheric pollutants sensitive to weather conditions are affected by the global warming (Luber and Lemery, 2015). These air pollutants can exacer-bate cardiovascular diseases (CVDs) and, according to Luber and Lemery (2015), are associated with an increase in emergency visits, hospitalizations and premature deaths.
Sensitivity to extreme climate is apparent in thefield of CVDs, a research thematic prioritized in a recent report published by the National Institute of Environmental Health Sciences (Portier et al., 2010). There are multiple evidences of the negative impact of me-teorology as well as air pollution on HF hospital admissions and mor-tality (i.e.,Goggins and Chan, 2017; Das et al., 2014; Qiu et al., 2013; Gotsman et al., 2010; Inglis et al., 2008; Kolb et al., 2007). However, to our knowledge, there is no study that investigates the impact of me-teorological parameters andfine particulate matter on morbidity and mortality for HF at a neighbourhood scale considering both individual and contextual factors.
In this study, we measured the effect of several meteorological parameters on the occurrence of a hospitalization or death for the main cause of HF in elderly, aged 65 years and older, known to be diagnosed with this condition in Quebec (Canada) over a ten-year period (2001−2011). The main objective was to evaluate the effect of mean temperature, relative humidity and atmospheric pressure as well as air pollutant PM2.5, on HF negative outcomes controlling for several
con-textual and individual covariates. This is particularly relevant for pur-poses of surveillance in public health in a context of climate changes. 2. Methods
To measure the association between climate, PM2.5exposure and
the occurrence of HF events, a population-based retrospective cohort study was conducted.
2.1. Study population
Individuals of 65 years and older hospitalized for HF, either as a primary or secondary cause between April 1st 2001 and December 31st 2011 without any hospitalization for this motive (all diagnostic posi-tions) in the previous five years, were identified in the Quebec Integrated Chronic Disease Surveillance System (QICDSS) database to build the cohort study. The index date corresponds to the date of entry into the cohort, defined as the date of the discharge from this HF hos-pitalization. Individuals were excluded if they moved out between their entry into the cohort and the occurrence of the outcome of interest or the end of the study period.
To homogenize the study cohort and minimize selection bias, the first hospital admission for HF without any hospitalization for this cause in the previousfive years was used. The aim of using a buffer of five years was to include individuals at the beginning of the sympto-matic phase of their disease, when it is sufficiently serious to necessitate
a hospitalization.
Health data of individuals included in the cohort were obtained from the QICDSS database. The QICDSS created by the Institut national de santé publique du Québec (INSPQ) is an innovative chronic disease surveillance system developed to monitor several chronic diseases in the province of Quebec. The QICDSS data are derived from the linkage of five health administrative databases managed by the Ministry of health and social services (Ministère de la santé et des services sociaux) and the provincial health insurance board (Régie de l'assurance maladie du Québec). It contains information on all individuals covered by the Quebec universal public health insurance plan that had at least one diagnosis or criteria of the studied chronic diseases. The five data sources are the health insurance registry, the hospitalization database, the physician billing claims database (including emergency department visits, outpatient visits and community physicians' visits), the phar-maceutical claims database (for people of 65 years and older), and the vital statistics death database (Blais et al., 2014; Vanasse et al., 2016). 2.2. Geographical areas
Dissemination areas (DAs) can be used as proxy for life conditions in neighbourhoods especially for health adverse events associated with extreme summer heat in Quebec (Ngom et al., 2013; Bélanger et al., 2016). However, in the present study, it was impossible to use this proxy due to the large number of DAs with only one or no HF event. Census tracts (CTs) and census subdivisions (CSDs) were used instead of DAs given that they cover larger populations.
CTs usually have a population between 2500 and 8000 inhabitants. They are located in census metropolitan areas (CMAs) and in census agglomerations (CAs) that have a core population of 50,000 or more (Statistics Canada, 2015a). As to CSDs, they designate municipalities or areas that are deemed to be equivalent to municipalities for statistical reporting purposes (e.g., Indian reserve) (Statistics Canada, 2015b).
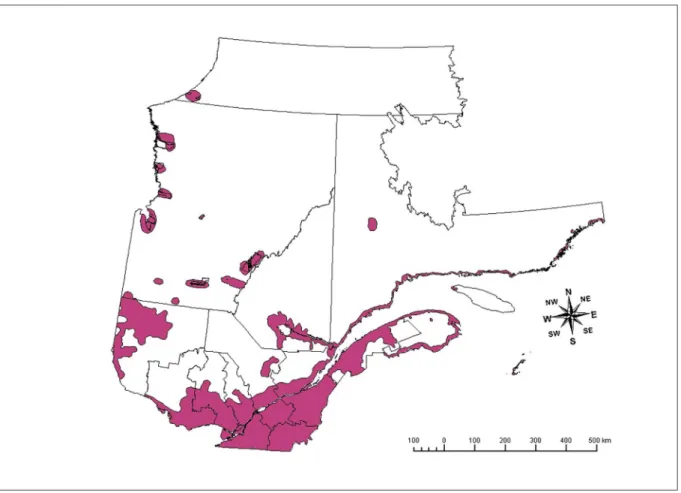
People in the cohort were assigned to CTs and CSDs with the six-digit postal codes of residence available in the QICDSS database. The matching between CTs/CSDs and postal codes was made using the postal codes conversion file of Statistics Canada (Statistics Canada, 2015c). Overall, 1367 CTs and 761 CSDs were under study (the popu-lation ecumene is presented in Fig. 1), corresponding to 112,793 people.
2.3. Study outcomes and confounders
The health outcomes of interest were the time before the occurrence of a hospitalization (primary diagnosis only) or death (main cause) for HF from the index date. HF diagnosis was identified in the QICDSS database using the International Classification of Diseases (ICD). In Quebec, the transition of ICD-9 to ICD-10 occurred in April 2006 for the inpatient data and in January 2000 for the data related to death. Hence, HF diagnosis was identified according to either ICD-9 or ICD-10, de-pending on which version was being used on a given date (ICD-9 code 428.xx and ICD-10-CA (Canadian enhancement) code I50.xx).
The potential confounders were selected a priori based on sub-stantive prior knowledge (Roger, 2013; Khatibzadeh et al., 2013; He et al., 2001). The potential confounders considered were: age, sex, presence of hypertension, diabetes or coronary heart disease (e.g., myocardial infarction), mean number of outpatient consultations or emergency hospitalizations (primary diagnosis) for CVDs in the last 12 months, mean number of prescription drugs related to the cardio-vascular and renal systems in the last 12 months, mean number of prescription drugs related to the central nervous system (CNS) in the last 12 months, week day (Monday to Friday vs. Saturday or Sunday), residential area (CMA of Montreal: > 1 million inhabitants, other CMAs: 100,000 to 1 million inhabitants, CAs: 10,000 to 100,000 habitants, and small towns as well as rural areas: < 10,000 in-habitants), and material and social deprivation index. These variables
were measured and updated daily. The season was considered as a confounder associated with the meteorological exposition. It was de-fined as May to September for the summer period and October to April for the winter period.
The number of prescription drugs related to the cardiovascular and renal systems as well as the number of prescription drugs of the CNS have been included as potential confounders in the present study be-cause these classes of drugs have been reported to be potentially dan-gerous in periods of extreme heat, especially in elderly with chronic diseases (Blachère et al., 2011; Blachère et al., 2012).
In the absence of individual socioeconomic information, the depri-vation index is largely used in Quebec and throughout Canada as an ecological proxy in public health studies to approximate the socio-economic status of subjects (INSPQ, 2016; Pampalon and Raymond, 2000). The index is based on six indicators taken from the Canadian censuses and is divided into two components to assess material and social deprivation. Values were assigned by linking the DAs with the individual six-digit postal codes of residence. After including them se-parately in our preliminary analyses, both dimensions of the depriva-tion index were combined in a single deprivadepriva-tion variable.
2.4. Meteorological data
The meteorological exposure variables were temperature (°C), re-lative humidity (%) and atmospheric pressure at sea level (kPa). For each CT and CSD, a daily value was obtained from Daymet or Climat-Quebec for each meteorological parameters as well as an average of the daily values of the last 3 and 7 days, including the current day (lag 3-day and lag 7-3-day). The choice regarding these lag effects was made to take into account that heat and cold have different lag periods on cardiovascular health (Huang et al., 2014; Yu et al., 2011; Anderson and Bell, 2009; Medina-Ramón et al., 2008; Braga et al., 2002). Several
previous studies have shown a longer lag effect in winter than in summer (i.e.,Braga et al., 2002; Kolb et al., 2007; Tian et al., 2012; Huang et al., 2014). The choice of those two lags was also considered likely to cover most instances of interest within our cohort.
Information on weather parameters was obtained from two main sources: Daymet and Climat-Quebec. Daymet is a reanalysis of historical data done by the NASA through interpolation and extrapolation algo-rithms (ORNL DAAC, 2016). These data are available on a grid having a spatial resolution of 1 km by 1 km and a daily temporal resolution (daily measurement) (Fig. 2A). Using stations from all over North America, Daymet provides gridded estimates on a continuous surface of the daily meteorological parameters. The grid point values contained in the CT/CSD to which belonged an individual provided the local data. Managed by Environment Canada, data from Climat-Quebec are avail-able through 364 measuring stations across the province of Quebec (Fig. 2B). These are observational data having a daily temporal re-solution for temperature and an hourly temporal rere-solution for relative humidity and atmospheric pressure at sea level (Climat-Québec, 2016). For every CT/CSD from which Climat-Quebec data were used, a mean daily value was calculated for each meteorological parameter using the values of the stations within the limits of the CT/CSD. The Daymet data were prioritized over the data of Climat-Quebec because they provide more precise estimates of the different meteorological parameters. However, when Daymet data were not available or unusable, as in the north of the province of Quebec, data from Climat-Quebec were used. In the present study, respectively 93% and 86% of the data on tempera-ture and relative humidity were obtained from Daymet while 100% of the data relative to the atmospheric pressure at sea level were derived from Climat-Quebec.
Fig. 1. Study areas. In the province of Quebec (Canada).
2.5. Air pollution data
The effect of fine particulate matter (PM2.5) on HF outcomes has
been the subject of an analysis only for the CMAs of Montreal and Quebec City (the two most populated ones) because of data quality and availability problems for the rest of the province for the period under study.
Data on PM2.5 were obtained from the National Air Pollution
Surveillance (NAPS) program. NAPS program provides accurate and long-term air quality data on a uniform standard across Canada (Government of Canada, 2013). NAPS data are observational data, available through several measuring stations having an hourly temporal resolution (one measure every hour) or a daily temporal resolution every 6 days (one measure over 24 h every 6 days). For every CT within the CMAs of Montreal and Quebec City, a daily value was calculated by prioritizing hourly values and by using the following order of pre-ference: 1) Average of hourly values of the closest station having an hourly temporal resolution, 2) Daily value of the closest station having a daily temporal resolution every 6 days. If there were more than one measuring stations within the limits of a CT, the average of the values was used. In the case that there was no measuring station within the limits of a CT, the closest station up to 30 km around the CT was used. A CT was accounted as missing value and was excluded from the analyses if there was no measuring station within its limits and in the sur-rounding 30 km.
Average of hourly values was used most of the time (88% for both CMAs). For the CMAs of Montreal and Quebec City, missing values accounted for respectively 9.3% and 11.4% of data. Overall, 84 and 34 measuring stations for the CMAs of Montreal and Quebec City were used to evaluate the exposure to PM2.5.
2.6. Statistical analyses
Individuals in the cohort were followed until the occurrence of the outcome of interest or until the end of the study period (December 31st, 2011). Individuals who have not experienced the outcomes of interest by the end of the study period or individuals that died from another cause than HF were considered as censored data.
Data were modeled using a time dependent Cox regression analysis. In order to estimate the importance of the correlation between the observations of a same CT/CSD, we approximated the Cox model uti-lizing a pooled logistic regression with generalized estimating equations (GEE) (D'Agostino et al., 1990; Bates et al., 2016; Pinheiro et al., 2016). These analyses showed no significant correlation between the ob-servations. Moreover, the parameter estimates were strongly similar with and without accounting for the correlations employing the GEE approach. The Cox model was therefore used without the GEE ap-proach.
Since the study database contained millions of observations, ex-ploring multiple models employing the complete database was com-putationally prohibitive. We therefore decided tofirst explore the dif-ferent possible statistical models utilizing a random sample of 10% of the cohort. Because of the strong correlation between the meteor-ological parameters on a given day and their lagged values on 3 and 7 days, we decided to only consider the lagged values on 3 and 7 days and to do so in separate models.
A sequential approach has been used to decide how to include the explanatory variables in the final models (i.e., first including tem-perature only and deciding how to model its relationship with the outcomes, then adding relative humidity and atmospheric pressure at sea level and deciding how to model their relationship with the out-comes, etc.). The final models included all a priori selected potential confounders (see Section 2.3 in Methods section), except the
deprivation index and the mean number of outpatient consultations. We decided to remove these two potential confounders from the final model because they were not statistically significant. Also, removing these covariates did not notably alter the estimates for the meteor-ological parameters, which suggest they were not confounders. It was initially performed with the 3-day delayed effect (average of the tem-perature of the last three days, including the current day) and then applied to the 7-day delayed effect (average of the temperature of the last seven days, including the current day). Models were compared with each other on the basis of the Akaike information criterion (AIC) and the Bayesian information criterion (BIC) (Akaike, 1973; Schwarz, 1978). R2-scaled was also calculated in order to estimate the predictive
capacity of the models (O'Quigley et al., 2005).
To model the association between temperature and the risk of HF events, the following relationships were considered: a linear relation, a piecewise linear relation with breakpoints at−15 °C and 25 °C, a ca-tegorization of temperature in groups of 10 °C and a caca-tegorization of temperature in groups of 5 °C. The linear relation was retained on the basis of AIC and BIC. To model the association between PM2.5and risk
of HF events, the following relationships were considered: a linear re-lation, a linear relation with truncation of PM2.5values at a maximum
of 90μg/m3, a dichotomization around 10μg/m3, and a
dichotomiza-tion around 30μg/m3. The dichotomization around 30μg/m3 fitted
best and was retained, which is corresponding to the provincial legal standard on air quality (Règlement sur l'assainissement de l'atmosphère du Québec) (Lebel et al., 2012).
All analyses were performed using SAS 9.4 Statistical Software (SAS Institute Inc.: Cary, NC). All p-values were two-sided, and p-values of < 0.05 were considered to be statistically significant.
3. Results
Between April 1st 2001 and December 31st 2011 in Quebec, 112,793 elderly of 65 years and older diagnosed with HF were included in the study cohort. During the follow-up period, 21,157 HF events occurred, representing 18.7% of this population (only the first fol-lowing events were considered by person). Overall, 18,309 individuals were hospitalized and 4297 died of HF out of a total of 71,696,780 person-days, corresponding to a daily incidence of 0.03% (in some cases, hospitalization and death occurred the same day). Elderly in the cohort were followed for an average of 635 days.
Table 1presents the characteristics of individuals at the time of their entry into the cohort. There is a strong prevalence of cardiovas-cular risks factors among this population.
3.1. Effect of meteorological parameters on hospital admissions and death from HF
Among our elderly population, we found a linear association be-tween the mean temperature of the previous 3 and 7 days and the risk to experience a HF negative outcome. We observed the same types of associations regarding relative humidity and atmospheric pressure (graphics not shown).Table 2presents the risk of having a HF event (hospitalization or death) according to the lagged exposure of the mean temperature, relative humidity and atmospheric pressure of the last 3 and 7 days, considering both the influence of multiple individual and contextual covariates. As shown in this table, the risk of HF events in-creased about 0.7% for each decrease of 1 °C in the mean daily tem-perature in both lag models. The risk increased about 4.5% for each augmentation of 1 kPa in the atmospheric pressure but only with the longer lagged exposition. We did not find any statistical association between relative humidity and risk to be hospitalized or to die from HF regardless of the lag period. Our model also considered the impact of
Fig. 2. A) Areas covered by the Daymet data in the province of Quebec. B) Location of the measuring stations of Climat-Quebec for the daily mean temperature.
season on HF negative outcomes. We did find a statistical difference between the cold and the warm season for both lagged exposition periods under study. In fact, our results show a higher risk to be hos-pitalized or to die from HF in the winter period (October to April) compared to the summer period (May to September).
As mentioned above, multiple individual and contextual covariates have been taken into account in the measure of the association between the different meteorological parameters and HF events. In both models, all the confounders considered were found to have an impact on the study outcomes (seeTable 2).
Given that several classes of drugs of the CNS and of the cardio-vascular/renal systems have been reported to be potentially dangerous in periods of extreme heat, especially in elderly with chronic diseases (Blachère et al., 2011; Blachère et al., 2012), we conducted supple-mentary analyses with the individuals in the cohort who had available
data on medication. These data were available for 91.2% of the entire study cohort, representing 102,888 people.Table 3presents the results of the impact of the different meteorological parameters on the risk of HF events when taking into account the mean number of prescription drugs taken in the previous year related to the cardiovascular and the renal systems as well as the CNS. Our results show that the addition of these covariates in the models did not notably change the parameter estimates of the different meteorological variables or of the other covariates, both for the lag of 3 days and 7 days. As we can observe, an addition of one drug of the cardiovascular/renal systems or of the CNS in the year before the event significantly increases the risk to be hos-pitalized or to die from HF (of about 5% for drugs related to the car-diovascular and renal systems and 4% for drugs related to the CNS).
Overall, on the basis of the R2-scaled, the models presented explain from 20% to 22% of the risk of HF events.
Table 1
Characteristics of the study cohort (n = 112,793).
Mean age (years) ± SD 79.8 ± 7.9
Male sex, n (%) 54,728 (48.5)
Residential area, n (%)
CMA of Montreal (> 1 million inhabitants) 49,845 (44.2)
Other CMAs (100,000 to 1 million inhabitants) 20,054 (17.8)
CAs (10,000 to 100,000 inhabitants) 15,897 (14.1)
Rural areas (< 10,000 inhabitants) 26,997 (23.9)
Material and social deprivation index, n (%)
1 (most favoured) 9581 (8.5) 2 17,318 (15.3) 3 27,331 (24.2) 4 26,052 (23.1) 5 (most disadvantaged) 21,272 (18.9) Missing 11,239 (10.0)
Cardiovascular risk factors, n (%)
Hypertension 67,669 (60.0)
Coronary heart disease 69,406 (61.5)
Diabetes 35,754 (31.7)
Mean number of urgent services for CVDs (primary diagnosis) in the last 12 months ± SD
Hospitalizations 0.19 ± 0.56
Outpatient consultations 0.18 ± 0.89
Mean number of prescription drugs related to the cardiovascular and renal systems in the last 12 monthsa± SD 1.96 ± 1.92
Mean number of prescription drugs related to the CNS in the last 12 monthsb± SD 0.41 ± 0.82
CA: census agglomeration, CMA: census metropolitan area, CNS: central nervous system, CVDs: cardiovascular diseases, n: number, SD: standard deviation.
a9,939 individuals with missing data. b9,990 individuals with missing data.
Table 2
Lag effects of meteorological parameters on HF negative outcomes (n = 112,793). Parameters
(reference group)
Meteorological exposition
Lag 3-day Lag 7-day
RR 95% CI p-Value RR 95% CI p-Value
Mean of the daily meteorological exposition
Temperature (°C) 0.994 0.992 0.996 < 0.0001 0.993 0.991 0.995 < 0.0001 Relative humidity (%) 0.999 0.997 1.001 0.4342 0.998 0.996 1.001 0.1414 Atmospheric pressure at sea level (kPa) 1.009 0.986 1.033 0.4438 1.045 1.015 1.077 0.0035 Covariate associated with the meteorological exposition
Summer period (vs. winter period) 0.926 0.884 0.970 0.0013 0.947 0.903 0.994 0.0274 Individual and contextual covariates
Gender (vs. women) 1.048 1.019 1.078 0.0011 1.048 1.019 1.078 0.0011
Age 1.043 1.041 1.045 < 0.0001 1.043 1.041 1.045 < 0.0001
Hypertension (vs. absence) 1.452 1.406 1.500 < 0.0001 1.453 1.407 1.501 < 0.0001 Diabetes (vs. absence) 1.454 1.413 1.495 < 0.0001 1.454 1.414 1.496 < 0.0001 CHDs (vs. absence) 1.518 1.469 1.569 < 0.0001 1.518 1.469 1.569 < 0.0001 Number of emergency hospitalizations for CVDs in the last 12 months 1.054 1.037 1.071 < 0.0001 1.054 1.037 1.071 < 0.0001 Weekdays (vs. weekend days) 1.339 1.297 1.383 < 0.0001 1.339 1.297 1.383 < 0.0001 CMA of Montreal (vs. rural areas) 1.048 1.013 1.085 0.0075 1.049 1.013 1.086 0.0069 Other CMAs (vs. rural areas) 1.108 1.063 1.154 < 0.0001 1.106 1.062 1.153 < 0.0001 CAs (vs. rural areas) 1.038 0.993 1.086 0.1020 1.038 0.992 1.086 0.1043
Predictive power (R2-scaled) 0.201 0.202
3.2. PM2.5exposition - CMAs of Montreal and Quebec City
As mentioned above, the measure of the effect of PM2.5on HF
ne-gative outcomes was restricted to individuals in the cohort who were living in the CMAs of Montreal and Quebec City during the study period (n = 59,485). The influence of PM2.5air pollutant on the risk of HF
events was weak and not statistically significant for both 3-day and 7-day lag models (see Tables S1 and S2). Despite the addition of PM2.5to
the model and the area restriction to the largest CMAs in the province of Quebec, relative risks associated with the meteorological parameters and the covariates were quite similar to those of the entire cohort. 3.3. Sensitivity analyses
Additional analyses were conducted with temperature using a 1-day and a 2-day lagged exposure. We observed similar results to those ob-tained with the 3-day lagged exposure (results are presented in Table S3). As further sensitivity analyses, we have considered 1) a crude model that only included the three meteorological exposures of interest (temperature, humidity and atmospheric pressure), 2) a model that included the meteorological exposures and only adjusted for season, 3) a model that included the meteorological exposures and adjusted for season as well as individual potential confounders, and 4) a model that adjusted for all selected potential confounders and that included all two-way interactions between these covariates as well as squared terms for continuous potential confounders. The results of these sensitivity analyses were very similar to the main results and are not presented (the direction, the amplitude and the statistical significance of the es-timates remained the same).
4. Discussion
4.1. Meteorological parameters and HF events
Several studies have found a positive association between tem-perature and HF negative outcomes (e.g.:Goggins and Chan, 2017; Das et al., 2014; Qiu et al., 2013; Zanobetti et al., 2012; Gotsman et al., 2010; Inglis et al., 2008; Kolb et al., 2007). In the present study,
multiple individual and contextual covariates, including the con-sideration of cardiovascular risk factors and drugs potentially dan-gerous in situations of extreme climate, were took into account in the measure of the effect of temperature and other meteorological para-meters on hospitalizations or deaths for HF in elderly diagnosed with this disease in Quebec. Independently of these covariates, the associa-tion we found between mean temperature and risk of HF negative outcomes was linear and the risk was increasing with a decrease in the temperature. Our results showed that for each decrease of 1 °C in the daily mean temperature of the previous 3 and 7 days, the risk of HF events is increased of about 0.7%. In other words, a drop of 10 °C in the average temperature over 7 days, which is common in the province of Quebec because of seasonal variations, is associated with increased risk to be hospitalized or to die for the main cause of HF of about 7% in elderly diagnosed with this disease. In this study, it means about 1500 hospitalizations or deaths over a 10-year period, corresponding to 150 events per year. Although the relative risks of HF events associated with average temperature were relatively close to one in our analyses, we think that preventive instructions should be provided to individuals with this disease, especially since its management is expensive for the society. In 2011 and 2012 in Canada, elderly accounted for 78% of the patients with the most expensive hospitalization motives per diagnosis in the short-term cares; HF was ranked third, with costs estimated to 276 million dollars (Institut canadien d'information sur la santé, 2015).
Ourfindings also showed that, for each augmentation of 1 kPa in the atmospheric pressure at sea level, the risk of HF events significantly increases by about 4.5% but only in the 7-day lag model. According to Météo France (2016), high pressures are often accompanied with fog and low clouds in winter whereas it goes hand in hand with good weather in summer. Consequently, the increased risk of HF events on a 7-day period may represent a context of warm temperatures rather than cold temperatures although the interaction term with the season was not retained in thefinal models on the basis of the BIC and the AIC criteria (results not shown). According toKolb et al. (2007), the effect of pressure the day of the outcome or the day before, increased the risk of death for HF in summer but not in winter. Ourfindings also differ from what was found byDanet et al. (1999). These authors observed a 12% increase in the risk of fatal and non-fatal coronary events for each
Table 3
Lag effects of meteorological parameters on HF negative outcomes (including only elderly with drug information: n = 102,888). Parameters
(reference group)
Meteorological exposition
Lag 3-day Lag 7-day
RR 95% CI p-Value RR 95% CI p-Value
Mean of the daily meteorological exposition
Temperature (°C) 0.994 0.992 0.996 < 0.0001 0.993 0.991 0.995 < 0.0001 Relative humidity (%) 0.999 0.998 1.001 0.5340 0.999 0.996 1.001 0.2175 Atmospheric pressure at sea level (kPa) 1.011 0.986 1.035 0.3979 1.047 1.015 1.080 0.0036 Covariate associated with the meteorological exposition
Summer period (vs. winter period) 0.936 0.891 0.983 0.0076 0.959 0.912 1.008 0.1016 Individual and contextual covariates
Gender (vs. women) 1.046 1.016 1.077 0.0027 1.046 1.016 1.077 0.0026
Age 1.045 1.043 1.047 < 0.0001 1.045 1.043 1.047 < 0.0001
Hypertension (vs. absence) 1.421 1.373 1.470 < 0.0001 1.421 1.374 1.471 < 0.0001 Diabetes (vs. absence) 1.430 1.388 1.473 < 0.0001 1.430 1.389 1.473 < 0.0001 CHDs (vs. absence) 1.512 1.461 1.565 < 0.0001 1.512 1.460 1.565 < 0.0001 Number of emergency hospitalizations for CVDs in the last 12 months 1.051 1.033 1.069 < 0.0001 1.051 1.034 1.069 < 0.0001 Weekdays (vs. weekend days) 1.343 1.299 1.389 < 0.0001 1.343 1.299 1.389 < 0.0001 CMA of Montreal (vs. rural areas) 1.039 1.002 1.077 0.0389 1.039 1.003 1.078 0.0359 Other CMAs (vs. rural areas) 1.105 1.058 1.153 < 0.0001 1.103 1.057 1.152 < 0.0001 CAs (vs. rural areas) 1.028 0.981 1.077 0.2432 1.028 0.981 1.076 0.2486 Number of drugs related to the cardiovascular and renal systems in the last 12 months 1.053 1.046 1.060 < 0.0001 1.053 1.046 1.060 < 0.0001 Number of drugs related to the CNS in the last 12 months 1.041 1.023 1.059 < 0.0001 1.041 1.024 1.059 < 0.0001
Predictive power (R2-scaled) 0.218 0.219
CAs: census agglomerations, CHDs: coronary heart diseases, CI: confidence interval, CMA: census metropolitan area, CNS: central nervous system, CVDs: cardiovascular diseases, kPa: kilopascal, RR: relative risk.
decrease of 1 kPa under a pressure of 101.6 kPa and an 11% increase for each augmentation of 1 kPa over a pressure of 101.6 kPa (Danet et al., 1999). They reported a V-shape association between coronary events and pressure whereas the association is linear in our study (figure not shown). HF and coronary heart diseases are two distinct clinical entities and it may partially explain the divergence observed. However, similar toDanet et al. (1999), the effect of pressure is sub-stantial and independent of the temperature. More studies are needed on this topic in order to improve our understanding of the mechanisms underlying the impact of pressure on coronary heart diseases and other diseases of the cardiovascular system such as HF (Weinbacher et al., 1996).
There was no statistical association between daily relative humidity and acute risk of HF, not to mention that its interaction with tem-perature weighed down the models on the basis of AIC and BIC criteria. Others reported similar results.Kolb et al. (2007)found the same ob-servation between relative humidity and daily mortality in a population of elderly of 65 years and older diagnosed with HF regardless of the lag period, up to 10 days. The same pattern was observed inSchwartz et al. (2004). There was no clear association between humidity and the number of daily hospital admissions for CVDs in elderly, even when stratification was made for meteorological parameters (Schwartz et al., 2004).
Unlike several other studies, the results of our research revealed that the risk of HF events was larger in winter period than in summer period (Boulay et al., 1999; Martínez-Sellés et al., 2002; Ogawa et al., 2007; Barnett et al., 2008; Díaz et al., 2007; Gallerani et al., 2011; Oktay et al., 2009; Jorge et al., 2009). OnlyStewart et al. (2002)reported the same effect of winter on HF events. However, they observed a larger effect than ours. According toFares (2013), cold temperatures tend to increase peripheral vasoconstriction resulting in pulmonary edema as a consequence of left ventricular failure. Moreover, in patients with symptomatic HF, the exposition to cold temperatures could decrease the exercise capacity and increase the systemic adrenergic activity (Fares, 2013).
4.2. PM2.5exposure - CMAs of Montreal and Quebec City
The effect of fine particulate matter on the health outcomes of in-terest for the CMAs of Montreal and Quebec City was weak and not significant. However, a meta-analysis performed byShah et al. (2013), reported a clear and a robust temporal association between PM2.5
ex-posure and hospitalizations as well as deaths for HF. The strongest as-sociation was observed on the day of the HF events (lag 0) while risks decreased with longer lag periods (lag 1 and lag 2). In the present study, we used lagged exposure periods of 3 and 7 days. On the other hand, the threshold of 10μg/m3retained in the meta-analysis, was more se-vere than the one used in the present study (30μg/m3), corresponding
to the Quebec legal standard on air quality (Shah et al., 2013; Lebel et al., 2012).
Moreover, our cohort consisted of sick elderly. This kind of popu-lation is usually more confined in their residence than the general po-pulation and thus, less exposed to air pollution (Donnio, 2002). Despite abundant literature on the effect of fine particulate matter on health, there is limited evidence that the climate change itself will have an impact on the long-term levels of particles according to the Inter-governmental panel on climate change (Intergovernmental Panel on Climate Change, 2013, 2014).
Finally, it was noteworthy that the increase in the number of drugs prescribed to treat cardiovascular and renal health problems and the number of drugs related to the CNS in the previous year were associated with a higher risk of HF events regardless of the lag period. A report published by the Institut national de santé publique du Québec confirms the hypothesis that several classes of drugs of the CNS are considered at risk during period of extreme heat (Blachère et al., 2011). In fact, these classes of drugs (e.g., antidepressants, antiepileptic drugs, lithium salts)
are likely to aggravate the exhausting-dehydration syndrome and heat stroke during periods of heatwaves (Blachère et al., 2011). Moreover, neurohumoral activation is partially dependent of central nervous system pathways. In addition to the regulation of sympathetic outflow, these central pathways coordinate a complex network of agents with an established pathophysiological relevance in HF such as angiotensin, aldosterone, and proinflammatory cytokines (Sousa-Pinto et al., 2014). A similar report has been published by the Institut national de santé publique du Québec in regards of certain classes of drugs of the cardio-vascular and renal systems (Blachère et al., 2012). In absence of proper adaptations, extreme temperatures can alter the organism acclimati-zation by potentiating the side effects of several classes of drugs used to treat CVDs (e.g., diuretics, antiarrhythmics) such as electrolytes im-balance and hypotension.
4.3. Strengths and limitations
Using a time frame of 10 years, this longitudinal study on a cohort of > 120,000 elderly adequately assessed the impact of several me-teorological parameters on the risk of HF events in individuals already diagnosed with this condition. The QICDSS database allowed measuring the daily occurrence of HF events more accurately than standard eco-logical studies (i.e., Bayentin et al., 2010). In addition, through this database giving individual health information, it was possible to take into account other risk factors (i.e., hypertension, diabetes and cor-onary heart diseases) in the measure of the association between me-teorological parameters and risk of hospitalizations and deaths for HF. The use of Daymet and Climat-Quebec data with high spatial and tem-poral resolutions is also a strength of this study.
Nevertheless, some limitations should be acknowledged. First of all, it was initially planned to use a multilevel Cox regression in order to quantify the importance of the correlation of the observations in a same CT or CSD. However, the statistical software was not powerful enough to treat the study database which contained millions of observations. On the other hand, the estimation of Cox models employing a pooled logistic regression estimated with GEE showed a negligible correlation between the observations of a same area. Therefore, it is possible that the contribution of the living environment is weak when the health condition of interest assessed is as severe as HF and in an aged popu-lation. Further studies should be performed with more powerful soft-ware like TESSERA in order to evaluate its importance (Ryan, 2015). The legal and security restrictions related to the QICDSS database did not allow the use of such software.
Everywhere on the planet including in Quebec, literature about health and climate changes abounds especially since the last 10 years. To that end, multiple approaches with linear and nonlinear models were used to analyze the association between meteorology and several health outcomes. Consequently, conclusions are different from one study to another and it is therefore challenging to make comparisons. Besides, in the present study, we evaluated the meteorological exposi-tion of the previous 3 and 7 days due to a strong correlaexposi-tion between the variables of the current day. Finally, the outcome of interest com-bined hospitalizations and deaths for HF, because considering the outcomes separately resulted in a substantial number of CTs and CSDs with fewer than 2 events. In other words, we had to adapt the statistical approach to our data.
5. Conclusions
This study has shown an increased risk of HF events in elderly of 65 years and older diagnosed with this disease in Quebec for each drop of 1 °C in the mean temperature of the previous 3 days as well as of the previous 7 days independently of the presence of individual risk factors. To our knowledge, this is thefirst study of this kind performed in Canada. It paves the way to the realization of further studies in order to support the surveillance of chronic cardiovascular diseases in a context
of climate changes.
Every statistical model presented explains from 20% to 22% of the risk of HF events. The addition of other parameters in the models such as variables related to medical acts would be interesting for the eva-luation of several conditions that limits the patient's compliance to treatment, self-monitoring and follow-up consultations. In conclusion, with appropriate statistical software that supports interrupted time series analyses, a two-step approach would be a good way to address individuals and contextual dimensions.
Funding source
This study wasfinancially supported by the Green Fund as part of the action plan of 2006–2012 on climate changes of the government of Quebec, Canada.
Conflict of interest
The authors declare no conflict of interest. Acknowledgment
The authors would like to acknowledge the INSPQ for the access granted to the QICDSS database to conduct this study.
Appendix A. Supplementary data
Supplementary data to this article can be found online athttp://dx. doi.org/10.1016/j.envint.2017.06.001.
References
Akaike, H., 1973. Information theory and an extension of the maximum likelihood principle. In: Petrov, B.N., Csáki, F. (Eds.), 2nd International Symposium on Information Theory, Tsahkadsor, Armenia, USSR, September 2–8, 1971. Budapest, Akadémiai Kiadó, pp. 267–281.
Anderson, B.G., Bell, M.L., 2009. Weather-related mortality: how heat, cold, and heat waves affect mortality in the United States. Epidemiology 20 (2), 205–213.http://dx. doi.org/10.1097/EDE.0b013e318190ee08.
Barnett, A.G., de Looper, M., Fraser, J.F., 2008. The seasonality in heart failure deaths and total cardiovascular deaths. Aust. N. Z. J. Public Health 32 (5), 408–413.http://dx. doi.org/10.1111/j.1753-6405.2008.00270.x.
Basu, R., Samet, J.M., 2002. Relation between elevated ambient temperature and mor-tality: a review of the epidemiologic evidence. Epidemiol. Rev. 24 (2), 190–202.
http://dx.doi.org/10.1093/epirev/mxf007.
Bates, D., Maechler, M., Bolker, B., Walker, S., Haubo Bojesen Christensen, R., Singmann, H., et al., 2016. Linear Mixed-effects Models Using ‘Eigen’ and S4. ( https://cran.r-project.org/web/packages/lme4/lme4.pdf. accessed 02.04.2016).
Bayentin, L., El Adlouni, S., Ouarda, T.B., Gosselin, P., Doyon, B., Chebana, F., 2010. Spatial variability of climate effects on ischemic heart disease hospitalization rates for the period 1989–2006 in Quebec, Canada. Int. J. Health Geogr. 9, 5.http://dx.doi. org/10.1186/1476-072X-9-5.
Bélanger, D., Abdous, B., Valois, P., Gosselin, P., Laouan Sidi, E.A., 2016. A multilevel analysis to explain self-reported adverse health effects and adaptation to urban heat: a cross-sectional survey in the deprived areas of 9 Canadian cities. BMC Public Health 16 (1), 144.http://dx.doi.org/10.1186/s12889-016-2749-y.
Blachère, J.-C., Perreault, S., Bélanger, D., Gosselin, P., Côté, R., Kergoat, M.-J., et al., 2011. Médicaments du système nerveux central et canicules: Rapport et re-commandations. Institut national de santé publique du Québec, Canada(Québec, Québec, Canadahttps://www.inspq.qc.ca/pdf/publications/1199_
MedSystemeNerveuxCanicules.pdf. (accessed 20.04.2016)).
Blachère, J.-C., Perreault, S., Bélanger, D., Gosselin, P., Côté, R., Kergoat, M.-J., et al., 2012. Médicaments Du Système Cardiovasculaire et Canicules: Rapport et Recommandations. Institut national de santé publique du Québec, Canada(Québec, Québec, Canadahttps://www.inspq.qc.ca/pdf/publications/1446_
MedSystemesCardiovascuRenalCanicules.pdf. (accessed 20.04.2016)). Blais, C., Dai, S., Waters, C., Robitaille, C., Smith, M., Svenson, L.W., et al., 2014.
Assessing the burden of hospitalized and community-care heart failure in Canada. Can. J. Cardiol. 30 (3), 352–358.http://dx.doi.org/10.1016/j.cjca.2013.12.013. Boulay, F., Berthier, F., Sisteron, O., Gendreike, Y., Gibelin, P., 1999. Seasonal variation
in chronic heart failure hospitalizations and mortality in France. Circulation 100 (3), 280–286.http://dx.doi.org/10.1161/01.CIR.100.3.280.
Braga, A.L., Zanobetti, A., Schwartz, J., 2002. The effect of weather on respiratory and cardiovascular deaths in 12 US cities. Environ. Health Perspect. 110 (9), 859–863. Climat-Québec, 2016. Interfaces cartographiques. (http://climat-quebec.qc.ca/home.
php?id=accueil&mpn=accueil. (accessed 09.11.2015)).
D'Agostino, R.B., Lee, M.-L., Belanger, A.J., Cupples, L.A., Anderson, K., Kannel, W.B., 1990. Relation of pooled logistic regression to time dependent Cox regression ana-lysis: the Framingham Heart Study. Stat. Med. 9 (12), 1501–1515.http://dx.doi.org/ 10.1002/sim.4780091214.
Danet, S., Richard, F., Montaye, M., Beauchant, S., Lemaire, B., Graux, C., et al., 1999. Unhealthy effects of atmospheric temperature and pressure on the occurrence of myocardial infarction and coronary deaths: a 10-year survey: the Lille-World Health Organization MONICA project (Monitoring trends and determinants in cardiovas-cular disease). Circulation 100 (1), e1–e7.http://dx.doi.org/10.1161/01.CIR.100. 1.e1.
Das, D., Bakal, J.A., Westerhout, C.M., Hernandez, A.F., O'Connor, C.M., Atar, D., et al., 2014. The association between meteorological events and acute heart failure: new insights from ASCEND-HF. Int. J. Cardiol. 177 (3), 819–824.http://dx.doi.org/10. 1016/j.ijcard.2014.11.066.
Díaz, A., Ferrante, D., Badra, R., Morales, I., Becerra, A., Varini, S., et al., 2007. Seasonal variation and trends in heart failure morbidity and mortality in a South American community hospital. Congest. Heart Fail. 13 (5), 263–266.
Donat, M.G., Alexander, L.V., Yang, H., Durre, I., Vose, R., Dunn, R.J.H., et al., 2013. Updated analyses of temperature and precipitation extreme indices since the begin-ning of the twentieth century: the HadEX2 dataset. J. Geophys. Res. Atmos. 118 (5), 2098–2118.http://dx.doi.org/10.1002/jgrd.50150.
Donnio, I., 2002. La prévention de l'isolement et du confinement domiciliaire des per-sonnes âgées. Gérontologie 122, 2–7.
Doyon, B., Bélanger, D., Gosselin, P., 2008. The potential impact of climate change on annual and seasonal mortality for three cities in Québec, Canada. Int. J. Health Geogr. 7, 23.http://dx.doi.org/10.1186/1476-072X-7-23.
Fares, A., 2013. Winter cardiovascular diseases phenomenon. N. Am. J. Med. Sci. 5 (4), 266–279.http://dx.doi.org/10.4103/1947-2714.110430.
Gallerani, M., Boari, B., Manfredini, F., Manfredini, R., 2011. Seasonal variation in heart failure hospitalization. Clin. Cardiol. 34 (6), 389–394.http://dx.doi.org/10.1002/ clc.20895.
Goggins, W.B., Chan, E.Y., 2017. A study of the short-term associations between hospital admissions and mortality from heart failure and meteorological variables in Hong Kong: weather and heart failure in Hong Kong. Int. J. Cardiol. 228, 537–542.http:// dx.doi.org/10.1016/j.ijcard.2016.11.106.
Gotsman, I., Zwas, D., Admon, D., Lotan, C., Keren, A., 2010. Seasonal variation in hospital admission in patients with heart failure and its effect on prognosis. Cardiology 117 (4), 268–274.http://dx.doi.org/10.1159/000323511.
Government of Canada, 2013. Environment and Climate Change. National air pollution surveillance program (NAPS), Canada(http://www.ec.gc.ca/rnspa-naps/default.asp? lang=En&n=5C0D33CF-1(accessed 02.11.2015)).
Hawkins, N.M., Jhund, P.S., McMurray, J.J.M., Capewell, S., 2012. Heart failure and socioeconomic status: accumulating evidence of inequality. Eur. J. Heart Fail. 14 (2), 138–146.http://dx.doi.org/10.1093/eurjhf/hfr168.
He, J., Ogden, L.G., Bazzano, L.A., Vupputuri, S., Loria, C., Whelton, P.K., 2001. Risk factors for congestive heart failure in US men and women: NHANES I epidemiologic follow-up study. Arch. Intern. Med. 161 (7), 996–1002.
Huang, J., Wang, J., Yu, W., 2014. The lag effects and vulnerabilities of temperature effects on cardiovascular disease mortality in a subtropical climate zone in China. Int. J. Environ. Res. Public Health 11 (4), 3982–3994.http://dx.doi.org/10.3390/ ijerph110403982.
Inglis, S.C., Clark, R.A., Shakib, S., Wong, D.T., Molaee, P., Wilkinson, D., Stewart, S., 2008. Hot summers and heart failure: seasonal variations in morbidity and mortality in Australian heart failure patients (1994–2005). Eur. J. Heart Fail. 10 (6), 540–549.
http://dx.doi.org/10.1016/j.ejheart.2008.03.008.
INSPQ, 2016. Indice de défavorisation. Mesure de défavorisation: Matérielle ou sociale. ( https://www.inspq.qc.ca/expertises/habitudes-de-vie-et-prevention-des-maladies- chroniques/nutrition-activite-physique-et-problemes-lies-au-poids/portrait-de-l-environnement-bati-et-de-l-environnement-des-services/indice-de-defavorisation
(accessed 05.12.2015)).
Institut canadien d'information sur la santé, 2015. Principaux coûts des séjours en soins de courte durée en 2012–2013: Fiche d'information. (https://www.cihi.ca/fr/cad_ costingdata_infosheet14_fr.pdf. (accessed 15.05.2016)).
Intergovernmental Panel on Climat Change, 2014. Climate Change 2014. Impacts, adaptation, and vulnerability. Part A: global and sectoral aspects. In: Working Group II Contribution to the IPCC Fifth Assessment Report, (ISBN: 9781107641655). Intergovernmental Panel on Climate Change, 2013. Climate Change 2013: The Physical
Science Basis. (http://www.climatechange2013.org/images/report/WG1AR5_ALL_ FINAL.pdf. (accessed 15.04.2016)).
Jorge, J.E.L., Cagy, M., Mesquita, E.T., da Costa, T.L.M., Moscavitch, S.D., Rosa Garcia, M.L., 2009. Seasonal variation in hospitalizations due to heart failure in Niterói City, Southeastern Brazil. Rev. Saude Publica 43 (3), 555–557.
Kenny, G.P., Yardley, J., Brown, C., Sigal, R.J., Jay, O., 2010. Heat stress in older in-dividuals and patients with common chronic diseases. CMAJ 182 (10), 1053–1060.
http://dx.doi.org/10.1503/cmaj.081050.
Khatibzadeh, S., Farzadfar, F., Oliver, J., Ezzati, M., Moran, A., 2013. Worldwide risk factors for heart failure: a systematic review and pooled analysis. Int. J. Cardiol. 168 (2), 1186–1194.http://dx.doi.org/10.1016/j.ijcard.2012.11.065.
Kolb, S., Radon, K., Valois, M.-F., Héguy, L., Goldberg, M.S., 2007. The short-term in-fluence of weather on daily mortality in congestive heart failure. Arch. Environ. Occup. Health 62 (4), 169–176.http://dx.doi.org/10.3200/AEOH.62.4.169-176. Lebel, G., Busque, D., Therrien, M., Walsh, P., Paradis, J., Brault, M.P., et al., 2012. Bilan
de la qualité de l'air au Québec en lien avec la santé, 1975–2009. (https://www. inspq.qc.ca/pdf/publications/1432_BilanQualiteAirQcLienSante1975-2009.pdf. (ac-cessed 05.05.2016)).
Luber, G., Lemery, J., 2015. Global Climate Change and Human Health: From Science to
Practice. Jossey-Bass (672 p. ISBN: 978-1-118-50557-1).
Martínez-Sellés, M., García Robles, J.A., Prieto, L., Serrano, J.A., Muñoz, R., Frades, E., et al., 2002. Annual rates of admission and seasonal variations in hospitalizations for heart failure. Eur. J. Heart Fail. 4 (6), 779–786.
Medina-Ramón, M., Goldberg, R., Melly, S., Mittleman, M.A., Schwartz, J., 2008. Residential exposure to traffic-related air pollution and survival after heart failure. Environ. Health Perspect. 116 (4), 481–485.http://dx.doi.org/10.1289/ehp.10918. Météo France, 2016. La pression.
http://www.meteofrance.fr/prevoir-le-temps/observer-le-temps/parametres-observes/pression(accessed 21.05.2015).
Ngom, R., Gosselin, P., Blais, C., Rochette, L., 2013. Adaptation to climate change in environmental health through primary prevention: an applied example with green spaces for urbanized regions in the province of Quebec. In: XVth International Medical Geography Symposium. Michigan, United States.
Ogawa, M., Tanaka, F., Onoda, T., Ohsawa, M., Itai, K., Sakai, T., Okayama, A., et al., 2007. A community based epidemiological and clinical study of hospitalization of patients with congestive heart failure in Northern Iwate, Japan. Circ. J. 71 (4), 455–459.
Oktay, C., Luk, J.H., Allegra, J.R., Kusoglu, L., 2009. The effect of temperature on illness severity in emergency department congestive heart failure patients. Ann. Acad. Med. Singap. 38 (12), 1081–1084.
O'Quigley, J., Xu, R., Stare, J., 2005. Explained randomness in proportional hazards models. Stat. Med. 24 (3), 479–489.http://dx.doi.org/10.1002/sim.1946. ORNL DAAC, 2016. About ORNL DAAC. (https://daac.ornl.gov/about_us.shtml. (accessed
10.11.2015)).
Ouranos, 2015. Vers l'adaptation. Synthèse des connaissances sur les changements cli-matiques au Québec. Partie 1: Évolution climatique au Québec, Édition 2015. (Montréal, Québec (Canada)https://ouranos.ca/wp-content/uploads/2016/02/ SynthesePartie1.pdf. (accessed 02.05.2016)).
Pampalon, R., Raymond, G., 2000. A deprivation index for health and welfare planning in Quebec. Chronic Dis. Can. 21 (3), 104–113.
Pinheiro, J., Bates, D., DebRoy, S., Sarkar, D., Heisterkamp, S., Willigen, B.V., 2016. Linear and Nonlinear Mixed Effects Models. (https://cran.r-project.org/web/ packages/nlme/nlme.pdf(accessed 28.05.2016)).
Portier, C.J., Thigpen Tart, K., Carter, S.R., Dilworth, C.H., Grambsch, A.E., Gohlke, J., et al., 2010. A Human Health Perspective on Climate Changes: A Report Outlining the Research Needs on the Human Health Effects of Climate Change. (https://www. niehs.nih.gov/health/materials/a_human_health_perspective_on_climate_change_full_ report_508.pdf(accessed 02.06.2016)).
Qiu, H., Yu, I.T., Tse, L.A., Tian, L., Wang, X., Wong, T.W., 2013. Is greater temperature change within a day associated with increased emergency hospital admissions for heart failure? Circ. Heart Fail. 6 (5), 930–935.http://dx.doi.org/10.1161/ CIRCHEARTFAILURE.113.000360.
Roger, V.L., 2013. Epidemiology of heart failure. Circ. Res. 113 (6), 646–659.http://dx.
doi.org/10.1161/CIRCRESAHA.113.300268.
Ryan, L., 2015. Environmetrics in the big data era. In: Conference of The International Environmetrics Society. United Arab Emirates University, Al-Aïn.
Schwartz, J., Samet, J.M., Patz, J.A., 2004. Hospital admissions for heart disease: the effects of temperature and humidity. Epidemiology 15 (6), 755–761.http://dx.doi. org/10.1097/01.ede.0000134875.15919.0f.
Schwarz, G., 1978. Estimating the dimension of a model. Ann. Stat. 6, 461–464. Shah, A.S.V., Langrish, J.P., Nair, H., McAllister, D.A., Hunter, A.L., Donaldson, K., et al.,
2013. Global association of air pollution and heart failure: a systematic review and meta-analysis. Lancet 382 (9897), 1039–1048. http://dx.doi.org/10.1016/S0140-6736(13)60898-3.
Sousa-Pinto, B., Ferreira-Pinto, M.J., Santos, M., Leite-Moreira, A.F., 2014. Central ner-vous system circuits modified in heart failure: pathophysiology and therapeutic im-plications. Heart Fail. Rev. 19 (6), 759–779. http://dx.doi.org/10.1007/s10741-014-9427-x.
Statistics Canada, 2015a. Dissemination Area (DA). ( http://www.statcan.gc.ca/pub/92-195-x/2011001/geo/da-ad/da-ad-eng.htm(accessed 20.05.2016)).
Statistics Canada, 2015b. Census Tract (CT). ( http://www12.statcan.gc.ca/census-recensement/2011/ref/dict/geo013-eng.cfm(accessed 20.05.2016)). Statistique Canada, 2015c. Postal code conversionfile plus (PCCF+) (82F0086X).
(http://www5.statcan.gc.ca/olc-cel/olc.action?ObjId=82F0086X&ObjType=2& lang=en&limit=0(accessed 02.11.2015)).
Stewart, S., McIntyre, K., Capewell, S., McMurray, J.J.V., 2002. Heart failure in a cold climate. J. Am. Coll. Cardiol. 39 (5), 760–766. http://dx.doi.org/10.1016/S0735-1097(02)01685-6.
Tian, Z., Li, S., Zhang, J., Jaakkola, J.J.K., Guo, Y., 2012. Ambient temperature and coronary heart disease mortality in Beijing, China: a time series study. Environ. Health 11, 56.http://dx.doi.org/10.1186/1476-069X-11-56.
Vanasse, A., Cohen, A., Courteau, J., Bergeron, P., Dault, R., Gosselin, P., et al., 2016. Association betweenfloods and acute cardiovascular diseases: a population-based cohort study using a geographic information system approach. Int. J. Environ. Res. Public Health 13 (2), 168.http://dx.doi.org/10.3390/ijerph13020168.
Weinbacher, M., Martina, B., Bart, T., Drewe, J., Gasser, P., Gyr, K., 1996. Blood pressure and atmospheric pressure. Ann. N. Y. Acad. Sci. 783, 335–336.http://dx.doi.org/10. 1111/j.1749-6632.1996.tb26737.x.
Yu, W.W., Hu, W.B., Mengersen, K., 2011. Time course of temperature effects on cardi-ovascular mortality in Brisbane, Australia. Heart 97 (13), 1089–1093.http://dx.doi. org/10.1136/hrt.2010.217166.
Zanobetti, A., O'Neill, M.S., Gronlund, C.J., Schwartz, J.D., 2012. Summer temperature variability and long-term survival among elderly people with chronic disease. Proc. Natl. Acad. Sci. U. S. A. 109 (17), 6608–6613.http://dx.doi.org/10.1073/pnas. 1113070109.