HAL Id: hal-01846914
https://hal.archives-ouvertes.fr/hal-01846914
Submitted on 8 Nov 2019
HAL is a multi-disciplinary open access
archive for the deposit and dissemination of sci-entific research documents, whether they are pub-lished or not. The documents may come from teaching and research institutions in France or abroad, or from public or private research centers.
L’archive ouverte pluridisciplinaire HAL, est destinée au dépôt et à la diffusion de documents scientifiques de niveau recherche, publiés ou non, émanant des établissements d’enseignement et de recherche français ou étrangers, des laboratoires publics ou privés.
Schweich
To cite this version:
Li Chen, Capucine Dupont, Sylvain Salvador, Guillaume Boissonnet, Daniel Schweich. Influence of particle size, reactor temperature and gas phase reactions on fast pyrolysis of beech wood. In-ternational Journal of Chemical Reactor Engineering, De Gruyter, 2010, 8, p.1-19. �10.2202/1542-6580.1922�. �hal-01846914�
Li Chen, Capucine Dupont, Sylvain Salvador, Guillaume Boissonnet, and Daniel Schweich
Abstract
In the present work, a drop tube reactor (DTR) and a horizontal tubular reactor (HTR) were used to study the pyrolysis behaviour of beech wood particles of dif-ferent sizes under the conditions encountered in industrial fluidized bed gasifiers, namely high external heat flux (105 – 106 W.m 2) and high temperature (800 –
1000 C). The influence of the reactor temperature (800 and 950 C), of particle size (from 350 µm to 6 mm), and of gas residence time (from 1 to 10 s) were examined. Under the explored conditions, when pyrolysis is finished, more than 80 wt.% of virgin wood is converted into gas and less than 13 wt.% remains in solid. In the gas phase, CO is the main gaseous product (50 wt.% of virgin wood), followed by H2 (molar ratios of H2/CO are between 0.35 to 0.55), H2O, CO2and
CH4. Species C2H2, C2H4, C2H6 and C6H6 are present in much lower amounts.
The increase of temperature increases the rate of solid devolatilization and favours the cracking reactions of hydrocarbons. The increase of particle size increases the required time for completing pyrolysis. Meanwhile, the results obtained at 950 C show that the final products distribution at the end of pyrolysis is almost the same for the particles between 350 and 800 µm. The increase of the particle size from 800 µm to 6 mm seems to have some influence on the final products distribution. The gas phase reactions mainly change the yields of light hydrocarbons and H2:
the increase of gas residence time favours the cracking reactions of hydrocarbons and thus leads to a higher H2 yield.
KEYWORDS: biomass, fast pyrolysis, drop tube reactor, horizontal tubular re-actor, gas phase reactions, particle size, high temperature
1.
Introduction
Biomass, as a renewable CO2-neutral energy source, is widely available and
increasingly used as an alternative to fossil fuel for energy supply. The thermochemical conversion of biomass to produce fuel gas (mainly CO and H2)
via gasification is considered as one of the most promising processes. The fluidized bed reactor constitutes a good option for large-scale applications of biomass gasification notably due to its high heat and mass transfer efficiency. Pyrolysis is the first step in the gasification process, and is of crucial importance since during pyrolysis up to 70-90 % of feed biomass can be converted into volatiles (Dupont 2006).
Biomass pyrolysis is a complex process including both physical and chemical phenomena. Some research efforts (Pyle and Zaror 1984; Chan, Kelbon et al. 1985; Simmons 1986; Peters and Bruch 2003) have been devoted to the study of the relative importance between heat transfer processes and chemical reactions during pyrolysis by using a characteristic times analysis that was initially proposed by Damköhler (1936). Recently, Dupont et al. (2007) estimated the characteristic times of these phenomena under the operating conditions encountered in fluidized bed gasifiers. Their results indicated that in the temperature range between 800 and 950°C, the pyrolysis of wood particles smaller than 100 µm was controlled by chemical reactions while the thermal regime was governing only for particles larger than 10 mm. For particles between 100 µm and 10 mm, the pyrolysis was found to occur in a transitional regime, in which both chemical reactions and heat transfer processes should be taken into account.
A lot of researchers (for example, (Brink and Massoudi 1978; Biagini, Fantozzi et al. 2004)) have used TGA to study the intrinsic kinetic of biomass devolatilization with small particles (~100 µm). Attention has also been paid to the pyrolysis of large particles (>10 mm) in thermal regime (Gronli 1996; Lu 2006; Bellais 2007). However, only few experimental results can be found in the literature (Zanzi, Sjostrom et al. 1996; Dupont 2006; Xiu, Li et al. 2006; Couhert 2007; Lehto 2007) concerning the pyrolysis of particles between 100 µm and 10 mm, under the typical heating conditions encountered in fluidized gasifiers, namely high heat flux (105 –106 W.m-2) and high temperature (> 800°C).
For this reason, this paper deals with an experimental study on the pyrolysis behaviour of beech wood particles covering a large range of sizes (350 µm; 500 µm; 700 µm; 800 µm; 2 mm; 6 mm) under atmospheric pressure, high external heat flux, and temperatures of 800 and 950°C.
The experiments were performed in a drop tube reactor (DTR) with particles between 350 and 800 µm. For larger particles, the solid residence time is
too limited in this reactor configuration so that a horizontal tubular reactor (HTR) was used with particles between 800 µm and 6 mm to complete the study.
2.
Experimental section
2.1. Materials
Beech wood was selected as the biomass sample in present work. The particles smaller than 1 mm were sieved and classified to obtain fractions of uniform particle size. The large particles were classified through their thickness (Table 1).
Table 1. Characteristics of the beech wood samples Small particles
Average paticle size (µm) Moisture (%)
350 6.5 500 6.5 700 7.2 800 7.5 Large particles Particle size (mm)
(Length ×Width ×Thickness) Moisture (%)
5 × 2 × 2 10.4
20 ×10 ×6 11.8
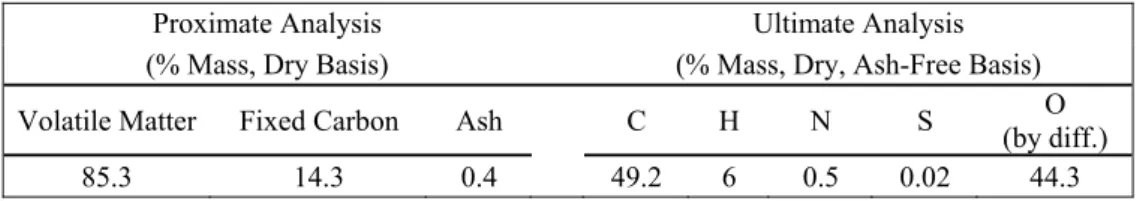
No significant differences were observed for the samples on the proximate and ultimate analysis except on moisture (see Table 1). Therefore only an average value of the analysis is given in Table 2.
Table 2. Proximate and ultimate analysis of the sample
Proximate Analysis Ultimate Analysis
(% Mass, Dry Basis) (% Mass, Dry, Ash-Free Basis)
Volatile Matter Fixed Carbon Ash C H N S (by diff.) O
2.2. Methods
2.2.1. Drop Tube Reactor (DTR)
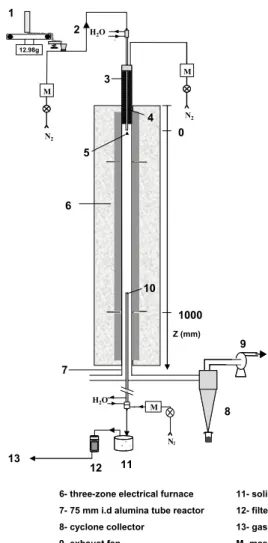
The drop tube reactor (DTR) is depicted in Figure 1. It has already been previously described in detail by Van de Steene (1999) and Commandré (2002). This facility is designed to produce external heat fluxes at particle surface higher than about 1 10× 5W m⋅ −2. It consists of an alumina tube of 2000×75 mm (L×i.d.),
inserted in a vertical electric heater made of three independent heating zones, with a total isothermal reaction zone of 1000 mm.
Wood particles were continuously fed by a controlled weighing system and injected into the reactor with a transport N2 stream through a water-cooled
feeding tube. A dispersion dome was placed at the outlet of the feeding tube to distribute the wood particles over the reactor cross section. Another N2 stream
passed through a pre-heater to reach the reactor temperature and met the wood particles at the dispersion dome. A water-cooled sampling probe was inserted from the bottom of the reactor to collect solid and gas. The reaction zone length (and thus the residence time of solid and gas) could be varied by setting the sampling probe at different heights. A representative fraction (about 2/3) of the exhaust gas was sucked in the sampling probe, then passed through a char collection pot and a filter and a part of it was sent to the gas analysis system (see 2.2.3).
The flow rate of total N2 stream, the sum of the cold transport stream and
the pre-heated stream, were of 18.8 and 16.5 L min⋅ −1 (at STP) at 800 and 950°C
respectively, in order to keep the same N2 velocity in the reactor. The flow rate of
H2O M N2 M 12.98g 2 3 4 5 6 10 8 11 12 7 H2O M N2 9 13 Z (mm) 0 1000 1
1- controlled weighing system 2- pneumatic transport 3- electrical preheater 4- water-cooled feeding probe 5- dispersion dome
6- three-zone electrical furnace 7- 75 mm i.d alumina tube reactor 8- cyclone collector
9- exhaust fan
10- water-cooled sampling probe
11- solid collection pot 12- filter
13- gas analysers
M- mass flow meter and controller N2
Figure 1. Scheme of the DTR The main parameters studied in the DTR are listed in Table 3.
Table 3. Main parameters studied in the DTR
Parameters Values
Particle size (µm) 350, 500, 700 and 800
Temperature (°C) 800 and 950
Under the explored conditions, the solid residence time was estimated to fall between 0.5 and 2.5 s for the sample of 350 µm, and between 0.3 and 0.7 s for the sample of 800 µm (Chen, Couhert et al. 2009).
2.2.2. Horizontal Tubular Reactor (HTR)
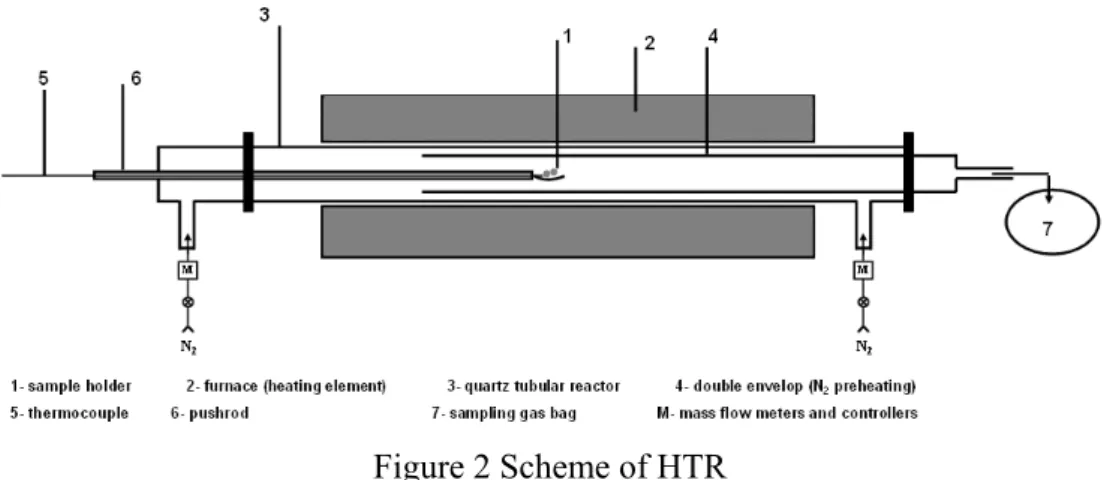
The horizontal tubular reactor (HTR) is depicted in Figure 2. It has been described in detail by Couhert (2007). This facility is designed to produce external heat fluxes at particle surface up to 5 10× 4 W m⋅ −2(Dufour 2007). It consists of a quartz tube heated by electrical resistances at temperatures up to 1000°C. A double envelop configuration is used to preheat the carrier gas before meeting the solid sample. The sizes of the outer and inners tube are 1290×70 mm (L×i.d.) and 850× 55 mm (L× i.d.) respectively. The heated zone has a length of 620 mm. During the test, the isothermal gas phase reaction zone, i.e. the zone between the position of the sample holder and the end of the heated zone has a length of 320 mm.
Figure 2 Scheme of HTR
Wood particles were weighed in a sample holder made of a stainless steel grid; the holder was driven by a pushrod and initially set in the cold zone of the reactor. The system was purged by N2. 50 % of the injected N2 was preheated
through the double envelope, while the other 50 % of the injected N2 remained
cold in order to sweep the solid particles to avoid wood devolatilization before the beginning of the test. The temperature in the cold zone was not higher than 120°C during this stage. During the experiments, the outlet of the reactor was firstly connected to the gas analyzers to check the oxygen concentration. Once it was ensured that no oxygen remained, the reactor outlet was connected to a sampling
bag. The sample holder was then quickly pushed to the centre of the heated zone. At the end of the experiment, the sample holder was pulled back in the inert cold atmosphere to cool down, and then weighed. The sampling bag was connected to the gas analysis system (see 2.3.3) for the measurement of the gaseous components yields.
The solid residence time was set to 3 min in order to ensure that the pyrolysis was finished and that all the pyrolysis products completely left the reactor. The gas residence time in the isothermal gas phase reaction zone was controlled by the gas mass flow rate by assuming that the gas produced by pyrolysis could be negligible. The initial solid mass was of about 0.5 g for the sample of 800 µm, which was approximately placed as a monolayer of particles over the holder. It was of between 0.5 and 1 g for the samples of 2 and 6 mm, which consisted in several particles that could be considered as isolated on the holder.
Note that the samples were oven-dried before being placed in the sample holder in order to avoid any moisture evaporation during the N2 purging stage
before the experiment.
The main parameters studied in the HTR are listed in Table 4.
Table 4. Main parameters studied in the HTR
Parameters Values
Particle size (mm) 0.8, 2 and 6
Temperature (°C) 800 and 950
Gas residence time (s) 1, 4 and 11 at 800°C
1, 3, and 10 at 950°C
2.2.3. Measurement
2.2.3.1.
Analysis methods
The same gas analysis system was used for all the experiments. Note that to test the influence of the sampling method (direct sampling or sampling bag), Couhert (2007) carried out in the DTR a pyrolysis test during which she measured the gas yields by direct online measurement of the sampled gas and by analyzing a sampling bag after the pyrolysis test. The results were similar, which proved that the sampling method did not affect the results.
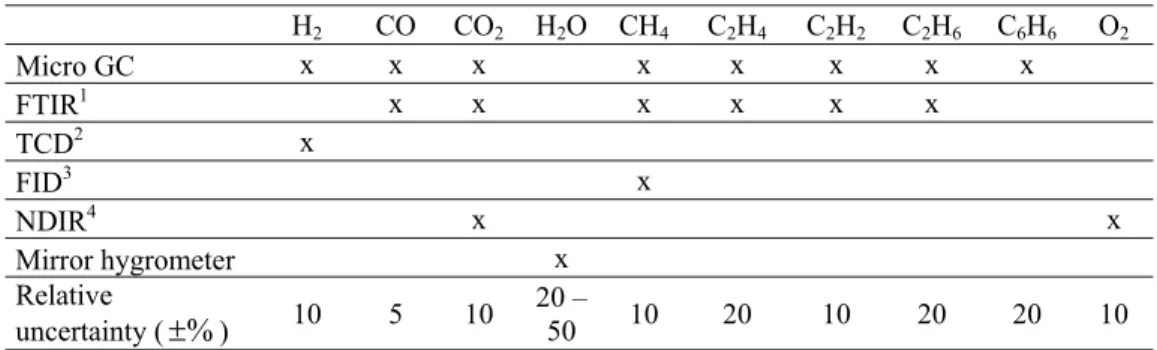
The gas analysis system is constituted of several analyzers, as shown in Table 5. The yields of all the main gaseous components except water vapour were measured by at least two different analyzers. Note that there is a high uncertainty on the H2O value given by the mirror hygrometer due to the fact that the mirror
surface might be contaminated by the condensed components in the released gas. Hence, the yield of water vapour may only be considered as indicative. Its uncertainty is not negligible and may represent up to 6% as mass fraction in the total produced gas.
Table 5. Gas analysis system
H2 CO CO2 H2O CH4 C2H4 C2H2 C2H6 C6H6 O2 Micro GC x x x x x x x x FTIR1 x x x x x x TCD2 x FID3 x NDIR4 x x Mirror hygrometer x Relative uncertainty (±%) 10 5 10 20 – 50 10 20 10 20 20 10
1. Fourier Transform InfraRed spectrometer 2. Thermal Conductivity Detector
3. Flame Ionization Detector
4. Non-Dispersive InfraRed spectrometer
The methods for determining the solid mass loss were different for the experiments in the DTR and those in the HTR.
• the mass loss of solid pyrolyzed in the DTR was determined by the ash tracer method, the most common method used to determine the solid mass loss in the DTR (for example, see (Zanzi, Sjöström et al. 1996; Li, Xu et al. 2004; Xiu, Li et al. 2006)).
• the mass loss of solid pyrolyzed in the HTR was determined by directly weighing the sample before and after pyrolysis test.
Due to the lack of direct measurement, the tar yield was considered as equal to the difference between the virgin wood and the sum of the yields of gas and solid residue. Under the explored conditions, the tar yield may represent up to 10 – 15 wt.% of the initial wood at the end of pyrolysis, as explained in (Dupont 2006).
2.2.3.2.
Repeatability
The result repeatability was checked by performing the same test on three different days.
• For the yields of gaseous components, it was found that for the experiments conducted in both reactors, the relative differences of results on each gaseous
component among these three tests was below 5% except for H2O in which
case it was of about 20%. This indicates that the experimental results were reliable.
• For the yields of solid, it was found that for the experiments conducted in the DTR, the relative differences of solid mass losses obtained among these three tests were up to 20%. This was mainly due to the small ash content in the virgin wood (about 0.3 wt.%). On the contrary, for the experiments in HTR, the relative differences of solid mass losses obtained among three tests were less than 5%. This indicates that the solid mass loss in the HTR was accurately determined.
3.
Results and discussion
3.1. Results obtained in the DTR
3.1.1. Final products distribution
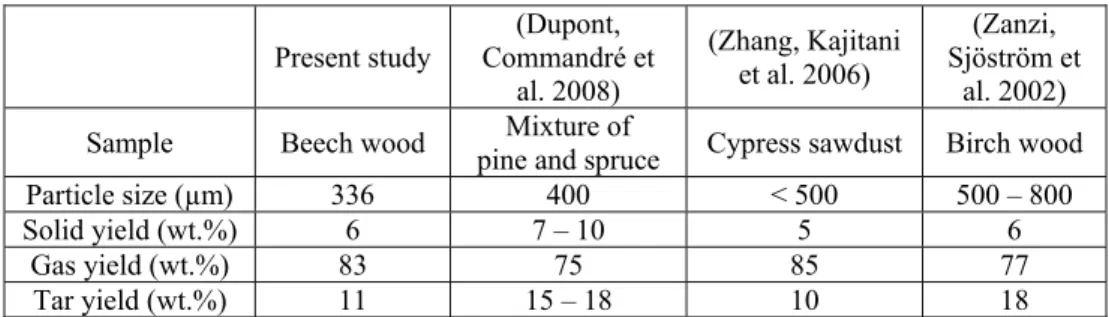
This paragraph aims to compare the results obtained in the present study with those reported by the former authors concerning the experiments conducted under similar operating conditions. Since only for the sample of 350 µm, the pyrolysis is finished under all the studied operating conditions (see Figure 3), the results of the sample of 350 µm are used to compare with literature results.
First of all, the comparison of final solid/gas/tar yields at 800°C is presented in Table 6.
Table 6. Comparison of final solid/gas/tar yields at 800°C with literature results
Present study Commandré et (Dupont,
al. 2008) (Zhang, Kajitani et al. 2006) (Zanzi, Sjöström et al. 2002)
Sample Beech wood pine and spruce Mixture of Cypress sawdust Birch wood
Particle size (µm) 336 400 < 500 500 – 800
Solid yield (wt.%) 6 7 – 10 5 6
Gas yield (wt.%) 83 75 85 77
Tar yield (wt.%) 11 15 – 18 10 18
It can be seen that the results obtained in the present study are quite similar with these previous results on the final yields of solid residue, total gas and tar. The small differences, in particular on the yields of gas and tar may result from the
measurement uncertainty, the differences of biomass feedstock and of the reactor configuration.
Secondly, in the gas phase, it is found that CO is the main gaseous product (50 wt.% of virgin biomass), followed by H2 (the molar ratio of H2/CO is between
0.35 and 0.55), H2O, CO2 and CH4. Species C2H2, C2H4, C2H6 and C6H6 are
present in much lower amounts. These results are in accordance with those observed by several earlier researchers working under similar operating conditions (Wei, Xu et al. 2006; Dupont, Commandré et al. 2008; Couhert, Commandré et al. 2009).
3.1.2. Influence of the particle size
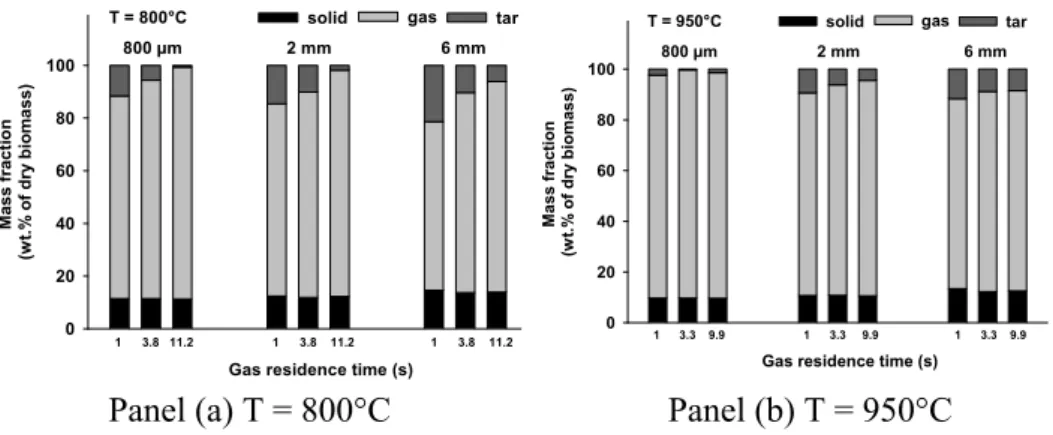
The mass yields of solid residue, total gas, and tar corresponding to four reaction zone lengths at two temperatures are illustrated in Figure 3.
Ma ss fr ac ti on (w t. % o f d ry b io m a ss ) 0 20 40 60 80 100 T = 800°C 800 µm 2 mm 6 mm 1 3.8 11.2
Gas residence time (s)
1 3.8 11.2 1 3.8 11.2 gas tar solid Mas s fr ac ti o n (w t.% of dry biom as s) 0 20 40 60 80 100 T = 950°C 800 µm 2 mm 6 mm 1 3.3 9.9
Gas residence time (s)
1 3.3 9.9 1 3.3 9.9
gas tar solid
Panel (a) T = 800°C Panel (b) T = 950°C
Figure 3. Mass yield of total gas, solid residue and tar (by diff.) in the DTR Three different pyrolysis progress levels can be observed at 800°C (Figure 3 (a)) for the different particle sizes:
• For the sample of 350 µm, the yields of solid residue, total gas, and tar almost remain constant. This indicates that the pyrolysis is already finished after a reaction zone length of 0.3 m.
• For the sample of 500 µm, the yield of solid residue slightly decreases from 10 to 6 wt.% when the reaction zone length increases from 0.3 to 0.9 m. Meanwhile, the yield of total gas significantly increases from 63 to 83 wt.%, and the yield of tar significantly decreases from 27 to 11 wt.%. This indicates that the wood devolatilization is almost finished at a reaction zone length of 0.3 m, while the cracking reactions of the primary tar produced by wood
devolatilization are still in progress with the increase of the reaction zone length from 0.3 to 0.9 m.
• For the samples of 700 and 800 µm, the yields of solid residue significantly decrease from 36 to 10 wt.% and from 50 to 21 wt.% respectively. The yields of total gas significantly increase from 42 to 71 wt.% and from 37 to 59 wt.% respectively. This indicates that in this case the wood devolatilization is still in progress in reaction zone lengths from 0.3 to 0.9 m.
From these observations, it appears that the increase of particle size under the explored range (350 – 800 µm) significantly decreases the apparent pyrolysis rate and therefore increases the required time for completing pyrolysis reactions.
Secondly, the influence of the particle size on the final products distribution at the end of pyrolysis can be analyzed. This analysis is performed on the results obtained at 950°C and at a reaction zone length of 0.9 m because under these conditions, the pyrolysis can be considered as finished for all the samples. From Figure 3 (b), it can be seen that with the increase of the particle size from 350 to 800 µm, the total solid yield slightly increases from 4 to 8 wt.% and the total gas yield slightly decreases from 85 to 79 wt.%. Taking into account the experimental uncertainty, it seems that under the explored conditions, the particle size has no significant influence on the final yields of solid and gas.
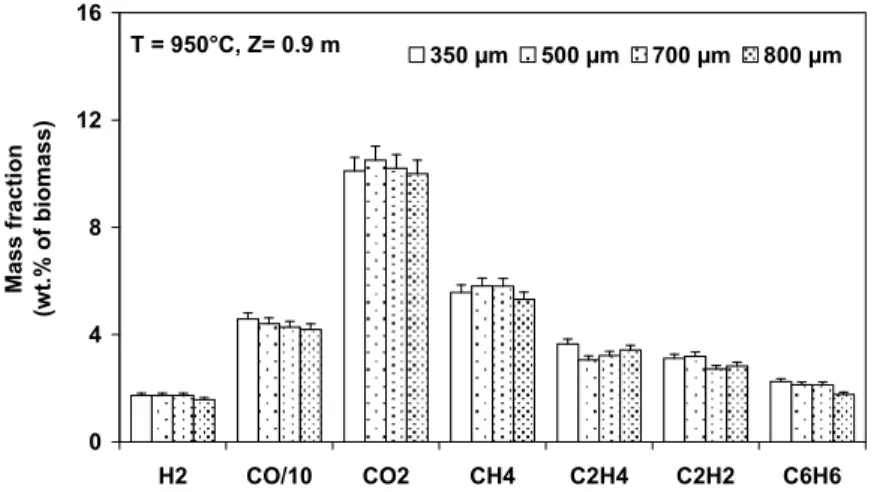
It is also interesting to see whether the particle size affects the final yields of the main gaseous component (Figure 4).
T = 950°C, Z= 0.9 m 0 4 8 12 16 H2 CO/10 CO2 CH4 C2H4 C2H2 C6H6 Ma ss fr actio n (w t. % of bi om as s ) 350 µm 500 µm 700 µm 800 µm
Figure 4. Yields of the main gaseous components in the DTR (T = 950°C) These results plotted in Figure 4 reveal that the particle size does not have significant influence on the yields of gaseous components.
To sum up, the above results seem to indicate that under the explored conditions in the DTR, the increase of initial particle size from 350 to 800 µm
mainly increases the required time for completing pyrolysis, but do not significantly shift the final products distribution. Several former studies (Chan, Kelbon et al. 1985; Di Blasi 1996) concerning the influence of particle size in a higher range (> 10 mm) showed that a larger particle size gives a higher solid yield and a low gas yield due to the fact that under the same external heat flux conditions, the change of particle size changes the temperature-history inside the particle and therefore changes the products distribution. However, in the present study, the influence of the particle size on the final products distribution is not significant, which implies that under the explored conditions, the effect of the heat transfer processes could not be effective.
3.1.3. Influence of the reactor temperature
From the comparison between Figure 3 (a) and (b), it can be seen on the samples of 700 and 800 µm that the increase of temperature from 800 to 950°C logically increases the pyrolysis rate. On the contrary, it can be seen on the sample of 350 µm that the increase of temperature from 800 to 950°C has very little influence on the final solid/gas/tar yields.
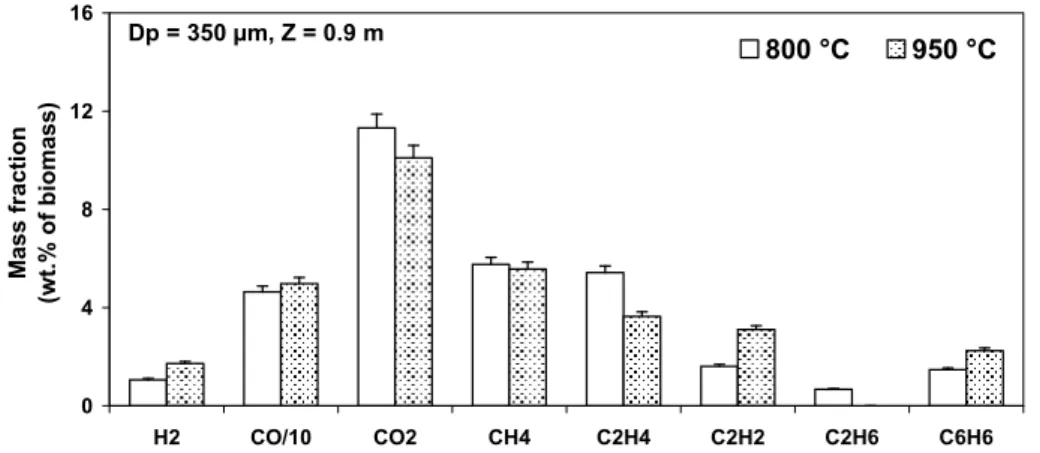
One can furthermore investigate the influence of temperature on the final yields of the main gaseous components. Since it has been shown in the previous section that the for the sample of 350 µm the pyrolysis is finished at all the studied operating conditions, the results on the sample of 350 µm at 800 and 950°C are taken for the comparison (Figure 5).
Dp = 350 µm, Z = 0.9 m 0 4 8 12 16 H2 CO/10 CO2 CH4 C2H4 C2H2 C2H6 C6H6 Mass fr acti o n (w t. % o f b io m as s) 800 °C 950 °C
Figure 5. Influence of the temperature on the final yields of gaseous components at the end of pyrolysis in the DTR
It can be observed that with the increase of temperature from 800 to 950°C, the yield of H2 increases significantly (from 1% to 1.7 wt.% of virgin wood),
accompanied with the increase of C2H2 and C6H6 and the decrease of C2H4 and
C2H6. Note that this trend is similar with what was observed in earlier studies
(Ekstrom and Rensfelt 1980; Nunn, Howard et al. 1985; Zanzi 2001). From this observation, it may be asserted that the increase of H2 and C2H2 mainly comes
from the cracking reactions of C2H4, C2H6, and tar components in the gas phase.
This implies that under the explored conditions in the present study, the distribution of the main gaseous components at the end of pyrolysis is influenced by the gas phase reactions rather than the initial particle size.
3.2. Results of experiments in HTR
3.2.1. Influence of the particle size
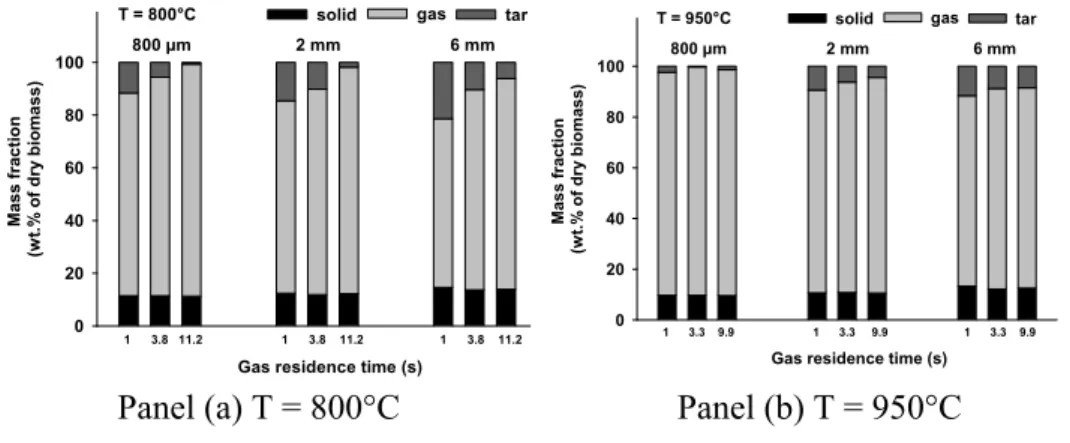
Figure 3 reports the evolution of the yields of solid residue, total released gas, and tar versus the gas residence time for particles of different sizes at 800 and 950°C. It should be kept in mind that due to the long solid residence time (3 minutes), the solid devolatilization process is finished in all cases.
Ma ss fr ac ti on (w t. % o f d ry b io m a ss ) 0 20 40 60 80 100 T = 800°C 800 µm 2 mm 6 mm 1 3.8 11.2
Gas residence time (s)
1 3.8 11.2 1 3.8 11.2 gas tar solid Ma s s fr ac ti o n (w t. % o f d ry b io m ass ) 0 20 40 60 80 100 T = 950°C 800 µm 2 mm 6 mm 1 3.3 9.9
Gas residence time (s)
1 3.3 9.9 1 3.3 9.9
gas tar solid
Panel (a) T = 800°C Panel (b) T = 950°C
Figure 6. Mass yield of total gas, solid residue and tar (by diff.) in the HTR It can be observed that whatever the temperature and gas residence time, the increase of particle size from 800 µm to 6 mm always increases the solid yield of about 2 – 3 wt.% of the initial dry wood and decreases the total gas yield of about 10%. Since the solid yield is accurately measured, this indicates that under the explored conditions in the HTR, the increase of particle size increases the solid yield.
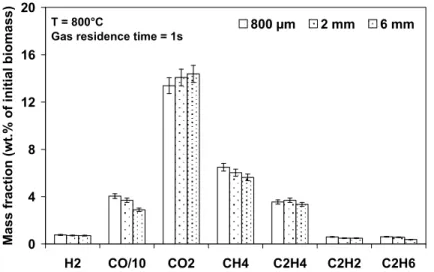
In Figure 7, the influence of particle size on the final yields of the main gaseous components at 800°C is examined.
T = 800°C
Gas residence time = 1s
0 4 8 12 16 20 H2 CO/10 CO2 CH4 C2H4 C2H2 C2H6 Ma ss fract ion (wt.% of initial biomass ) 800 µm 2 mm 6 mm
Figure 7. Influence of particle size on the final yield of the main gaseous components
From this figure, it can be seen that the decrease of the total gas yield with the increase of the particle size is mainly due to the decrease of the CO yield. Note that the same impact of particle size has also been observed at 950°C.
3.2.2. Influence of the gas residence time
The influence of the gas residence time on the solid/total gas/tar yields can be deduced from the results shown in Figure 3. First of all, it can be observed that the increase of the gas residence time does not influence the yield of solid residue. This means that wood devolatilization behaviour is not influenced by the change of the gas velocity at the solid surface and therefore the change of mass/heat transfer conditions at solid surface. Secondly, it can be observed that at 800°C, for all the samples, the increase of the gas residence time from 1 to 11 s increases the total gas yield by about 10-15 wt.% (of dry wood). A similar evolution was observed by Zhang et al. (2007) using the same type of reactor. This trend may be due to fact that longer gas residence time favours the cracking reactions of tar components and other light hydrocarbons. Finally, it can be observed that at 950°C, the increase of the gas residence time has almost no influence on the total gas yield for all the samples. This may be explained by the fact that at higher
temperature, the rate of the cracking reactions increase and that as a consequence, the cracking reactions are almost finished in 1 s at 950°C.
One can furthermore investigate the influence of the gas residence time on the yields of the main gaseous components. In fact, the influence of the gas residence time has been found to be the same for all the samples used in this study, hence only the results for the sample of 6 mm are given as an example (Figure 8).
H2 CO/1 0 CO2 CH4 C2H4 C2H2 C2H6 Ma ss f ra c ti o n (w t.% of dr y bio m a ss ) 0 5 10 15 20 T = 800°C Dp = 6 mm
Gas residence time = Gas residence time = Gas residence time =
H2 CO/1 0 CO2 CH4 C2H4 C2H2 C2H6 Ma ss f ra c ti o n (w t.% of dr y bio m a ss ) 0 5 10 15 20 T = 800°C Dp = 6 mm
Gas residence time = Gas residence time = Gas residence time = Gas residence time = 1.1 s Gas residence time = 3.8 s Gas residence time = 11.2 s
H2 CO/ 10 CO2 CH4 C2H4 C2H2 C2H6 Ma ss fr ac ti o n (w t.% of dry biomass ) 0 5 10 15 20 T = 950°C Dp = 6 mm
Gas residence time Gas residence time Gas residence time Gas residence time = 1 s Gas residence time = 3.3 s Gas residence time = 9.9 s
H2 CO/ 10 CO2 CH4 C2H4 C2H2 C2H6 Ma ss fr ac ti o n (w t.% of dry biomass ) 0 5 10 15 20 T = 950°C Dp = 6 mm
Gas residence time Gas residence time Gas residence time Gas residence time = 1 s Gas residence time = 3.3 s Gas residence time = 9.9 s
Panel (a) T = 800°C Panel (b) T = 950°C
Figure 8. Influence of the gas residence time on the yields of the main gaseous components
It can be observed that the increase of gas residence time has a significant influence on the yields of the main gaseous components: the yields of H2, CO and
CH4 increase at the two temperatures; the yields of C2H2 and C2H4 increase at
800°C but decrease at 950°C; a small amount of C2H6 is found at 800°C while no
C2H6 is detected at 950°C. These trends suggest that the gas phase reactions are
still under progress under these conditions: the increase of the gas residence time favours mainly the tar cracking reactions at 800°C to increase the production of light hydrocarbons, while at 950°C it favours the not only the cracking reactions of tar components, but also those of light hydrocarbons.
3.2.3. Comparisons between results obtained in the DTR and in the HTR
Since the sample of 800 µm has been used for the experiments in the DTR and in the HTR, a direct comparison of the two reactors is possible. The experiments were carried out at the same temperature (950°C) and for the same gas residence time (about 4 s, corresponding to a reaction zone length of 0.9 m in the DTR). It is worth noticing that due to the different reactor configurations, there are two main differences between the experiments:
• In the DTR the particles could be thought as isolated and in motion, while in the HTR the particles are in contact with each other and also in contact with the sample holder. Thus, the external heat transfer conditions at particle surface in two reactors are different.
• In the DTR the solid is always in contact with the released gaseous components, while in the HTR the released gaseous components are rapidly drawn away from the particle surface.
The comparison of the yields of the main gaseous components is listed in Table 7.
Table 7. Comparison between the yields of the main gaseous components in the DTR and in the HTR
Operating condition Gas residence time = 4 s T=950°C
Mass yield (wt. % of dry biomass) DTR HTR
H2 1.7 1.4 CO 48.4 45.5 CO2 10.1 14.8 CH4 5.7 9.1 C2H4 3.7 2.7 C2H2 3.1 1.0 C2H6 0.4 0.0 Total gas 73 75
Globally speaking, despite the differences between the two reactors, the results on the yields of the main gaseous components obtained in these two reactors are very close. When having a more detailed look at the results, it can be noticed that the yields of CO2 and CH4 are found to be higher in the HTR than in the DTR, while
for the others, the yields in the DTR are a little higher than in the HTR. However, these differences remain minor. This indicates that the differences of reactor configuration and heating conditions between DTR and HTR do not play an important role in the production of the main gaseous components. Consequently, it seems reasonable to use these two reactors conjointly to study the influence of the particle size on the sample pyrolysis behaviour.
4.
Conclusions
The pyrolysis behaviour of beech wood particles between 350 µm and 6 mm was investigated under representative conditions of fluidized bed gasifiers, i.e. atmospheric pressure, high external heat flux (105 –106 W.m-2) and high temperatures (800 and 950°C). A drop tube reactor (DTR) was used to study the pyrolysis of particles between 350 and 800 µm, and a horizontal tubular reactor (HTR) was used to complete the study with larger particles (800 µm – 6mm) and to study the influence of the gas residence time (1 to 10 s).
Generally speaking, under the operating conditions studied in the present work, at the end of pyrolysis, more than 80 wt.% of virgin wood is converted into gas and less than 13 wt.% remains in solid. In the gas phase, CO is the main gaseous product (50 wt.% of virgin wood), followed by H2 (the molar ratio of
H2/CO is between 0.35 to 0.55), H2O, CO2 and CH4. Species C2H2, C2H4, C2H6
and C6H6 are present in much lower amounts, which is found in accordance with
previous experimental results in similar conditions.
Under the explored conditions in the present study, the increase of the particle size significantly increases the required time for pyrolysis. However, the particle size has only a limited influence on the final products distribution of pyrolysis. Indeed, the increase of particle size from 350 to 800 µm does not significantly affect the products yields at the end of pyrolysis while a little influence can be seen with the increase of the particle size from 800 µm to 6 mm, i.e. increasing the yield of solid residue by about 3 wt.% (of dry wood) and decreasing the yield of total gas by about 10 wt.% (mainly CO yield).
The increase of temperature from 800 to 950°C logically increases the apparent pyrolysis rate. Moreover, the change of temperature changes the yields of the main gaseous components, i.e. higher temperature favours the cracking reactions and increasing significantly the yield of H2.
Finally, it has been shown that the final yields of the main gaseous components obtained under similar conditions in the two different reactors are very close. Thus the potential differences between the two reactors do not significantly affect the results. This confirms that it is reasonable to use them conjointly in the study.
References
Bellais, M. (2007). Modelling of the pyrolysis of large wood particles, Royal Institute of Technology. Ph.D Thesis.
Biagini, E., C. Fantozzi, et al. (2004). "Characterization of devolatilization of secondary fuels in different conditions." Combustion Science and Technology
176: 685-703.
Brink, D. L. and M. S. Massoudi (1978). "A Flow Reactor Technique for the Study of Wood pyrolysis.I. Experimental." Journal of Fire&Flammability 9: 176-188.
Chan, W. C. R., M. Kelbon, et al. (1985). "Modelling and experimental verification of physical and chemical processes during pyrolysis of a large biomass particle." Fuel 64: 1505-1513.
Chen, L., C. Couhert, et al. (2009). "Char/gas/tar yields and slip velocity of millimetric wood particles during high temperature fast pyrolysis - Part 2: Modelling study." In preparation.
Commandré, J.-M. (2002). Formation des oxydes d'azote lors de la combustion de cokes de pétrole dans des conditions de précalcinateur de cimenterie, Ecole des Mines d'Albi-Carmaux. Ph.D Thesis.
Couhert, C. (2007). Pyrolyse Flash à Haute Température de la Biomasse Ligno-Cellulosique et de Ses Composés-Production de Gaz de Synthèse, Ecole des Mines de Paris. Ph.D Thesis.
Couhert, C., J.-M. Commandré, et al. (2009). "Is it possible to predict gas yields of any biomass after rapid pyrolysis at high temperature from its composition in cellulose, hemicellulose and lignin?" Fuel 88(3): 408-417.
Damköhler, G. (1936). "Einflüsse der Strömung, Diffusion und des Wärmeüberganges auf die Leistung von Reaktionsöffen." Z.Elektrochem. 42: 846. Di Blasi, C. (1996). "Kinetic and Heat Transfer Control in the Slow and Flash Pyrolysis of Solids." Ind. Eng. Chem. Res. 35: 37-46.
Dufour, A. (2007). Optimisation de la Production d'Hydrogène par Conversion du Méthane dans les Procédés de Pyrolyse/Gazéification de la Biomasse. Nancy, Institut National Polytechnique de Lorraine. Ph. D Thesis.
Dupont, C. (2006). Vapogazéification de la Biomasse: Contribution à l'Etude de la Phénoménologie entre 800 et 1000°C, Université Claude Bernard -- Lyon 1. Ph.D
Thesis.
Dupont, C., G. Boissonnet, et al. (2007). "Study on the Kinetic Processes of Biomass Steam Gasification." Fuel 86(1-2): 32-40.
Dupont, C., J.-M. Commandré, et al. (2008). "Biomass pyrolysis experiments in an analytical entrained flow reactor between 1073 K and 1273 K." Fuel 87(7): 1155-1164.
Ekstrom, C. and E. Rensfelt (1980). Flash Pyrolysis of Biomass in Sweden. Specialists' Workshop on Fast Pyrolysis of Biomass., Copper Mountain Co. Gronli, M. G. (1996). A theoretical and experimental study of the thermal degradation of biomass, The Norwegian University of Science and Technology.
Ph.D Thesis.
Lehto, J. (2007). "Determination of Kinetic Parameters for Finnish Milled Peat Using Drop Tube Reactor and Optical Measurement Techniques." Fuel 86: 1656-1663.
Li, S., S. Xu, et al. (2004). "Fast Pyrolysis of Biomass in a Free-Fall Reactor for Hydrogen-Rich Gas." Fuel Processing technology 85: 1201-1211.
Lu, H. (2006). Experimental and Modeling Investigations of Biomass Particle Combustion, Brigham Young University. Ph.D Thesis.
Nunn, T. R., J. B. Howard, et al. (1985). "Product Compositions and Kinetics in the Rapid Pyrolysis of Sweet Gum Hardwood." Industrial & Engineering Chemistry Process Design and Development 24(3): 836-844.
Peters, B. and C. Bruch (2003). "Drying and Pyrolysis of Wood Particles: Experiments and Simulation." Journal of Analytical and Applied Pyrolysis 70: 1-18.
Pyle, D. L. and C. A. Zaror (1984). "Heat Transfer and Kinetics in the Low Temperature Pyrolysis of Solids." Chemical Engineering Science 39(1): 147-158. Simmons, G. M., M. Gentry (1986). "Particle Size Limitations due to Heat Transfer in Determining Pyrolysis Kinetic of Biomass." Journal of Analytical and Applied Pyrolysis 10: 117-127.
Van de Steene, L. (1999). Thermochimie de la Combustion à Basses Températures de Solides Pulvérisés : Application à un Charbon, Institut National Polytechnique de Toulouse. Ph.D Thesis.
Wei, L. G., S. P. Xu, et al. (2006). "Characteristics of Fast Pyrolysis of Biomass in a Free Fall Reactor." Fuel Processing Technology 87: 863-871.
Xiu, S. N., Z. H. Li, et al. (2006). "Devolatilization Characteristics of Biomass at Flash Heating Rate." Fuel 85: 664-670.
Zanzi, R. (2001). Pyrolysis of biomass: Rapid Pyrolysis at High Temperature; Slow Pyrolysis for Active Carbon Preparation, Royal Institute of Technology.
Ph.D Thesis.
Zanzi, R., K. Sjöström, et al. (1996). "Rapid high-temperature pyrolysis of biomass in a free-fall reactor." Fuel 75(5): 545-550.
Zanzi, R., K. Sjöström, et al. (2002). "Rapid pyrolysis of agricultural residues at high temperature." Biomass and Bioenergy 23(5): 357-366.
Zanzi, R., K. Sjostrom, et al. (1996). "Rapid High-Temperature Pyrolysis of Biomass in a Free-Fall Reactor." Fuel 75: 545-550.
Zhang, J. L., H. Toghiani, et al. (2007). "Product Analysis and Thermodynamic Simulations from the Pyrolysis of Several Biomass Feedstocks." Energy & Fuel
21: 2373-2385.
Zhang, Y., S. Kajitani, et al. (2006). "Peculiarities of rapid pyrolysis of biomass covering medium- and high-temperature ranges." Energy & Fuels 20(6): 2705-2712.
Zhang, Y., S. Kajitani, et al. (2006). "Peculiarities of Rapid Pyrolysis of Biomass Covering Medium- and High-Temperature Ranges." Energy & Fuels 20: 2705--2712.