HAL Id: hal-01986010
https://hal.archives-ouvertes.fr/hal-01986010
Submitted on 18 Jan 2019HAL is a multi-disciplinary open access
archive for the deposit and dissemination of sci-entific research documents, whether they are pub-lished or not. The documents may come from teaching and research institutions in France or abroad, or from public or private research centers.
L’archive ouverte pluridisciplinaire HAL, est destinée au dépôt et à la diffusion de documents scientifiques de niveau recherche, publiés ou non, émanant des établissements d’enseignement et de recherche français ou étrangers, des laboratoires publics ou privés.
NMR Study of Ion Dynamics and Charge Storage in
Ionic Liquid Supercapacitors
Alexander Forse, John Griffin, Céline Merlet, Paul Bayley, Hao Wang, Patrice
Simon, Clare Grey
To cite this version:
Alexander Forse, John Griffin, Céline Merlet, Paul Bayley, Hao Wang, et al.. NMR Study of Ion Dynamics and Charge Storage in Ionic Liquid Supercapacitors. Journal of the American Chemical Society, American Chemical Society, 2015, 137 (22), pp.7231-7242. �10.1021/jacs.5b03958�. �hal-01986010�
NMR Study of Ion Dynamics and Charge Storage in Ionic Liquid
Supercapacitors
Alexander C. Forse,
†John M. Griffin,
†Ce
́line Merlet,
†Paul M. Bayley,
†Hao Wang,
†Patrice Simon,
§,∥and Clare P. Grey*
,†,‡†Department of Chemistry, University of Cambridge, Lensfield Road, Cambridge CB2 1EW, United Kingdom ‡Department of Chemistry, Stony Brook University, Stony Brook, New York 11794-3400, United States §Université Paul Sabatier Toulouse III, CIRIMAT, UMR-CNRS 5085, F-31062 Toulouse, France
∥Réseau sur le Stockage Electrochimique de l’Energie (RS2E), FR CNRS 3459, 80039 Amiens Cedex, France
*
S Supporting InformationABSTRACT: Ionic liquids are emerging as promising new electrolytes for supercapacitors. While their higher operating voltages allow the storage of more energy than organic electrolytes, they cannot currently compete in terms of power performance. More fundamental studies of the mechanism and dynamics of charge storage are required to facilitate the development and application of these materials. Here we demonstrate the application of nuclear magnetic resonance spectroscopy to study the structure and dynamics of ionic liquids confined in porous carbon electrodes. The measurements reveal that ionic liquids spontaneously wet the carbon micropores in the absence of any applied potential and that on application of a potential supercapacitor charging takes place by
adsorption of counterions and desorption of co-ions from the pores. We find that adsorption and desorption of anions surprisingly plays a more dominant role than that of the cations. Having elucidated the charging mechanism, we go on to study the factors that affect the rate of ionic diffusion in the carbon micropores in an effort to understand supercapacitor charging dynamics. We show that the line shape of the resonance arising from adsorbed ions is a sensitive probe of their effective diffusion rate, which is found to depend on the ionic liquid studied, as well as the presence of any solvent additives. Taken as whole, our NMR measurements allow us to rationalize the power performances of different electrolytes in supercapacitors.
■
INTRODUCTIONSupercapacitors store charge by the formation of electric double layers in porous carbon electrodes.1 The energy stored is proportional to the cell capacitance as well as the square of the operating voltage. As such, great effort has been made to develop new carbon structures with increased capacitances, as well as new electrolytes with higher maximum operating voltages.2Activated carbons prepared from organic precursors such as coconut shells and wood are used commercially, as they have good electronic conductivities and large gravimetric surface areas and are relatively cheap. Fine tuning of the carbon micropore size, relative to the electrolyte ion size, has been shown to be an effective strategy to increase capacitance.3−5 Meanwhile, room-temperature ionic liquids have emerged as alternatives to organic electrolytes to extend the maximum operating voltage of devices.6,7While they have a number of attractive properties including low vapor pressure, nonflammability, and good chemical and thermal stabilities, they suffer from low ionic conductivities and high viscosities, which are detrimental to the power performance of devices.8 Despite a number of promising studies utilizing ionic liquids in
supercapacitors,5,9−12 their power performances still cannot compete with those of organic electrolytes.
Theoretical studies have led the way in developing our understanding of the structure and dynamics of the interface between carbon surfaces and ionic liquids.13,14 It is now well established that ions form a multilayer structure at charged planar electrodes, with thefirst layer of ions overscreening the charge of the electrode surface.15−18 Such findings are corroborated experimentally by atomic force microscopy studies of ionic liquids at graphitic surfaces at different charge states19−21 and surface force balance studies of ionic liquids confined between mica sheets.22−24 In microporous carbons, there is insufficient space for the accumulation of multiple layers of ions at the electrode−electrolyte interface. Molecular dynamics simulations then suggest that charging occurs via exchange of anions and cations between the carbon pores and the bulk.25−27 Recent theoretical studies of the charging dynamics of slit-shaped pores have highlighted the importance of pore ionophobicity/ionophilicity.28−31 Ionophilic pores are
Received: April 16, 2015
Published: May 14, 2015
wetted by the ionic liquid in the absence of an applied potential, whereas ionophobic pores are not. Ionophobic pores were shown to exhibit faster charging dynamics than ionophilic pores, avoiding the initial overfilling of the latter with ions during charging.29 New experimental methods must be developed to probe the wetting of carbon micropores by ionic liquids, to study ion dynamics inside the pores, and to test the various theoretical models for the charging mechanism.
Nuclear magnetic resonance (NMR) spectroscopy is a particularly attractive technique to study the adsorption of ions in porous carbons. It is element selective, allowing the selective observation of anions and cations, and can probe species confined in porous materials. Ions adsorbed to carbon surfaces give rise to spectral features that are distinct from those of nonadsorbed ions in bulk electrolyte.32−36In the presence of a magneticfield, circulation of the delocalized π electrons in the sp2-hybridized carbon result in ring-current effects,37 shifting the feature arising from adsorbed ions to lower frequencies (to the right-hand side of the NMR spectrum) by an amount which depends on the degree of graphitization and the pore size of the carbon.38−40 Density functional theory (DFT) calculations of nucleus-independent chemical shifts (NICSs) nearby various sp2-hybridized carbon structures have offered insights into the experimentally observed spectra and suggest that the shifts observed for adsorbed species depend primarily on the structure of the carbon adsorbent.38,41−44 NMR experiments on typical activated carbons soaked with organic electrolytes have shown that the carbon micropores are wetted in the absence of an applied potential, i.e., they may be considered as ionophilic.38,39,45,46Both in situ47,48and ex situ49NMR studies of supercapacitors with organic electrolytes have shown that the populations of anions and cations inside the carbon micropores change when a voltage is applied and that the exact charge storage mechanism is sensitive to the electrolytes used and their concentration.48 Charging can be driven by ion adsorption (that is, adsorption of counterions into carbon pores), ion desorption (desorption of co-ions from carbon pores), or simultaneous adsorption of counterions and desorption of co-ions (referred to here as ion exchange).48In principle, there is a whole spectrum of different possible charging mechanisms with varying amounts of ion adsorption, desorption, and exchange.
Here we extend the NMR approach to study the structure and dynamics of ionic liquids confined in porous carbon. NMR spectra of carbon soaked with 1-methyl-1-propylpyrrolidinium bis(trifluoromethanesulfonyl)imide (Pyr13TFSI) and 1-ethyl-3-methylimidazolium bis(trifluoromethanesulfonyl)imide (EMITFSI) ionic liquids show that the anions and cations wet the carbon micropores in the absence of an applied potential. We then show that supercapacitor charging occurs via adsorption of counterions and desorption of co-ions, with adsorption and desorption of the anions playing a more dominant role than that of the cations. Armed with this information, we go on to study the factors that affect the rate of ionic motion in the carbon pores in a bid to understand supercapacitor charging dynamics. We show that the line width of the resonance arising from adsorbed ions is sensitive to the rate at which they diffuse through the carbon pores and find that adsorbed TFSI−has faster ionic diffusion in EMITFSI than in Pyr13TFSI ionic liquid, while addition of acetonitrile (the standard organic solvent used in supercapacitor electrolytes) greatly increases the rate of in-pore diffusion in both cases. Overall, our NMR measurements then allow us to rationalize
the charging dynamics that we measure for supercapacitors with different electrolytes.
■
EXPERIMENTAL SECTION1. Carbon Materials. Free-standing carbonfilms were prepared by mixing carbon powder (95 wt %) (YP50F activated carbon, Kuraray Chemical, Japan) with polytetrafluoroethylene binder (5 wt %) (Sigma-Aldrich, 60 wt % dispersion in water) in ethanol. The resulting slurry was kneaded and rolled to give a carbonfilm of approximately 0.25 mm thickness.
2. Ionic Liquids and Solvents. 1-Methyl-1-propylpyrrolidinium bis(trifluoromethanesulfonyl)imide (Pyr13TFSI) and
1-ethyl-3-meth-ylimidazolium bis(trifluoromethanesulfonyl)imide (EMITFSI) ionic liquids (both >98% purity, Toyko Chemical Industry UK), were dried in vacuo for at least 48 h before preparing samples. For NMR experiments with acetonitrile, deuterated acetonitrile, 2H3CCN
(99.80%, Eurisotop, referred to as dACN) was used.
3. NMR Sample Preparation for Carbons Soaked with Ionic Liquid. Pieces of carbonfilm (∼3 mg) were cut out and dried for at least 15 h at 200°C in vacuo before being transferred to an argon glovebox. These were packed into 2.5 mm outer diameter zirconia magic angle spinning (MAS) rotors, to which∼5 μL of ionic liquid was added using a microsyringe. Having allowed 10 min for the ionic liquid to soak into the carbon, any excess ionic liquid (external to the carbonfilm piece in the top of the rotor) was then carefully removed by inserting a small piece of tissue paper into the top of the rotor for 1 or 2 s before removing it. This was done because excess ionic liquid could cause rotor instability under MAS conditions in the NMR experiment. The masses of carbon and ionic liquid added to each sample were determined by weighing the rotor before and after their addition. For the sample containing an ionic liquid diluted with deuterated acetonitrile, a sample was first prepared as above. The volume of deuterated acetonitrile required to dilute the ionic liquid to 1.8 M was then calculated and added to the sample by microsyringe before quickly capping the rotor. Since some solvent may be lost to evaporation during syringing, the rotor was then reweighed to determine the actual amount of organic solvent added. The concentration of the resulting organic electrolyte was then determined from the volumes of ionic liquid and solvent in the sample.
4. NMR Experiments. NMR experiments were performed using Bruker Avance spectrometers operating at magneticfield strengths of 7.1 and 9.4 T, corresponding to1H Larmor frequencies of 300.2 and
400.4 MHz, respectively. Bruker 2.5 mm double-resonance MAS probes were used. All NMR experiments used simple pulse−acquire sequences with 5 kHz MAS. For 1H spectra, a probe background
spectrum was recorded and subtracted. 19F NMR spectra were
referenced relative to neat hexafluorobenzene (C6F6) at−164.9 ppm,
while1H NMR spectra were referenced relative to tetramethylsilane
using the CH3resonance of liquid ethanol at 1.2 ppm as a secondary
reference. 2H NMR spectra were referenced relative to2H 2O at 4.8
ppm. Radiofrequency strengths of between 98 and 122, between 96 and 105, and 78 kHz were used for19F,1H, and2H, respectively, with the exception of19F measurements at 9.4 T where the radiofrequency
strength used was 52 kHz. For variable-temperature NMR measure-ments, temperature calibrations were performed by 207Pb NMR
experiments on lead nitrate.50,51 Experiments on lead nitrate with different MAS speeds showed that the frictional heating effect at 5 kHz MAS is less than 1°C. Recycle delays ranged from 4 to 48 s for19F experiments and 3 to 12 s for1H experiments, and a delay of 24 s was used for2H experiments. Recycle delays were adjusted to ensure all
spectra are quantitative. Between 8 and 64 transients were coadded for each NMR experiment. Spectral deconvolutions were performed using dmfit software52and the SOLA package in Topspin software. A single peak was used tofit in-pore resonances, while either one or two peaks were used tofit each ex-pore resonance. For accurate determination of spectral intensities, spinning sidebands were taken into account using a chemical shift anisotropy model in the SOLA package in Topspin software. For ex situ NMR experiments, these intensities were then Journal of the American Chemical Society
normalized to account for electrode mass differences between different coin cells.
5. Preparation of Coin Cells. All supercapacitor cells were fabricated using coin cell designs. First, YP50F carbon films were prepared as described above. Disc-shaped electrodes were then cut and dried at 100°C in vacuum for at least 15 h. Symmetric coin cells were then fabricated inside an argon glovebox, with glassfiber (Whatman) used as the separator. Electrode masses ranged from 2.7 to 4.3 mg, with the two electrode masses in each cell equal within 0.1 mg.
6. Ex Situ NMR Experiments. First, coin cells were cycled by cyclic voltammetry for 5 cycles with a sweep rate of 5 mV·s−1between limits of 0 and 3 V. A constant applied voltage of 0 V was then applied to the cells for 1 h, before applying the desired cell voltage for at least a further hour. Voltages of 0.0, 0.5, 1.0, 1.5, 2.0, and 2.5 V were studied, with two individual cells studied for each voltage, giving a total number of 12 coin cells for this study. Having removed the cells from the cycler, they were quickly transferred to an argon glovebox (H2O < 0.1
ppm, O2< 0.1 ppm), where thefinal cell voltage was measured using a
multimeter before disassembling the cell. The time between the removal of coin cells from the cycler and cell disassembly was approximately 5 min. Only for the highest cell voltage of 2.5 V did we measure any significant self-discharge prior to disassembly. In this case, for both cells studied, the voltage had dropped to 2.48 V before disassembly. The positive and negative carbon electrodes were then individually packed into 2.5 mm outer diameter zirconia MAS rotors. 7. Measurements of Capacitance. Capacitances were measured using galvanostatic charge−discharge measurements in a two-electrode
configuration using a Bio-Logic cycler. For charging, a constant current, I, was applied until the cell voltage reached its maximum value (3 V for ionic liquids and 2 V for solvated ionic liquids). The current was then reversed to discharge the cell to a cell voltage of 0 V. Ten cycles were recorded for each different current value studied. The cell capacitance was then extracted by
=
C IV
t
cell d d
where dV/dt was determined as the gradient of the discharge curve.53 The capacitance was determined from the tenth discharge curve. Assuming the capacitance of the two electrodes to be equal, we then extracted the gravimetric capacitance, C/m, of a single electrode using
= C m C m 2 cell
where m is the mass of a single electrode. Current densities were calculated as I/m.
■
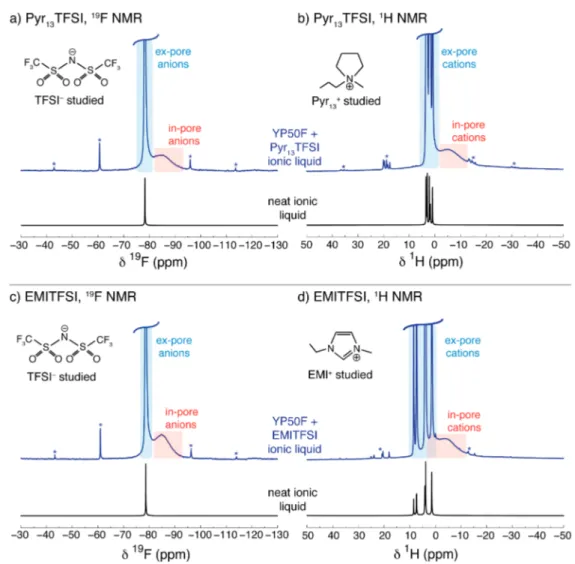
RESULTS AND DISCUSSION1. Wetting of Activated Carbon by Ionic Liquids. Figure 1a shows the 19F MAS NMR spectrum of a piece of
commercial activated carbon (YP50F) film soaked with Pyr13TFSI ionic liquid. Two spectral features are clearly visible for the TFSI anions, with the broad feature at −84.9 ppm
Figure 1.(a)19F and (b)1H MAS NMR (7.1 T) spectra of YP50F carbonfilm soaked with Pyr
13TFSI ionic liquid. (c and d) Analogous spectra are
shown with EMITFSI ionic liquid. Static spectra of the neat ionic liquids are displayed in each case for comparison. Asterisks mark spinning sidebands, which are observed for in- and ex-pore resonances, though the broad in-pore sidebands cannot be seen on this scale. For both ionic liquids, the anions and cations wet the carbon micropores in the absence of an applied potential, giving rise to in-pore features in the spectra. Journal of the American Chemical Society
assigned to adsorbed anions nearby carbon surfaces within the carbon micropores (referred to as in-pore) and the narrow feature at −78.3 ppm assigned to nonadsorbed anions occupying large reservoirs of ionic liquid between primary carbon particles (referred to as ex-pore).38−41 As discussed in the Introduction, the in-pore feature is shifted relative to the ex-pore due to the local magneticfield arising from the circulation of delocalizedπ electrons in the carbon. The ex-pore anions on the other hand are remote from carbon surfaces and therefore have a chemical shift that is essentially identical to the neat ionic liquid (−78.3 ppm). Both in- and ex-pore resonances are observed for Pyr13 cations in the 1H MAS NMR spectrum
(Figure 1b). The spectra are, however, complicated by the six chemically distinct1H environments in each Pyr13cation (from
the various CH2and CH3groups), which each give rise to in-and ex-pore resonances, with the different in-pore resonances not being resolved here. 19F and 1H MAS NMR spectra of YP50F soaked with a second ionic liquid, EMITFSI, show similar features (Figure 1c and 1d). In the19F spectrum, the separation of the in- and ex-pore resonances (6.3 ppm) is similar to that observed for Pyr13TFSI (6.6 ppm), suggesting
that the local magnetic environment of the in-pore TFSI anions is essentially identical for the two ionic liquids despite the presence of different cations. The observation of in-pore resonances for anions and cations confirms that both ionic liquids spontaneously wet the carbon micropores of this carbon, consistent with molecular dynamics simulations carried out on a model porous carbon.25 We note that we used a relatively slow sample spinning speed of 5 kHz, following the
approach of Deschamps et al.49This speed was chosen to limit frictional heating of the sample (estimated to be less than 1°C) and to prevent any centrifugation effects.36No changes in the relative intensity of the in- and ex-pore resonances were observed with time at this spinning speed.
On the basis offits of the19F and1H NMR spectra in Figure 1a and 1b, we calculate that there are 1.6 mmol of in-pore anions per gram of YP50F for Pyr13TFSI, with the same
number obtained for in-pore cations. Thus, there are equal numbers of anions and cations in the carbon micropores in the absence of an applied potential. Taking the volumes of TFSI− and Pyr13+to be 148 and 152 Å3, respectively (calculated using
the Molinspiration Property Calculation Service54), we calculate the volume of in-pore ionic liquid to be 0.28 cm3 per gram of carbon. Comparing this to the carbon pore volume measured by N2gas sorption (0.71 cm3·g−1),55only 40% of the
pore volume accessible to N2is occupied by ionic liquid. Similar analysis for EMITFSI shows that there are 1.8 mmol of in-pore anions per gram of carbon. Taking the volume of EMI+to be 118 Å3(and assuming an equal number of anions and cations in the pores) wefind that there are 0.29 cm3·g−1of in-pore ions, again occupying 40% of the carbon pore volume measured by N2 gas adsorption. While the carbon micropores are significantly wetted in the absence of an applied potential and may be considered ionophilic, a considerable amount of pore volume measured by N2gas sorption is inaccessible to the ionic
liquids studied here, presumably due to size and packing effects. Of note, this suggests that there is considerable scope to
Figure 2.(a)19F and (b)1H MAS NMR (7.1 T) spectra of electrodes extracted from disassembled supercapacitors (YP50F carbon and Pyr 13TFSI
ionic liquid) charged to a range of different cell voltages. In-pore resonances show noticeable increases in chemical shift as the voltage is increased. Journal of the American Chemical Society
optimize the carbon structure in terms of its total ionic liquid uptake.
2. Charge Storage Mechanism of Ionic Liquid-Based Supercapacitors. Preliminary static NMR measurements on charged electrodes yielded poor resolution when ionic liquids were used (see Supporting Information), preventing in situ47,48 quantification of the charging mechanism. Instead, we opted for an ex situ approach, where resolution is improved by magic angle spinning. We charged a series of supercapacitor cells comprising Pyr13TFSI ionic liquid to different voltages and
recorded 19F and 1H MAS NMR spectra on electrodes
collected from the disassembled cells (Figure 2). We note that, unlike typical organic electrolytes, ionic liquids have very low volatility,8meaning there is negligible evaporation of liquid during cell disassembly.
The 19F NMR spectra (Figure 2a) of the positive and negative electrodes at a cell voltage of 0 V are similar to that observed in Figure 1a, with the in-pore resonance at−84.9 ppm in each spectrum. As the cell voltage is increased, the in-pore resonance shifts to higher frequency in both electrodes, while the ex-pore resonance does not show any change in frequency. Changes in intensity of the in-pore resonance are also observed as the voltage is increased, though these are not immediately apparent by direct inspection of the spectra, which is in part due to changes in the intensity of the spinning sidebands, discussed below. For1H spectra of the same samples (Figure 2b) the in-pore resonances again shift to higher frequency as the cell voltage is increased. We note that despite the separation of the positive and negative electrodes upon cell disassembly, we did not observe any changes of the chemical shifts or intensities with time (see Supporting Information). This suggests that any self-discharge of the electrodes is insignificant following their separation. Indeed, this principle is utilized in electrochemicalflow capacitors.56
To obtain more detailed insight into the charge storage process, we performed spectral fittings (see Supporting Information) to extract the integrated intensities of the in-pore resonances, the intensities being directly proportional to the number of ions in the carbon micropores. In the positive electrode, a clear general increase in the number of in-pore anions is observed as the cell voltage is increased (Figure 3a). At 2.48 V, a 46% increase in the number of in-pore anions as compared to 0 V is observed. Taking the number of in-pore anions with no applied potential as 1.6 mmol·g−1(Figure 1a), the corresponding number at 2.48 V is 2.3 mmol·g−1. Meanwhile, in the negative electrode, a general decrease in the number of anions in the carbon micropores is observed as the cell voltage is increased, the number of in-pore anions dropping by 29% from 0−2.48 V, corresponding to a value of 1.1 mmol of anions per gram of carbon at 2.48 V. The intensities obtained fromfits of the 1H spectra are shown in Figure 3b. In the positive electrode there are small decreases in the number of in-pore cations, while in the negative electrode there are small increases. Further inspection of the spectralfits reveals increases in the width of the spinning sideband manifold (i.e., increases in anisotropy) for the in-pore ions as the cell voltage is increased. Indeed, this can be seen in Figure 2a as an increase in the intensity of the in-pore spinning sidebands upon charging. These increases were observed in both electrodes (see Supporting Information), suggesting that charging restricts the motion of in-pore ions regardless of the electrode polarization. We also note that these changes of anisotropy make direct inspection of the intensity changes in Figure 2 difficult,
necessitating a full deconvolution that accounts for the spinning sidebands, as we carried out here.
Overall, the charge storage mechanism is summarized as follows. The pores are initially wetted with ionic liquid, with 1.6 mmol of in-pore ionic liquid per gram of material and an equal number of in-pore anions and cations. Charge storage then occurs by adsorption of counterions and desorption of co-ions, with TFSI− adsorption dominating charge storage in the positive electrode and TFSI− desorption dominating charge storage in the negative electrode. At the same time a smaller number of Pyr13+ are adsorbed in the negative electrode and
desorbed in the positive electrode during charging. We do not believe that the difference in the behavior of anions and cations is a kinetic effect, as supercapacitor cells were held at the studied voltages for relatively long times (1 h) compared to the time needed for current equilibration (at most 10 min). The volume of the ions is similar, suggesting that the origin of this phenomenon is not due to simple packing arguments. There are a number of possible causes of this effect, which include the following: (i) differences in the distribution of charge on the ions, (ii) steric effects due to differences in the shapes of the ions, and (iii) differences in the binding energies to the carbon. Further theoretical work and experiments must be done to explore these effects. We note that there are differences between the charging mechanism elucidated in our present
Figure 3.Number of in-pore ions for cells (YP50F, Pyr13TFSI ionic
liquid) at different cell voltages relative to 0 V. (a and b) Normalized populations for anions and cations, respectively. Straight lines are shown to guide the eye. Data points represent the average of two measurements made on separate cells, with error bars representing the standard deviation in this average. Anions enter the carbon micropores in the positive electrode and leave the carbon micropores in the negative electrode upon charging. At the same time, a smaller number of cations enter the pores of the negative electrode and leave the pores of positive electrode.
work (on Pyr13TFSI ionic liquid) and that in our previous study of tetraethylammonium tetrafluoroborate (1.5 M in acetoni-trile) with the same activated carbon. While desorption of anions was observed in the negative electrode (as seen here for Pyr13TFSI), in the positive electrode no significant changes of
the in-pore anion populations were observed below cell voltages of 0.75 V (in contrast to our present study), though anion adsorption was then observed above 0.75 V.47 In a further in situ NMR study of supercapacitors with a range of different organic electrolytes, we showed that the mechanism of charge storage (counterion adsorption, co-ion expulsion, ion exchange) is sensitive to the choice of electrolyte ions,48and our present work further emphasizes this point. For different electrolytes, different charging mechanisms may be observed with the same carbon electrode material.
Ourfindings here agree qualitatively with predictions from a molecular dynamics study of 1-butyl-3-methylimidazolium hexafluorophosphate ionic liquid in model porous carbon electrodes, where charge storage was shown to proceed with both counterion adsorption and co-ion desorption from initially filled pores.25
More recent theoretical work using mean-field theories28,29 and lattice models30 revealed similar pictures of charge storage. However, none of these theoretical studies have shown such significant differences between the behaviors of anions and cations.
A small number of recent experimental studies have also studied the charge storage mechanism of ionic liquid-based supercapacitors. Infrared (IR) spectroscopy studies have suggested that charge storage proceeds via ion exchange in KOH-treated carbon nanofibers with EMITFSI ionic liquid.57 In contrast, analogous IR experiments on untreated nano-fibers57
as well as carbide-derived carbon nanoparticles58 suggested that both anions and cations enter the carbon micropores during charging. A recent electrochemical quartz crystal microbalance (EQCM) study of carbide-derived carbon with EMITFSI ionic liquid revealed that charge storage is generally dominated by adsorption of counterions into the carbon micropores, while ion exchange also takes place at low electrode potentials in the positively polarized electrode.59 However, it is not straightforward to compare our results to those in the aforementioned IR and EQCM studies as they were performed under dynamic charging conditions (whereas the NMR measurements probe equilibrium states) and different materials were studied. Moreover, we note that IR measure-ments probe the surface or near surface of carbon particles, while in EQCM it is unclear how ions in pores and voids of different sizes contribute to the measured mass changes. We stress that in contrast to other characterization methods NMR allows the in-pore ions to be studied separately from ex-pore ions, allowing more definitive conclusions to be made.
We now turn our attention to the variation of the chemical shifts of the in-pore resonances observed during charging (Figure 4). Such changes arise from changes of the local magnetic environment of the ions. Clear increases in the in-pore chemical shift are observed for both anions (Figure 4a) and cations (Figure 4b) in both electrodes, with the change in chemical shift with voltage depending on the polarization of the electrode (positive or negative) rather than the type of ion studied. In the negative electrode, the total increase in in-pore chemical shift is 6.7± 0.1 ppm for the anions and 6.8 ± 0.2 ppm for the cations, with the changes being identical within error. For the positive electrode smaller increases of 5.7± 0.4
and 5.2± 0.5 ppm were observed for the anions and cations, respectively, again similar within error.
The observed shift changes arise from changes of the carbon electronic structure that occur upon charging. As electrons are added to or removed from the carbon, the nominally diamagnetic ring current effects become increasingly para-magnetic,47 shifting the in-pore resonance to higher frequen-cies. This effect has been observed in a number of experimental studies with organic electrolytes47−49,60 and supported by calculations of nucleus-independent chemical shifts nearby charged carbon fragments.47 The magnitude of the observed shift changes here are similar to those from in situ magnetic resonance imaging experiments on organic electrolyte-based supercapacitors,60further confirming that this phenomenon is a property of the carbon electronic structure rather than the structure of the electrolyte. We note that for the negative electrode the in-pore resonances shift past the ex-pore resonances at the highest voltage studied, giving overall positive shift differences between the in-pore and the ex-pore resonances. This further confirms the idea that the ring-current shift mechanism is inherently different in charged carbons, as compared to uncharged carbons where in-pore shifts are always negative. The differences in chemical shift variation between the positive and the negative electrodes presumably arise from differences in the carbon electronic structure as electrons are
Figure 4.In-pore chemical shifts (YP50F, Pyr13TFSI ionic liquid) as a
function of cell voltage. (a and b) Data for 19F and 1H spectra,
respectively. Data points represent the average of two measurements made on separate cells, with error bars representing the standard deviation in this average. Clear increases in chemical shift are seen for both ions in both electrodes. The shifts depend primarily on the polarization of the electrode (positive or negative) rather than the charge of the ion. Positions of the ex-pore resonances are also shown (the weighted average is shown for the cations (1H NMR), as there are
several resonances). Journal of the American Chemical Society
added or removed, though further theoretical work must be done to investigate this phenomenon.
3. Line Width of the in-Pore Resonance as a Measure of Ion Dynamics. Equipped with the knowledge that the migration of ions (particularly anions) in and out of carbon micropores brings about the storage of charge in ionic liquid supercapacitors, we went on to consider whether the NMR spectra are sensitive to the rate of ionic motion through the carbon pores. On cooling YP50F soaked with Pyr13TFSI to
273 K (Figure 5a), the ex-pore ionic liquid displays a dramatic change in line shape, with considerable broadening and a large increase in the width and intensity of the spinning sideband manifold. Below 273 K this line shape persists and does not show any further changes. This behavior is consistent with the ex-pore ionic liquid freezing upon cooling from 278 to 273 K. Indeed, the freezing point of Pyr13TFSI mixed with BP2000
(Cabot Corp.) porous carbon was recently reported to be 275 K, though the distinction was not made between in- and ex-pore liquid in that study.61Despite the freezing of ex-pore ionic liquid, the in-pore environment shows continual changes in line width throughout the low-temperature regime with no evidence of a freezing event observed. The freezing point of the in-pore ionic liquid is therefore suppressed relative to the ex-pore, presumably because confinement in the carbon micro-pores hinders the formation of an ordered solid phase. Xu et al. recently observed a similar phenomenon in a1H NMR study of a mesoporous carbon, where in-pore water remained liquid at temperatures as low as 223 K.41 Returning to Figure 5a, at temperatures of 278 K and above, the ex-pore resonance does not show any significant line width changes, while the in-pore line width steadily decreases as the temperature is increased. The19F MAS NMR spectra of YP50F soaked with EMITFSI
(Figure 5b) again show clear decreases of the in-pore line width as the sample temperature is increased. We did not find any evidence of freezing over the studied temperature range here, though this is not surprising given that the freezing point of EMITFSI is 223 K.62 The chemical shifts show small temperature dependences, the origins of which are discussed in the Supporting Information.
The measured19F in-pore line widths are plotted in Figure 5c and 5d and show clear decreases as the sample temperatures are increased. We find that the 19F in-pore line width is consistently smaller for EMITFSI than Pyr13TFSI over the studied temperature range. In addition to the measurements shown in Figure 5a and 5b (recorded at 7.1 T), we also recorded spectra at a higher magneticfield strength of 9.4 T. The in-pore line widths at 9.4 T are found to be greater in both Hz and ppm than those recorded at 7.1 T (Figure 5c and 5d). In principle, the in-pore line width could arise from a number of different mechanisms. First, the porous carbon studied here has a highly disordered structure such that the ions will occupy a range of different adsorption sites in the carbon micropores.26 Sites inside pores with different sizes, different graphene-like domain sizes, and different amounts of curvature will give rise to different ring current effects and thus a distribution of different chemical shifts.38In the absence of any motion, each ion will contribute separately to the spectrum and the line shape will represent the weighted distribution of the different chemical shifts in the system. In this case the line width should scale linearly (in Hz) with the magneticfield strength, yielding identical line widths on the ppm scale. However, diffusion (or “chemical exchange”) of the ions between the different sites leads to line shape perturbations.63,64When the rate of diffusive
motion exceeds the frequency width of the distribution of chemical shifts, a single coalesced resonance is observed which is narrower than the overall distribution of shifts. In the so-called “fast−intermediate” exchange regime, where the exchange rate is comparable to (but still greater than) the
Figure 5.19F MAS NMR (7.1 T) spectra of YP50F carbonfilm soaked
with (a) Pyr13TFSI and (b) EMITFSI at different temperatures. (c and
d) Measured in-pore line widths (full line width at half-maximum peak intensity), with additional measurements at 9.4 T also shown. Curved lines were added to the plots in c and d simply to guide the eye. Clear reductions in the in-pore line width are observed as the temperature is increased, reflecting the increase in the mobility of the anions in the carbon micropores.
width of the distribution of chemical shifts, increases in the rate of motion lead to a reduction of the peak line width, referred to as motional narrowing.64In this regime increases in line width (in ppm) are observed when the magneticfield is increased,65 as observed here (Figure 5d). This arises because at a higher magneticfield strength the distribution of chemical shifts spans a wider range of frequencies, and hence, more rapid motion is required for line narrowing. Second, the in-pore line width may also have a contribution from residual dipole−dipole couplings between the studied nuclear spins; however, a line width dominated by such interactions should remain constant (in Hz) at different magnetic field strengths. Our observations in Figure 5c, that the line widths show a significant increase at a stronger magnetic field, rule out dipole−dipole interactions as the dominant source of the line width.
Our findings point toward the distribution of different adsorption sites in the carbon as the dominant source of the in-pore line width. This is further corroborated by the temperature dependence of the NMR spectra. As the temperature is increased, the ions become increasingly mobile inside the carbon micropores and diffuse more quickly between the different sites. This leads to motional narrowing of the in-pore resonance, confirming that ionic motion is in the fast− intermediate regime.64 This is confirmed by 1H spectra recorded at 7.1 T (see Supporting Information), where the in-pore1H resonances again exhibit motional narrowing.
In principle, the observed line width changes can be directly correlated with the rate of motion. Extraction of accurate exchange rates, however, requires (i) an estimate of the line shape in the absence of ionic motion and (ii) a model for ionic motion in the highly heterogeneous carbon pore structure. While NICS calculations on model carbon fragments38can be used to estimate the range of possible shifts for adsorbed ions, the treatment of (ii) is not trivial since we do not know the distances and pathways between sites with different chemical shifts. We explored this issue in our recent lattice model calculations, which highlight the sensitivity of the observed line shapes to the spatial distribution of adsorption sites within a carbon particle.65In the absence of an accurate model for the micro- and macroscopic structure of this activated carbon, we developed a simple multisite exchange model to investigate the time scales required to reproduce the experimental line widths (see Supporting Information) and obtain order-of-magnitude estimates for the motion. In this approach we use the distribution of chemical shifts calculated in our prior NICS calculations38 on model carbon fragments to provide an estimate for the range of possible shifts and compute the effect of random jumps between the various sites on the NMR line shapes. Our simulations suggest that the diffusive motion of in-pore TFSI− between different adsorption sites in the carbon pores is thermally activated, with an activation barrier on the order of 10 kJ·mol−1. Our calculated time scales for this motion
(i.e., for random hops between the sites that give rise to the broadened line shape) vary on the order of ∼20−130 μs depending on the temperature (344−252 K) and the ionic liquid studied. At all temperatures studied, the time scale for in-pore TFSI−motion is faster for EMITFSI than for Pyr13TFSI. For example, at 294 K the calculated time scales are 72 and 56 μs for Pyr13TFSI and EMITFSI, respectively, meaning that
diffusion of in-pore TFSI−is 1.3 times faster for EMITFSI than Pyr13TFSI at this temperature. We note that pulsed field
gradient NMR measurements on neat ionic liquids showed that TFSI−has faster self-diffusion in EMITFSI than Pyr13TFSI, by
a factor of 1.6 at 294 K.66,67 Our measurements demonstrate that this general difference is retained under confinement, though the difference becomes smaller.
Crucially, the in-pore line width gives a measure of how quickly the ions diffuse through the carbon pores, allowing us to compare the mobility of different electrolytes under confinement; the faster the diffusion is, the narrower the in-pore resonance. Ourfinding that the TFSI anions diffuse more rapidly through the carbon micropores for EMITFSI than for Pyr13TFSI has important implications for the power perform-ances of these ionic liquids as supercapacitor electrolytes (discussed later). At this point we also comment that attempts to extract pore size distributions from NMR spectra42of porous carbons soaked with liquids will be complicated by the effects of chemical exchange between the different sites.
4. Effects of Addition of Acetonitrile to Ionic Liquids. Acetonitrile was added to a sample of YP50F and Pyr13TFSI to
study the effect of an organic solvent on the structure and dynamics of the carbon−electrolyte interface. Deuterated acetonitrile (D3CCN or dACN) was used to allow the separate
study of the solvent and Pyr13 cations, the resulting 1.8 M electrolyte being referred to as Pyr13TFSI/dACN. Comparison
of the 19F and 1H spectra (Figure 6a and 6b) with those
obtained without a solvent (Figure 1a and 1b) shows that the line widths of the in-pore resonances are dramatically decreased following addition of acetonitrile. For example, the line width of the in-pore19F resonance drops from 2530 (Figure 5c) to 340 Hz (Figure 6a). The observation of an in-pore resonance in the
2H spectrum (Figure 6c) confirms the presence of acetonitrile
in the carbon micropores. The broader resonances observed here (compared to say Figure 6a) may arise from chemical exchange of solvent molecules between the in-pore and the ex-pore environments. Spectra were also recorded for a sample containing YP50F and EMITFSI/dACN (see Supporting Information), with in-pore resonances again significantly narrowed compared to the sample without solvent. The large reductions of the in-pore line widths for anions and cations following the addition of acetonitrile show that its presence in the micropores greatly speeds up in-pore ionic diffusion. On the basis of our multisite exchange simulations (see Supporting Information), we calculate a time scale of 13μs for motion of in-pore TFSI for Pyr13TFSI/dACN, that is, in-pore diffusion of TFSI−is 5.5 times faster following the addition of acetonitrile, representing a dramatic increase. For EMITFSI/dACN we calculate an identical time scale of 13 μs for in-pore TFSI, suggesting that the motion of in-pore anions is not significantly affected by different cations in the solvated electrolytes. We note that the difference between the19F chemical shifts of the in- and ex-pore resonances decreases slightly from 6.6 to 5.7 ppm after adding solvent. We propose that the presence of acetonitrile slightly lengthens the average carbon−ion distances, giving rise to weaker ring current effects. This may be due to the partial solvation of the ions, though the increased exchange between the in-pore and the ex-pore environments may also have an effect.
Table 1 summarizes the populations of in-pore anions and the corresponding volumes of in-pore electrolyte for neat and solvated ionic liquids. For both ionic liquids, the number of in-pore anions decreases following addition of acetonitrile, yet the total volume of in-pore electrolyte increases slightly. These two findings suggest that acetonitrile displaces some ions from the carbon micropores while at the same time occupying some previously empty pores that are inaccessible to the ions. This
latterfinding is consistent with molecular dynamics simulations of 1-butyl-3-methylimidazolium hexafluorophosphate/ACN in a model porous carbon, which showed that acetonitrile is able to occupy the smaller carbon pores with tubular and pocket-like geometries, while ions tend to occupy less confined sites.26 Going further, we calculate ratios of solvent molecules to ion pairs in the pores, which represent average solvation numbers. For both electrolytes, the in-pore solvation number is reduced
compared to that for the overall electrolyte (calculated as 5.0 in both cases). This shows that in the absence of an applied potential, solvation numbers are decreased in the carbon micropores, with the effect being more significant for EMITFSI than Pyr13TFSI. This is presumably as the ions have stronger noncovalent interactions with the carbon than the solvent. The increased in-pore ion desolvation of the EMI+-based electrolyte
could arise from stronger carbon−ion interactions for EMI+ (compared to Pyr13+), though there may also be a contribution
from differences in the ion desolvation energies. We note that EMI+ has an aromatic π system that may permit π−π
interactions with carbon surfaces. While we observe greater in-pore populations for EMITFSI than Pyr13TFSI (with or without a solvent), we do not, however, see significant differences in the ring current shifts for the two cations (in-pore−ex-pore separations are ∼6.6 ppm in both cases). This suggests that the desolvation energies of the ions are also important in determining the in-pore solvation numbers.
5. Implications for Charging Dynamics. Overall, our NMR measurements have shown that supercapacitor charging involves both adsorption of counterions and desorption of co-ions, with the adsorption and desorption of anions playing a more dominant role than that of cations (section 2), while in-pore line widths have been correlated with the rate at which ionic species diffuse through the carbon micropores (sections 3 and 4). Together these findings offer a new opportunity to rationalize the power performances of supercapacitors. Figure 7
shows measurements of the gravimetric capacitance of three supercapacitor cells comprising YP50F electrodes with different
Figure 6. MAS NMR (7.1 T) spectra of YP50F film soaked with Pyr13TFSI/dACN (1.8 M).19F,1H, and2H spectra are shown in a, b,
and c, allowing study of the anions, cations, and solvent, respectively. Spectra show that the addition of an organic solvent significantly increases the mobility of the in-pore ions.
Table 1. Comparison of the Number of Moles of In-Pore Anions for the Four Electrolytes Studied in This Worka
electrolyte mol of TFSI−in-pore/mmol·g−1 electrolyte volume in-pore/cm3·g−1 % pore volume occupied solvent:ions in-pore
Pyr13TFSI 1.6 0.28 40%
Pyr13TFSI/dACN (1.83 M) 1.1 0.34 48% 4.6
EMITFSI 1.8 0.29 40%
EMITFSI/dACN (1.87 M) 1.2 0.30 42% 3.5
aElectrolyte volumes are calculated using the ion volumes given in section 1. For solvated ionic liquids, the volume of acetonitrile (46 Å per molecule)54is included, with the moles of in-pore acetonitrile determined fromfitting of the2H spectra. The % pore volume occupied is calculated
by comparing the electrolyte volume to the carbon pore volume measured by N2gas sorption (0.71 cm3·g−1).55Finally, calculated ratios of in-pore
solvent to ion pairs are given, assuming equal numbers of anions and cations in the pores.
Figure 7.Gravimetric capacitance measurements for symmetric coin cells with YP50F activated carbon electrodes and different electrolytes. Capacitances were measured for a series of different current densities at ambient temperature. Exponential fits are shown, with R2 values varying from 0.99 to 0.92 to 0.94 for Pyr13TFSI, EMITFSI, and
Pyr13TFSI/ACN, respectively. The results show that these three
electrolytes have very different power handling capabilities. Journal of the American Chemical Society
electrolytes. At low current densities the gravimetric capacitances of the three cells are similar, with the capacitance of the EMITFSI-based cell being slightly larger than that of the Pyr13TFSI and Pyr13TFSI/ACN cells. As the applied current is
increased, all cells show a decrease in capacitance, though the EMITFSI-based cell shows better performance at high currents than the Pyr13TFSI cell, while the Pyr13TFSI/ACN cell outperforms both cells with neat ionic liquids. This is quantified by exponentialfits of the form
= ⎛ − ⎝ ⎜ ⎞ ⎠ ⎟ C m C m I m i m exp / / 0
where m is the electrode mass, C0/m is the gravimetric
capacitance in the limit of I → 0, and i/m is a characteristic current density at which the capacitance, C, has decayed to C0/
e. The larger the value of i/m, the better the capacitance retention with increasing current density. We obtain i/m values of 1.9, 3.4, and 8.4 A·g−1 for Pyr13TFSI, EMITFSI ,and
Pyr13TFSI/ACN (1.8 M), respectively, giving a ratio of
1:1.8:4.4.
We showed that for EMITFSI the in-pore anions are more mobile than for Pyr13TFSI (section 3), while addition of
acetonitrile greatly increases the mobility of the anions and cations in the carbon micropores (section 4). Our line width measurements and simulations allowed us to estimate the ratio of in-pore anionic diffusion rates as 1:1.3:5.5 for Pyr13TFSI,
EMITFSI, and Pyr13TFSI/ACN (1.8 M), respectively. These
values show reasonable correlation with the i/m values above and help explain the observed electrochemical rate perform-ance. The faster the in-pore ionic diffusion, the better the capacitance retention at high current rates. Overall, ourfindings show that the development of new ionic liquids with faster in-pore ionic diffusion is crucial if these devices are to compete with conventional organic electrolytes in terms of power performance. Finally, we note that the diffusion information obtained from the NMR experiments is for samples in equilibrium states with no applied voltage. Any changes of ionic mobility that might occur during charging are not considered. This is in contrast to the capacitance measurements that probe dynamic processes where the voltage continuously varies. Future studies will be carried out to probe ionic diffusion under dynamic charging conditions.
■
CONCLUSIONNMR spectroscopy has been used to study the structure and dynamics of ionic liquids adsorbed in porous carbon. We make the following main conclusions:
(1) The anions and cations of Pyr13TFSI and EMITFSI ionic liquids wet the micropores of YP50F activated carbon in the absence of an applied potential difference, with 40% of the pore volume accessible to N2 gas accessible to ionic liquid in each case.
(2) Ex situ NMR measurements carried out on the YP50F/ Pyr13TFSI supercapacitor system at different cell voltages show that the charge storage mechanism involves both counterion adsorption and co-ion desorption. In the positive electrode, charging occurs by anions entering the carbon micropores, with a smaller number of cations being ejected from the pores. In the negative electrode, charging occurs primarily by ejection of anions from the pores, with a smaller number of cations entering the pores. The somewhat unexpected differences in the
behavior of anions and cations (with the anions dominating the charge storage process) will be the subject of further theoretical studies.
(3) Charge storage is accompanied by changes to the chemical shift observed for in-pore ions. These chemical shifts depend on the polarization of the electrode, rather than on the nature of the ion. In principle, these shift changes contain information about the electronic structure of the carbon, which will be studied in future work.
(4) Variable-temperature and variable-magneticfield strength measurements show that the line width of the in-pore resonance is particularly sensitive to the rate of diffusion of ions between different sites inside the carbon micropores. The TFSI anions are more mobile inside the carbon micropores for EMITFSI than Pyr13TFSI
ionic liquid, the in-pore TFSI diffusion being approx-imately 1.3 times faster for EMITFSI than for Pyr13TFSI at 294 K.
(5) Addition of acetonitrile to ionic liquids greatly increases the mobility of the anions and cations inside the carbon micropores. For Pyr13TFSI, we calculate that in-pore
anions diffuse ∼5.5 times more rapidly following the addition of acetonitrile (to form a 1.8 M electrolyte), with acetonitrile replacing some of the ionic liquid in the carbon pores. Moreover, wefind that despite the absence of an applied potential, the average ion solvation numbers are decreased inside the carbon micropores relative to outside.
(6) Finally, when the insights obtained from our NMR measurements are combined with capacitance measure-ments at different charging/discharging rates, we find ionic liquids with faster in-pore ionic diffusion allow faster charging and discharging in supercapacitors. Specifically, we showed that the faster diffusion of in-pore anions in EMITFSI allows faster charge storage than for Pyr13TFSI. Addition of acetonitrile solvent dramatically increases the rate of ionic diffusion in the carbon micropores, allowing even faster charging (although the operating voltage range will then be reduced).
New ionic liquids with faster in-pore ionic diffusion must be developed if they are to compete with the power performance of organic electrolytes. Measurements of in-pore line widths in NMR experiments represent an interesting new method to probe the rate of in-pore diffusion and should facilitate the testing of new carbon−electrolyte combinations for application in supercapacitors. Overall, our measurements offer new insight into the charge storage mechanism of ionic liquid-based supercapacitors at the molecular level. The commonly held assumption that charge storage is predominantly adsorption driven represents an oversimplification of the true mechanism. Wefind that the precise mechanism of charge storage depends on the polarization of the electrode, with anion adsorption dominating charge storage in the positive electrode and anion desorption dominating in the negative electrode, while adsorption/desorption of cations plays a minor role. Our measurements also represent afirst look at how ionic diffusion can differ in carbon micropores when different ionic liquids are used and help explain the resulting charging dynamics. Work is ongoing in our laboratory to study the relationship between the carbon pore structure and the electrolyte and how this affects
ion dynamics and charge storage in supercapacitors. Beyond electrochemical energy storage, we also envisage that our studies of adsorption and transport in porous carbons will facilitate their use in applications including gas storage, catalysis, and electrochemical desalination of water.
■
ASSOCIATED CONTENT*
S Supporting InformationStatic NMR spectra of supercapacitor electrodes, spectra showing the absence of self-discharge effects for disassembled coin cell electrodes, details on changes of in-pore anisotropy with cell voltage, plots of 19F chemical shift changes with temperature, 1H variable-temperature NMR data, multisite
chemical exchange simulations, and spectra of YP50F soaked with EMITFSI/dACN. The Supporting Information is available free of charge on the ACS Publications website at DOI: 10.1021/jacs.5b03958.
■
AUTHOR INFORMATIONCorresponding Author
Notes
The authors declare no competingfinancial interest.
■
ACKNOWLEDGMENTSA.C.F., J.M.G., C.M., P.M.B., H.W., and C.P.G. acknowledge the Sims Scholarship (A.C.F), EPSRC (via the Supergen consortium, J.M.G.), The School of Physical Sciences (University of Cambridge) for funding through an Oppen-heimer Research Fellowship (C.M.), The Marie Curie FP7 International Incoming Fellowship (P.M.B.), and the EU ERC (via an Advanced Fellowship to C.P.G.) for funding. A.C.F. and J.M.G. thank the NanoDTC Cambridge for travel funding. P.S. acknowledges support from the European Research Council (ERC, Advanced Grant, ERC-2011-AdG, Project 291543− IONACES). Finally, we thank Nicole Trease, Andrew Ilott, Phoebe Allan, Andrew Pell, Kent Griffith, Beth Howe, Wan-Yu Tsai, Lorie Trognko, Pierre-Louis Taberna, Yury Gogotsi, Alexei Kornyshev, Volker Presser, and Daniel Weingarth for useful discussions.
■
REFERENCES(1) Simon, P.; Gogotsi, Y. Acc. Chem. Res. 2013, 46, 1094. (2) Béguin, F.; Presser, V.; Balducci, A.; Frackowiak, E. Adv. Mater. 2014, 26, 2219.
(3) Chmiola, J.; Yushin, G.; Gogotsi, Y.; Portet, C.; Simon, P.; Taberna, P.-L. Science 2006, 313, 1760.
(4) Raymundo-Piñero, E.; Kierzek, K.; Machnikowski, J.; Béguin, F. Carbon 2006, 44, 2498.
(5) Largeot, C.; Portet, C.; Chmiola, J.; Taberna, P.-L.; Gogotsi, Y.; Simon, P. J. Am. Chem. Soc. 2008, 130, 2730.
(6) Armand, M.; Endres, F.; Macfarlane, D.; Ohno, H.; Scrosati, B. Nat. Mater. 2009, 8, 621.
(7) Béguin, F.; Presser, V.; Balducci, A.; Frackowiak, E. Adv. Mater. 2014, 26, 1.
(8) Brandt, A.; Pohlmann, S.; Varzi, A.; Balducci, A.; Passerini, S. MRS Bull. 2013, 38, 554.
(9) Lewandowski, A.; Olejniczak, A.; Galinski, M.; Stepniak, I. J. Power Sources 2010, 195, 5814.
(10) Largeot, C.; Taberna, P. L.; Gogotsi, Y.; Simon, P. Electrochem. Solid-State Lett. 2011, 14, A174.
(11) Tsai, W.-Y.; Lin, R.; Murali, S.; Li Zhang, L.; McDonough, J. K.; Ruoff, R. S.; Taberna, P.-L.; Gogotsi, Y.; Simon, P. Nano Energy 2013, 2, 403.
(12) Lin, R.; Taberna, P.; Presser, V.; Pérez, C. R.; Malbosc, F.; Rupesinghe, N. L.; Teo, K. B. K.; Gogotsi, Y.; Simon, P. J. Phys. Chem. Lett. 2011, 2, 2396.
(13) Fedorov, M. V.; Kornyshev, A. A. Chem. Rev. 2014, 114, 2978. (14) Merlet, C.; Rotenberg, B.; Madden, P. A.; Salanne, M. Phys. Chem. Chem. Phys. 2013, 15, 15781.
(15) Fedorov, M. V.; Kornyshev, A. A. Electrochim. Acta 2008, 53, 6835.
(16) Merlet, C.; Salanne, M.; Rotenberg, B.; Madden, P. A. J. Phys. Chem. C 2011, 115, 16613.
(17) Vatamanu, J.; Borodin, O.; Smith, G. D. J. Am. Chem. Soc. 2010, 132, 14825.
(18) Vatamanu, J.; Borodin, O.; Smith, G. D. J. Phys. Chem. B 2011, 115, 3073.
(19) Li, H.; Wood, R. J.; Endres, F.; Atkin, R. J. Phys.: Condens. Matter 2014, 26, 284115.
(20) Carstens, T.; Gustus, R.; Ho, O.; Borisenko, N.; Endres, F.; Li, H.; Wood, R. J.; Page, A. J.; Atkin, R. J. Phys. Chem. C 2014, 118, 10833.
(21) Black, J. M.; Walters, D.; Labuda, A.; Feng, G.; Hillesheim, P. C.; Dai, S.; Cummings, P. T.; Kalinin, S. V.; Proksch, R.; Balke, N. Nano Lett. 2013, 13, 5954.
(22) Perkin, S.; Crowhurst, L.; Niedermeyer, H.; Welton, T.; Smith, A. M.; Gosvami, N. N. Chem. Commun. 2011, 47, 6572.
(23) Smith, A. M.; Lovelock, K. R. J.; Gosvami, N. N.; Licence, P.; Dolan, A.; Welton, T.; Perkin, S. J. Phys. Chem. Lett. 2013, 4, 378.
(24) Perkin, S. Phys. Chem. Chem. Phys. 2012, 14, 5052.
(25) Merlet, C.; Rotenberg, B.; Madden, P. A.; Taberna, P. L.; Simon, P.; Gogotsi, Y.; Salanne, M. Nat. Mater. 2012, 11, 306.
(26) Merlet, C.; Péan, C.; Rotenberg, B.; Madden, P. A.; Daffos, B.; Taberna, P.-L.; Simon, P.; Salanne, M. Nat. Commun. 2013, 4, 2701. (27) Péan, C.; Merlet, C.; Rotenberg, B.; Madden, P. A.; Taberna, P.; Daffos, B.; Salanne, M.; Simon, P. ACS Nano 2014, 8, 1576.
(28) Kondrat, S.; Kornyshev, A. J. Phys. Chem. C 2013, 117, 12399. (29) Kondrat, S.; Wu, P.; Qiao, R.; Kornyshev, A. A. Nat. Mater. 2014, 13, 387.
(30) Lee, A. A.; Kondrat, S.; Kornyshev, A. A. Phys. Rev. Lett. 2014, 113, 048701.
(31) Lee, A. A.; Kondrat, S.; Oshanin, G.; Kornyshev, A. A. Nanotechnology 2014, 25, 315401.
(32) Harris, R. K.; Thompson, T. V.; Norman, P. R.; Pottage, C.; Trethewey, A. N. J. Chem. Soc., Faraday Trans. 1995, 91, 1795.
(33) Harris, R. K.; Thompson, T. V.; Norman, P. R.; Pottage, C. J. Chem. Soc., Faraday Trans. 1996, 92, 2615.
(34) Shaw, J. A.; Harris, R. K.; Norman, P. R. Langmuir 1998, 6716. (35) Harris, R. K.; Thompson, T. V.; Norman, P. R.; Pottage, C. Carbon 1999, 37, 1425.
(36) Dickinson, L. M.; Harris, R. K.; Shaw, J. A.; Chinn, M.; Norman, P. R. Magn. Reson. Chem. 2000, 38, 918.
(37) Lazzeretti, P. Prog. Nucl. Magn. Reson. Spectrosc. 2000, 36, 1. (38) Forse, A. C.; Griffin, J. M.; Presser, V.; Gogotsi, Y.; Grey, C. P. J. Phys. Chem. C 2014, 118, 7508.
(39) Borchardt, L.; Oschatz, M.; Paasch, S.; Kaskel, S.; Brunner, E. Phys. Chem. Chem. Phys. 2013, 15, 15177.
(40) Anderson, R. J.; McNicholas, T. P.; Kleinhammes, A.; Wang, A.; Liu, J.; Wu, Y. J. Am. Chem. Soc. 2010, 132, 8618.
(41) Xu, Y.; Watermann, T.; Limbach, H.-H.; Gutmann, T.; Sebastiani, D.; Buntkowsky, G. Phys. Chem. Chem. Phys. 2014, 16, 9327.
(42) Xing, Y.-Z.; Luo, Z.-X.; Kleinhammes, A.; Wu, Y. Carbon 2014, 77, 1132.
(43) Kibalchenko, M.; Payne, M. C.; Yates, J. R. ACS Nano 2011, 5, 537.
(44) Sebastiani, D. ChemPhysChem 2006, 7, 164.
(45) Forse, A. C.; Griffin, J. M.; Wang, H.; Trease, N. M.; Presser, V.; Gogotsi, Y.; Simon, P.; Grey, C. P. Phys. Chem. Chem. Phys. 2013, 15, 7722.
(46) Wang, H.; Köster, T. K.-J.; Trease, N. M.; Ségalini, J.; Taberna, P.-L.; Simon, P.; Gogotsi, Y.; Grey, C. P. J. Am. Chem. Soc. 2011, 133, 19270.
(47) Wang, H.; Forse, A. C.; Griffin, J. M.; Trease, N. M.; Trognko, L.; Taberna, P.-L.; Simon, P.; Grey, C. P. J. Am. Chem. Soc. 2013, 135, 18968.
(48) Griffin, J. M.; Forse, A. C.; Wang, H.; Trease, N. M.; Simon, P.; Grey, C. P. Faraday Discuss. 2014, 176, 49.
(49) Deschamps, M.; Gilbert, E.; Azais, P.; Raymundo-Piñero, E.; Ammar, M. R.; Simon, P.; Massiot, D.; Béguin, F. Nat. Mater. 2013, 12, 351.
(50) Bielecki, A.; Burum, D. P. J. Magn. Reson. 1995, 116, 215. (51) Beckmann, P.; Dybowski, C. J. Magn. Reson. 2000, 146, 379. (52) Massiot, D.; Fayon, F.; Capron, M.; King, I.; Le Calvé, S.; Alonso, B.; Durand, J.-O.; Bujoli, B.; Gan, Z.; Hoatson, G. Magn. Reson. Chem. 2002, 40, 70.
(53) Stoller, M. D.; Ruoff, R. S. Energy Environ. Sci. 2010, 3, 1294. (54) Molinspiration Property Calculation Service, http://www. molinspiration.com/services/volume.html.
(55) Porada, S.; Weingarth, D.; Hamelers, H. V. M; Bryjak, M.; Presser, V.; Biesheuvel, P. M. J. Mater. Chem. A 2014, 2, 9313.
(56) Presser, V.; Dennison, C. R.; Campos, J.; Knehr, K. W.; Kumbur, E. C.; Gogotsi, Y. Adv. Energy Mater. 2012, 2, 895.
(57) Richey, F. W.; Tran, C.; Kalra, V.; Elabd, Y. A. J. Phys. Chem. C 2014, 118, 21846.
(58) Richey, F. W.; Dyatkin, B.; Gogotsi, Y.; Elabd, Y. A. J. Am. Chem. Soc. 2013, 135, 12818.
(59) Tsai, W.-Y.; Taberna, P.-L.; Simon, P. J. Am. Chem. Soc. 2014, 136, 8722.
(60) Ilott, A.; Trease, N.; Grey, C.; Jerschow, A. Nat. Commun. 2014, 5, 4536.
(61) Weingarth, D.; Drumm, R.; Foelske-schmitz, A.; Kotz, R.; Presser, V. Phys. Chem. Chem. Phys. 2014, 16, 21219.
(62) McEwen, A. B.; Ngo, H. L.; Lecompte, K.; Goldman, J. L. J. Electrochem. Soc. 1999, 146, 1687.
(63) Keeler, J. Understanding NMR Spectroscopy, 2nd ed.; Wiley: Chichester, 2010.
(64) Levitt, M. Spin Dynamics: Basics of Nuclear Magnetic Resonance, 2nd ed.; Wiley: Chichester, 2008.
(65) Merlet, C.; Forse, A. C.; Griffin, J. M.; Frenkel, D.; Grey, C. P. J. Chem. Phys. 2015, 094701.
(66) Borodin, O.; Gorecki, W.; Smith, G. D.; Armand, M. J. Phys. Chem. B 2010, 114, 6786.
(67) Bayley, P. M.; Best, A. S.; Macfarlane, D. R.; Forsyth, M. Phys. Chem. Chem. Phys. 2011, 13, 4632.