OATAO is an open access repository that collects the work of Toulouse
researchers and makes it freely available over the web where possible
Any correspondence concerning this service should be sent
to the repository administrator:
[email protected]
This is an author’s version published in: http://oatao.univ-toulouse.fr/22009
To cite this version:
González-Labrada, Katia
and Alcorta Cuello, Diana Rosa and Saborit Sánchez, Israel and
García Batle, Marise and Manero, Marie-Hélène
and Barthe, Laurie
and Jáuregui-Haza,
Ulises Javier Optimization of ciprofloxacin degradation in wastewater by homogeneous
sono-Fenton process at high frequency. (2019) Journal of Environmental Science and Health, Part
A. 1-10. ISSN 1093-4529
Official URL :
https://doi.org/10.1080/10934529.2018.1530177
Optimization of ciprofloxacin degradation in wastewater by homogeneous sono-Fenton 1
process at high frequency 2
3
KATIA GONZÁLEZ LABRADA1,3, DIANA ROSA ALCORTA CUELLO1, ISRAEL 4
SABORIT SÁNCHEZ2, MARISE GARCÍA BATLE2, MARIE-HELENE MANERO3, 5
LAURIE BARTHE3, and ULISES JAVIER JÁUREGUI-HAZA2* 6
7
1Universidad Tecnológica de la Habana “José Antonio Echeverría” CUJAE, Avenida 114,
8
Marianao, La Habana, Cuba. 9
2Instituto Superior de Tecnologías y Ciencias Aplicadas-Universidad de La Habana, Avenida
10
Salvador Allende No 1110 entre Infanta y Avenida Rancho Boyeros, Quinta de los Molinos, 11
A.P. 6163, La Habana 10400, Cuba. 12
13
____________________________ 14
3Laboratoire de Génie Chimique, Université de Toulouse, CNRS, Toulouse, France
15
*Address correspondence to Ulises Jáuregui Haza, Instituto Superior de Tecnologías y 16
Ciencias Aplicadas (InSTEC) - Universidad de La Habana, La Habana, Cuba; Phone: 17
5378789855 18
e-mail: [email protected]; [email protected]
19
Abstract 20
Emerging pollutants such as pharmaceuticals have been focusing international attention for a 21
few decades. Ciprofloxacin (CIP) is a common drug that is widely found in hospital and 22
wastewater treatment plants effluents, as well as in rivers. In this work, the feasibility of CIP 23
degradation by ultrasound process at high frequency is discussed and sonolysis, sonolysis 24
with hydrogen peroxide and sono-Fenton are evaluated. The amounts of hydrogen peroxide 25
and ferrous ions (Fe2+) needed were optimized using response surface methodology. Best 26
results were obtained with the sono-Fenton process resulting in a total pharmaceutical 27
degradation within 15 minutes and a mineralization greater than 60% after one hour. Optimal 28
conditions were tested on a real matrix from a municipal wastewater treatment plant. Even if 29
the degradation of the pollutants by sono-Fenton was hampered, the removal efficiency of 30
both CIP and total organic carbon (TOC) is interesting as an increase in the biodegradability 31
of the wastewater is found. These results show that sono-Fenton oxidation can be a promising 32
pre-treatment process for pharmaceutical-containing wastewaters. 33
34
KEYWORDS: Advanced oxidation processes, pharmaceuticals, optimization, sono-Fenton, 35
ultrasound, wastewater treatment 36
Introduction 37
The use of thousands of tons of pharmaceuticals to treat human and animal illnesses, but also 38
in farming and aquaculture has become a serious problem for environment and human health. 39
[1-4] They could be toxic to aquatic life when released in the environment [5-9] , even at very 40
low concentrations (parts-per-trillion to parts-per-billion) in aquatic systems. [10, 11] Depending 41
on the drugs, up to 95% of the administered dose can be excreted unchanged or as active 42
metabolites and enter the environment altering rivers, lakes and groundwater. [1-4,12] Most 43
drugs are designed so that they keep their chemical structure long enough to exert their 44
therapeutic effect. This property, combined with their continuous input into the ecosystem, 45
may enable them to persist for an extended period of time. [13] Antibiotics are of particular 46
concern because their presence in natural waters could contribute to the rise of antibiotic 47
resistance in microorganisms. [14-19] 48
Fluoroquinolones are a group of antibiotics widely used in human and animal therapy. Among 49
them, ciprofloxacin (1-cyclopropyl-6-fluoro-4-oxo-7-piperazin-1-ylquinoline-3-carboxylic 50
acid, CIP) is a non-biodegradable antibiotic that has been detected in wastewater treatment 51
plant effluents in concentrations from 5.6 μg L -1 to 6.5 mg L−1. [21, 22] The molecular structure 52
of CIP is shown in figure 1. 53
Conventional wastewater treatment processes such as biological degradation or adsorption
54
have been verified to be ineffective for the removal of most antibiotics. [17, 20]In recent years, a
55
considerable interest has been shown in the development and application of Advanced 56
Oxidation Processes (AOPs) for the treatment of pharmaceutical contaminants in water. [7, 23] 57
Several techniques such as ozonation, photocatalysis or UV/H2O2 have been the focus of a 58
great deal of research. More recently, ultrasonic irradiation has received significant attention 59
thanks to its ability to promote the fast degradation of environmental pollutants in water. [24, 60
25] The mechanism of sonolysis is based on cavitation, which is the formation, growth, and 61
sudden collapse of bubbles in liquids. The collapse of these bubbles leads to extremely high 62
local temperatures and pressures. These localized hot spots were estimated to have 63
temperatures of roughly 5200 K, pressures of about 500 atm and lifetimes of a few 64
microseconds. [26-28] Two possible degradation routes are usually proposed. First, the 65
contaminant can undergo thermal degradation inside the cavity and in the interfacial region 66
(cavity–liquid). Second, formed free radicals (mainly OH•), can react with the contaminant in 67
the interfacial region or in the bulk solution. [29] This route allows sonolysis to be considered 68
as an AOP. High frequency ultrasound (US) generally raises the amounts of free radicals 69
because there are more cavitational events which subsequently lead to an increase in 70
contaminant degradation. However, an optimum frequency maximizes the degradation rate of 71
pollutant. The same phenomenon occurs with the ultrasound power. An increase of ultrasound 72
power could improve the degradation of pollutants; the rates of degradation may decrease 73
with further increase in power that is beyond its optimum value due to bubble cloud formation 74
on the ultrasonic probe surface. [30] The addition of strong oxidants such as hydrogen peroxide 75
or Fenton reagent to sonolysis can be used to improve the biodegradability of a real 76
pharmaceutical wastewater. [23, 31, 32] 77
There are not many previous studies concerning the sonolysis of CIP and its combination with 78
H2O2 and the Fenton reagent. The influence of operational parameters in the sonolysis on CIP 79
degradation and CIP initial concentration was studied by De Bel and collaborators. [33] Xiao et 80
al. [11] studied the role of matrix organic compounds on the sonolysis of CIP in aqueous 81
solutions. The effective destruction of CIP at the frequencies of 20 and 620 kHz has been 82
proven. It was also demonstrated that a larger size and lower concentration of matrix organics 83
in water have a smaller impact on the CIP degradation as compared to a smaller size and 84
higher concentration of matrix organics. [11] A report on ultrasound assisted Laccase catalysed 85
degradation of CIP at low frequency, 22 kHz, showed a maximum degradation of 51% at 86
0.02% (wt v-1) enzyme loading. As compared to conventional method, this technique not only 87
increases CIP degradation rate but also reduces degradation time. [34] Moreover, it was 88
observed that pH affected the ultrasonic degradation rate of aqueous CIP solution. [35] 89
In previous studies, Quesada et al. [30] showed that the integration of AOPs with the use of 90
oxidants such as hydrogen peroxide and Fenton's reagent improved the degradability of 91
pharmaceutical pollutants in water. They reported the use of H2O2 as a radical promoter to the 92
sono-degradation of paracetamol and levodopa. It has been also reported that the Fenton 93
chemistry combined with ultrasound treatment remarkably enhanced the sulfadiazine [36] and 94
paracetamol [32] degradation when concentrations of H2O2 and Fe2+ are optimized. 95
In this study, the application of sonolysis for the degradation of CIP in water is examined.
96
The intensification of the oxidation with H2O2 and the Fenton reagent under acidic conditions
97
on the CIP degradation rate is studied. Moreover, the hydrogen peroxide concentration and
98
relation between c(H2O2)/c(Fe 2+) in the sono-Fenton process are optimized using surface
99
response methodology (SRM). In addition, the best sono-Fenton conditions were evaluated
100
on a real matrix from a municipal wastewater treatment plant (WWTP).
Materials and Methods 102
Reagents 103
All solutions were prepared by dissolving CIP (Sigma-Aldrich, 99%) in distilled water. The 104
pH adjustment was carried out using 1 M solution of H2SO4, which was prepared with 105
concentrated sulfuric acid (95–97% purity) from Sigma-Aldrich. For high-performance liquid 106
chromatography (HPLC) analysis, acetonitrile (HPLC quality) and o-phosphoric acid (85%) 107
from Merck and Fisher, respectively, were used. The other chemicals employed were 108
FeSO4·7H2O (99.5%), potassium iodide (99.5%), sodium hydroxide (99%) and sodium sulfite 109
(98%) obtained from Sigma-Aldrich, and hydrogen peroxide (30% wt v-1), from Fluka. 110
Sonication experiments 111
An US multifrequency generator (Meinhardt Ultraschall technik) operating in continuous 112
mode at frequencies of 580 and 862 kHz and variable electric power output was connected to 113
a stainless steel transducer (E 805/T/M, ∅ 40 mm) for the sonication experiments. Actual 114
power dissipated into the liquid was measured by the standard calorimetric method according 115
to procedures detailed in other studies. [26, 27] Reactions were performed in a 0.5 L cylindrical 116
glass reaction vessel (internal ∅ 75 mm) with the transducer placed at the bottom of the vessel 117
in direct contact with the solution, at a depth of 57 mm from the liquid surface. Cooling of the 118
reaction mixture was achieved by circulating water through the vessel jacket, to maintain an 119
average temperature of 30±1°C, monitored by a thermometer immersed in the solution. The 120
experimental set-up is shown in figure 2. Solution pH was adjusted to the initial value (pH 3), 121
but not controlled over reaction time due to the particularities of the reactor. All US 122
experiments were performed with 250 mL of aqueous solutions containing CIP at 100 mg L−0. 123
Sono-Fenton experiments were carried out with a relation of concentrations of H2O2/Fe2+ 124
between 2-6. 125
The best conditions obtained for the sono-Fenton experiment were tested in a real matrix. 126
Influent samples were collected from WWTP “María del Carmen”, in Boyeros, Havana City, 127
Cuba, (W 82.40; N 23.04). Samples were collected in 2.5 L amber glass bottles and 128
transferred from the WWTP to our laboratory in cooled box and then kept refrigerated (+4 129
ºC). Wastewater samples were filtered after reaching room temperature using medium density 130
cellulose filter. The samples were then acidified to pH 3 by adding H2SO4. The wastewater 131
was characterized by Standard Method for the examination of water and wastewater. [37] In 132
all experiments, liquid samples periodically were drawn from the reaction vessel for chemical 133
analyses; the total volume withdrawn during a single experiment was less than 6% of the total 134
reacting volume. A solution containing KI, Na2SO3, and NaOH (each 0.1 M) was used to 135
quench the reaction in the samples when H2O2 and the Fenton reagent were used. The 136
obtained precipitate was removed on a 0.45 μm RC syringe filter prior to chemical analyses. 137
138
Chemical analysis 139
An HPLC system (SHIMADZU Prominence High Pressure model), involving a two solvent 140
delivery pump, UV/VIS diode array detector (SHIMADZU SPD-M20A model) and an 141
autosampler was used to follow the concentration-time profiles of CIP. The antibiotic was 142
analyzed at 40°C using a RP18 column (Super Sphere 100 model, 250 mm×4.6 mm; 5 μm) 143
with acetonitrile/ acidified water 13/87% (v/v) at 1.5 mL min−i as the mobile phase. The 144
injection volume was 20 μL, and detection was set at 278 nm. The CIP retention time was 145
about 9 min. The calibration curve (R2= 0.999) was obtained from external standards prepared 146
with known concentrations of the target compound. 147
A total organic carbon (TOC) analysis was performed using a TOC-LCPN Shimadzu analyzer 148
equipped with a non-dispersive infrared detector. The injection volume was 50 µ L. The 149
combustion reaction was achieved in a quartz pipe at 680 °C with a regular platinum catalyst. 150
The carried flow was oxygen at 150 mL min-1. 151
Degradation experiments were performed at an initial CIP concentration of 100 mg L−t, 30°C, 152
pH 3, and frequencies of 580 and 862 kHz and at three different ultrasonic powers. The 153
degradation of CIP by the US−process, D, is defined by Equation 1. 154
D % = Co − CCo ∗ 100 (1)
where Co represents the initial concentration of CIP and C is the concentration of CIP at time 155
t. The mineralization (M) of CIP in the US-process, based on TOC concentration, was 156
calculated by Equation 2. 157
M % =TOCo − TOCTOCo ∗ OCo
(2)
where TOCo represents the initial concentration of the total organic carbon and TOC is the 158
concentration of total organic carbon at time t. 159
For checking the reproducibility of the evaluated processes, some experiments were 160
triplicated. The observed relative error was less than 5% for CIP concentration and TOC. 161
162
Results and discussion 163
Influence of ultrasonic frequency and power 164
The most important parameters in the sonolysis process are ultrasound power and frequency. 165
The sonochemical degradation of CIP at different powers was investigated using a 2x3 166
experimental design (Table 1), for two ultrasonic frequencies: 580 and 862 kHz. Figure 3 167
shows the influence of ultrasonic frequency and power on CIP degradation and mineralization 168
at 100 mg L−0initial concentration, 30°C and pH 3. The best mineralization and degradation 169
correspond to the highest power for both values of frequency studied. Figure 3 shows that the 170
highest efficiency on CIP degradation after 120 min was obtained at 580 kHz. 171
US power affects cavitational activity and has a significant influence on TOC removal (22%) 172
mainly at the lowest frequency. In these experimental conditions, the initial removal rates 173
increased with the power. Similar results were obtained for US degradation of levodopa and 174
paracetamol at 574 and 860 kHz, but significantly lower removals were reported, 66 and 67% 175
respectively, at the highest frequency 1,134 kHz. [30] De Bel et al. [33] found that the lowest 176
frequency, 544 kHz, proved to be the most favorable on CIP degradation. The ultrasonic 177
frequency significantly affects sonolysis due to both the critical size and lifetime of cavitation 178
bubbles, which consequently affects the number of cavitation bubbles, the violence of the 179
bubble collapse and the OH• radical production. [11, 38, 39] Higher ultrasound frequencies are 180
more effective for generating hydroxyl radicals owing to the rapid microbubble collapse. 181
However, a maximum frequency should not be exceeded to avoid affecting degradation rates 182
and cavitation effects. Actually, the rarefaction cycle of the sound wave produces a negative 183
pressure and the compression cycle occurs faster than the time needed for the microbubble to 184
collapse. Therefore, fewer HO• radicals are released. [39] Other authors have reported faster 185
degradation of organic compounds at 200-600 kHz frequencies . [11, 39-42] In any case, the 186
operating frequency must be optimized for the particular US-driven treatment process. 187
However, due to the formation of highly hydrophilic by-products during the process, poor 188
mineralization is usually observed using this process alone. [43] 189
Table 2 shows the pseudo first-order rate constant as a function of US frequency and power. 190
The degradation of CIP by the US−Sy the ada consistent with pseudo-first-order kinetics, as 191 follows: 192 193 0 ; c dc kc ln kt dt c − = = (3) 194
De Bel et al. [33] found comparable results for CIP sono-degradation at 25°C as the production 195
of HO• radicals was the highest at 544 kHz (k1 equal to 0.0067 min-1), in comparison with 801 196
kHz (k1 = 0.0055 min-1) and 1081 kHz (k1 = 0.0018 min-1). 197
Sonochemical reactions would be favored by an increase in US power at a fixed frequency. It 198
is widely accepted that higher ultrasonic power input increases the frequency of cavitation, 199
the number of active cavitation bubbles, the size of individual bubbles, as well as the rate of 200
generation and concentration of hydroxyl radicals. [44] During ultrasonic irradiation, two main 201
reactions occur: (1) pyrolysis due to the high temperature and pressure in the gas phase, and 202
(2) hydroxyl radical attack in the bubble-liquid interface and/or in the bulk liquid. Gas phase 203
pyrolytic reactions are considered to play a minor role in the case of non-volatile solutes. 204
According to its low volatility (Henry’s law constant = -18.3 atm.m3 mol-1 at 25°C [11]) and 205
low water solubility (Log Kow = 0.28 [45]), it has been demonstrated that the attack of hydroxyl 206
radicals on CIP molecules is the dominant reaction. [33, 35] Recent studies revealed the 207
intensification of the sonochemical degradation of levofloxacin at 20 kHz using carbon 208
tetrachloride as a rate enhancer. [44] The formation of °Cl radicals will lead to a series of 209
recombination reactions conducting to the formation of additional active species, such as 210
HClO, Cl2 and chlorine-containing radicals (Cl•, CCl3• and :CCl2), having strong oxidizing 211
property, which will markedly accelerate the degradation of levofloxacin in aqueous solution. 212
[44] It was reported[46] that the improvement of US power had a positive effect on the 213
degradation rate of the antibiotic, until an optimal power dissipation. Beyond this value, 214
cavitational activity and pollutant degradation, are either slightly affected or decreases. This 215
optimal power is dependent on the reactor configuration and on the particular 216
system/pollutant. 217
The values obtained for pseudo first-order rate constant (Table 3) are in the range which have 218
been previously reported by other authors for CIP degradation by several AOPs [33, 35, 47-49]. 219
The highest pseudo first-order rate constant obtained in this work is comparable with the 220
reported value by De Bell and collaborators. [33] 221
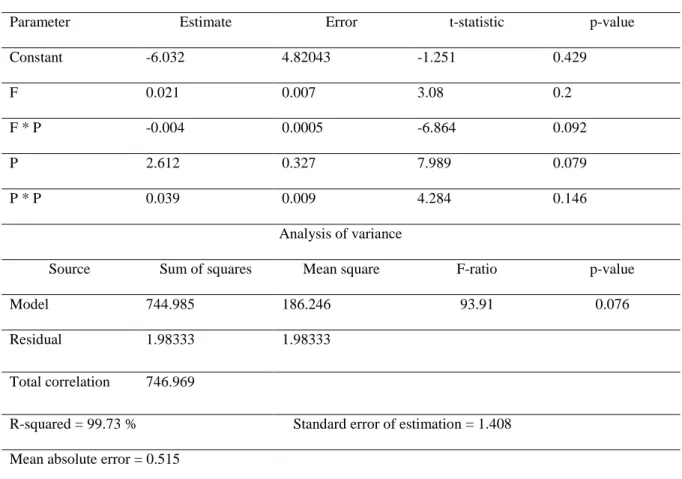
Two regression models were adjusted to evaluate the influence of both the frequency and 222
ultrasonic power on the degradation and mineralization of CIP according to Equations 4 and 223
5. The regression and variance analysis for both models are shown in Tables 1S and 2S 224
(supporting information). Figure 4 shows the response surface models of degradation (a) and 225
mineralization (b) for 2x3 experimental design. It is observed that increasing power is 226
favorable, in both cases. Both lineal models confirm that ultrasonic power is the most influent 227
variable for both the degradation and mineralization rate (Eq. 4 and 5). 228
deg = −6.032 + 0.021 F − 0.004 F ∗ P + 2.612 P + 0.039 P ∗ P R2 = 99.73%
(4)
min = −3.249 + 0.007 F − 0.002 F ∗ P + 1.949 ∗ P + 0.017P ∗ P R2 = 99.49 %
(5)
Intensification of CIP sono-degradation with the oxidant H2O2 as a radical promoter
229
Few reports about the combination of ultrasound with H2O2 on the fluoroquinolones 230
degradation have been found. [48] It is well documented in the literature that during aqueous 231
sonolysis, hydroxyl radicals are produced and recombined into H2O2 at the bubble-liquid 232
interface and/or in the bulk liquid. [50, 51] In general, H2O2 is expected to promote degradation 233
since it may be decomposed by US and/or react with H• generated by water sonolysis thus 234
generating additional HO• according to Equations 6 and 7. [7, 52] For this reason, the degradation 235
of organic compounds maybe augmented by an increase in the H2O2 dose. [53] 236
H2O2+ ))) →2 HO• (6) 237
H2O2 +H• → HO• + H2O (7) 238
where ))) refers to the ultrasonic irradiation. 239
Hydroxyl radicals can (i) degrade organic compounds, (ii) react with H2O2 (especially when 240
they are in large excess) forming less active species according to Equation 8 [36, 54, 55] (iii) or 241
recombine with different radicals according to Equations 9-11. [56-58] 242 H2O2 + HO• → HOO• + H2O (8) 243 HO•+ HO• → H 2O2 (9) 244 HO•+ H• → H2O (10) 245 HO•+HOO• → H2O + O2 (11) 246
Then, another set of experiments was carried out in order to study the effect of H2O2 addition 247
on CIP sonolysis. The stoichiometric amount of the required H2O2 for the complete oxidation 248
of CIP in aqueous solution was calculated according to Equation 12: 249
C17H18FN3O3(aq) + 47 H2O2(aq) = 3HNO3(aq) + HF(aq) +17CO2(g) + 54H2O(l) (12) 250
After one hour of reaction under stoichiometric conditions, a low CIP degradation was found: 251
5.9% under silent conditions . The influence of the oxidant concentration on CIP degradation 252
and mineralization was studied to understand the phenomena better. Experimental runs were 253
conducted with different concentrations of H2O2 corresponding to 0.5, 1, 5, 10, and 15 times 254
the stoichiometric amount (Figure 5). No increase in the CIP degradation was observed with 255
the addition of H2O2. This was verified by comparing the means of CIP degradation by 256
Student test (for α=0.05). When ultrasound is applied without H2O2 the degradation and 257
mineralization (35.8% and 22.6% respectively) were similar to the results obtained for one 258
time the stoichiometric amount of H2O2 (36.5% and 24.4% respectively), the highest values 259
obtained when hydrogen peroxide was added. In some of the experiments, the addition of 260
H2O2 showed a detrimental effect on US-driven CIP degradation in comparison to the 261
performance of the ultrasound-driven process alone. 262
As previously stated here, despite the generation of hydroxyl radicals by its own sonolysis,
263
the hydrogen peroxide can act as a hydroxyl radical scavenger, producing the much less 264
reactive hydroperoxyl radicals (Eq. 8). The hydroxyl radicals in excess will be recombined 265
forming water or hydrogen peroxide (Eqs. 9-11). At pH 3, the addition of different 266
stoichiometric amounts of H2O2 does not improve the CIP sonolysis process. Several authors 267
reported this negative influence of H2O2 in organic pollutant sonodegradation. [36, 52] 268
Manousaki et al. [52] studied the degradation of sodium dodecyl benzene sulfonate in water
269
by ultrasonic irradiation at 20 and 80 kHz and found a detrimental effect of hydrogen
270
peroxide on the substrate degradation, besides the above-mentioned scavenging effect: the
271
pollutant removal occurred mainly in the interfacial region, and thus the beneficial effect of
272
extra hydroxyl radicals (Eq. 7) would be of marginal importance, even close to the cavitation
273
bubbles, due to the thermal decomposition of hydrogen peroxide molecules to oxygen and
274
water. Nevertheless, other authors claim that the addition of H2O2 has a positive effect on the
275
degradation of various organic compounds. [30, 32, 48, 59-61] The presence of an optimal amount 276
of H2O2 for the sonochemical degradation of the target compounds can occur, but it is 277
difficult to determine the optimal concentration for each compound. [59, 60, 62] It is because the 278
experimental conditions varied widely and a very limited range of H2O2 concentrations was 279
used in most previous studies. [61] Under our experimental conditions, this optimum amount of 280
H2O2 was not found. 281
Optimization of the sono-Fenton degradation of CIP 282
The combination of ultrasound with Fenton reagent is an alternative way to increase the 283
generation of free radicals in the ultrasonic system. As previously said, H2O2 can be generated 284
during ultrasonic treatment thanks to the recombination of hydroxyl radicals. Therefore, the 285
addition of an iron salt can initiate the Fenton reaction during the sonolysis under acidic 286
conditions. This coupling of ultrasonic irradiation and Fenton oxidation (i) promotes faster 287
pollutant conversion/mineralization due to a higher generation of hydroxyl radicals according 288
to Equations 6 and 13 [63]; (ii) improve mixing and contact between hydroxyl radicals and 289
pollutant [46, 64] , (iii) and enhanced regeneration of ferrous ions according to Equation 14 [65], 290
in comparison with an uneasy regeneration of Fe2+ by conventional homogeneous Fenton 291
reaction according to Equations 15 and 16. 292 Fe2+ + H2O2 → Fe3+ + OH- + HO• (13) 293 Fe-OOH2+ + ))) → Fe2+ + HOO• (14) 294 Fe3+ + H2O2 ↔ Fe-OOH2+ + H+ (15) 295 Fe-OOH2+ → HOO• + Fe2+ (16) 296
Table 3 shows the results of ultrasonic degradation of CIP (initial concentration 100 mg L-1, 297
F=580 kHz, P = 30.6 W, T = 30°C, pH= 3) at different concentrations of H2O2 and Fe2+ 298
corresponding to a H2O2/Fe2+ ratio between 2 and 10, following a 32 factorial experimental 299
design (rows 3-11). Sono-Fenton resulted, in all cases, in high CIP degradation (ten times 300
more) within the first 15 min of treatment (higher than 89%) compared to the results obtained 301
during sonolysis alone (row 1, 9.3% of degradation at 15 minutes and 17.4% of 302
mineralization in one hour) and those obtained with the addition of hydrogen peroxide 303
without Fe2+ (row 2, 9.5% of degradation at 15 minutes and 24.4% of mineralization in one 304
hour). 305
An additional ultrasonic experiment was carried out, to evaluate the effect of adding only 306
iron, using 2.37 mM of Fe2+ without additional amount of hydrogen peroxide. In this 307
condition the CIP degradation at 15 minutes was 18.5%, higher than the value obtained in 308
single sonication experiment but much lower than in the case of hydrogen peroxide was also 309
added together with ferrous salt (98.4%, row 7 table 3). This result can be explained by the 310
formation of hydrogen peroxide during sonication in water. However, it is known that the 311
amount of generated H2O2 is not significant comparing with those added as Fenton reagent. 312
[66, 67] 313
The mineralization for the sono-Fenton process was also higher than for ultrasonic oxidation 314
alone (row 1 in Table 3) and for sonolysis with hydrogen peroxide (rows 2 in Table 3). The 315
best mineralization was obtained when 14.2 mM of H2O2 and H2O2/Fe2+ ratio 6 (row 7 in 316
Table 3) were used. An additional experiment was carried out at the same conditions of row 7 317
(Table 3) without ultrasound (Fenton reaction). It can be seen, that at 15 min the degradation 318
of the sono-Fenton process was practically the same for both processes. With regard to the 319
mineralization, sono-Fenton gave better results than the Fenton process: for example at 60 320
min, the mineralization rate was 30 % higher for sono-Fenton than for Fenton alone (62 vs. 321
30.3). This result shows that ultrasonic radiation combined with Fenton reagent enhances the 322
mineralization of aqueous solution. 323
A mathematical model describing the mineralization behavior at 60 min as a function of H2O2 324
concentration and H2O2/Fe2+ concentration ratio is proposed as follows: 325 min = −13.2 + 3.12c H#O# + 13.86 % H% Fe#O#&# − +3c H#O# # + 0.007c H#O# ∗c Hc Fe#O#&# − +. 'c Hc Fe#O#&# ( # (17)
The above model describes adequately the experiment with R2 = 81.52%, a standard error of 326
estimation of 8.1 % and a mean absolute error of 3.9 %. The regression and variance analysis 327
for the model are shown in Table 3S (supporting information). Figure 6 shows the response 328
surface model of mineralization, where an optimum of mineralization of 56.78% is observed 329
for hydrogen peroxide concentration of 18.5 mM (stoichiometry of 1.3) and H2O2/Fe2+ ratio 330
of 6. This value of mineralization is higher than those obtained by several AOPs, O3 (30.5%), 331
UV (18%), UV/H2O2 (42%) and is of the same order of magnitude as UV/H2O2/Fe2+ (63.3%) 332
reported by Bobu and colaborators. [68] 333
Influence of a real waste water matrix on CIP removal 334
The water treatment by AOPs can be affected by the presence of inorganic and organic 335
components in the water matrix, significantly slowing the degradation of the target pollutants. 336
[70-71] Several authors have reported the role of organic components on the sonochemical 337
degradation of persistent contaminants that appears to be a complex task which need to be 338
experimentaly verified for different systems. [7, 72-77] On the one hand, the presence of an 339
organic matrix reduces the sonochemical degradation of target contaminants. [7, 72-74] On the 340
other hand, the presence of organic matter did not affect the sonochemical degradation of 341
methyl tert-butyl ether, [76] perfluorooctane sulfonate and perfluorooctanoate. [77] In order to 342
investigate the efficiency of the sono-Fenton degradation of CIP in real application, some 343
experiments with a real wastewater matrix (WW) were performed. In the case of Fenton 344
chemistry, the presence of organic and inorganic compounds in WW may hamper this 345
reaction by scavenging hydroxyl radicals and/or forming iron complex. [7, 78] A positive effect 346
has also been reported, phenolic compounds that WW may contain could reduce ferric ion to 347
ferrous ion and thus enhance Fenton reaction. [76] 348
Table 4 shows the physicochemical characteristics of the WW influent from the WWTP 349
“María del Carmen” before (WW-01) and after addition of CIP at 100 mgL-1 and pH 350
adjustment to 3 (WW-02). As CIP is the major organic compound in this matrix, biochemical 351
oxygen demand (BOD5), chemical oxygen demand (COD) and TOC concentration increased 352
when it was added. However, the BOD5/COD ratio decreased from 0.33 to 0.21 showing a 353
decrease in the biodegradability of CIP-dopped matrix WW-02. De Bel et al. [35] 354
experimentally demonstrated the low degradability of the 15 mgL-1 CIP aqueous solution with 355
BOD5/COD ratio of only 0.06. The suspended solid concentration in WW-02 also decreased, 356
due to the solubility of some solids with pH decreasing. The real matrix was treated by the 357
sono-Fenton process. Two different series of experiments were carried out: (i) under the best 358
conditions obtained during CIP degradation in aqueous solution (14.2 mM H2O2 and 359
H2O2/Fe2+ ratio of 6), (ii) recalculating the amount of hydrogen peroxide to be added, taking 360
into account the increase in COD to keep the same H2O2/COD ratio as in the study with the 361
synthetic solution (31.8 mM H2O2 and H2O2/Fe2+ ratio of 6). 362
Figure 7 shows the CIP degradation and mineralization ([CIP]o: 100 mg L-1, T: 30°C, pHo=3) 363
by the sono-Fenton process in a real WW matrix for both series of experiments. The 364
degradation and mineralization of CIP are higher when a higher concentration of hydrogen 365
peroxide is used. Nevertheless, even under this condition in a real matrix WW-02, 366
degradation of both CIP and TOC by sono-Fenton is significantly hampered in WW. The 367
degradation of CIP at 15 min and mineralization at 60 min are less important in real 368
conditions (13.6% and 18.9%), than for synthetic water. This result shows the inhibition of 369
CIP degradation and mineralization in a real WW matrix, as reported before for the sonolysis 370
of CIP and other persistent pollutants in different organic matrices. [7, 70-72] 371
Although the sonochemical degradation of CIP is less efficient for the real matrix, the 372
pollutant degradation and mineralization is still quite adequate: 97.1% of CIP degradation is 373
reached after 60 min (Fig. 7), which practically guarantees the complete elimination of the 374
antibiotic from WW. This is an important environmental issue in the fight against antibiotic 375
resistance in natural systems. On the other hand, in the best cases, the BOD5 removal was 376
14.2% (Table 4), the COD and TOC removal were higher than 50% and the BOD5/COD ratio 377
increased from 0.21 to 0.36, showing an increase in biodegradability. [35] This result is very 378
promising because it opens the perspective of using ultrasound and sono-Fenton as a 379
pretreatment of biological process in a WWTP for eliminating persistent organic pollutants. 380
Conclusion 381
High frequency ultrasound guarantees the degradation of the antibiotic CIP following pseudo 382
first-order reaction kinetics. It was verified that the ultrasonic power had a greater influence 383
on CIP degradation than the frequency, at the values studied, in this field of investigation. 384
Higher CIP percent removals and removal rates were observed for the lowest operating 385
frequency studied (580 kHz) and higher ultrasonic power. Practically the total degradation of 386
pharmaceutical was obtained in 15 min for all concentrations of hydrogen peroxide and 387
ferrum salt studied. 388
The addition of hydrogen peroxide, as a radical promoter, does not markedly improve the 389
sonolysis process in the range of operating studied conditions. In contrast, CIP degradation 390
and mineralization are highly improved in the case of the US/Fenton system. The optimal 391
conditions of the sono-Fenton process are 14.2 mM H2O2 and H2O2/Fe2+ ratio of 6, ensuring 392
at least a 60%. mineralization rate. The degradation of both CIP and TOC by sono-Fenton 393
was significantly hampered in a real waste water matrix. However, the pollutant degradation, 394
COD and TOC removals can be considered as efficient in the real matrix, with an increase in 395
the biodegradability of the wastewater. These results show that sono-Fenton oxidation can be 396
considered as a promising pretreatment process for wastewater containing pharmaceutical 397
compounds. 398
Acknowledgements 399
This research was supported by the project TATARCOP of Instituto Superior de Tecnologías
400
y Ciencias Aplicadas (InSTEC)-University of Havana. The authors would also like to express 401
their gratitude to the Colaboration Services of the French Embassy in Cuba for the financial 402
support and to the Laboratory of Environmental Analysis of InSTEC-University of Havana 403
for the analytical support of wastewaters. 404
References 405
406
[1] Rivera-Utrilla. J.; Sánchez-Polo, M.; Ferro-García, M. Á.; Prados-Joya, G.; Ocampo-407
Pérez, R. Pharmaceuticals as emerging contaminants and their removal from water. A 408
review. Chemosphere. 2013, 93, 1268-1287. 409
[2]. Padhye, L. P.; Yao, H.; Kung'u, Francis T.; Huang, Ch.H.; Year-long evaluation on 410
the occurrence and fate of pharmaceuticals, personal care products, and endocrine 411
disrupting chemicals in an urban drinking water treatment plant. Water Res. 2014, 51, 412
266-276. 413
[3]. Andreu, V.; Gimeno García, E.; Pascual, J. A.; Vazquez-Roig, P.; Picó, Y. Presence of 414
pharmaceuticals and heavy metals in the waters of a Mediterranean coastal wetland: 415
Potential interactions and the influence of the environment. Sci. Total Environ. 2016, 416
540, 278-286. 417
[4] Alves Monteiro, M.; Ferraz Spisso, B.; dos Santos, Rodrigues Martins Pastor J.; da 418
Pinto Costa, R.; Gomes Ferreira, R.; Ulberg Pereira, M.; da Silva Miranda, T.; de 419
Rodrigues Geraldino de Andrade, B.; d’Avila, L. A. Occurrence of antimicrobials in 420
river water samples from rural region of the State of Rio de Janeiro, Brazil. J. Environ. 421
Protect. 2016, 7, 230-241. 422
[5] Lloret, L.; Eibes, G.; Lú Chau, T. A.; Moreira, M. T.; Feijoo, G.; Lema, J. M. 423
Laccase-catalyzed degradation of anti-inflammatories and estrogens. Biochem. Eng. J. 424
2010, 51, 124-131. 425
[6] Santos, L. H.; Araújo, A. N.; Fachini, A.; Pena, A.; Delerue Matos, C.; Montenegro, 426
M. C. Ecotoxicological aspects related to the presence of pharmaceuticals in the 427
aquatic environment. J. Hazard. Mater. 2010,175, 45-95. 428
[7] Ziylan, A.; Ince N. H. The occurrence and fate of anti-inflammatory and analgesic 429
pharmaceuticals in sewage and fresh water: treatability by conventional and non-430
conventional processes. J. Hazard. Mater. 2011, 187, 24-36. 431
[8] Taylor, D.; Senac, T. Human pharmaceutical products in the environment–The 432
“problem” in perspective. Chemosphere. 2014, 115, 95-99. 433
[9] Pereira, A. M.; Silva, L. J. G.; Meisel, L. M.; Lino, C. M.; Pena, A. Environmental 434
impact of pharmaceuticals from Portuguese wastewaters: geographical and seasonal 435
occurrence, removal and risk assessment. Environ. Res. 2015, 136, 108-119. 436
[10] Homem, V.; Santos, L. Degradation and removal methods of antibiotics from aqueous 437
matrices–a review. J. Environ. Manage. 2011, 92, 2304-2347. 438
[11] Xiao, R.; Heb, Z.; Diaz, D.; Yang, G.; Weavers, L. Sonochemical degradation of 439
ciprofloxacin and ibuprofen in the presence of matrix organic compounds. Ultrason. 440
Sonochem.. 2014, 21, 428-435. 441
[12] Zuccato, E.; Castiglioni, S.; Fanelli, R.; Bagnati, R.; Reitano, G.; Calamari, D. Risks 442
related to the discharge of pharmaceuticals in the environment: further research is 443
needed. Pharmaceuticals in the Environment; Springer, 2004, 431-437. 444
[13] Quesada Peñate I.; Jáuregui Haza U. J.; Wilhelm A. M.; Delmas H. Contaminación de 445
las aguas con productos farmacéuticos. Estrategias para enfrentar la problemática. 446
CENIC Ciencias Biológicas. 2009, 40, 173-179. 447
[14] Kümmerer, K. Significance of antibiotics in the environment. J. Antimicrob. 448
Chemother. 2003, 52, 5-7. 449
[15] Graham, D. W.; Olivares Rieumont, S.; Knapp, Ch. W.; Lima, L.; Werner, D.; Bowen, 450
E. Antibiotic resistance gene abundances associated with waste discharges to the 451
Almendares River near Havana, Cuba. Environ. Sci. Technol. 2010, 45, 418-424. 452
[16] Knapp, C. W.; Lima, L.; Olivares Rieumont, S.; Bowen, E.; Werner, D.; Graham, D. 453
W. Seasonal variations in antibiotic resistance gene transport in the Almendares River, 454
Havana, Cuba. Frontiers in microbiology. 2012, 3, 396. 455
[17] Martínez, J. L. Antibiotics and antibiotic resistance genes in natural environments. 456
Science. 2008, 321, 365-367. 457
[18] Larsson, D. J. Antibiotics in the environment. Upsala journal of medical sciences, 458
2014, 119, 108-112. 459
[19] Li, X.; Wang, W.; Dou, J.; Gao, J.; Chen, S.; Quan, X.; Zhao, H. Dynamic adsorption 460
of ciprofloxacin on carbon nanofibers: Quantitative measurement by in situ 461
fluorescence. J. Water Process Eng. 2016, 9, 14-20. 462
[20] Ingerslev, F.; Halling‐Sørensen, B. Biodegradability properties of sulfonamides in 463
activated sludge. Environ. Toxicol. Chem. 2000, 19, 2467-2473. 464
[22] Hughes, S. R.; Kay. P.; Brown, L. E. Global synthesis and critical evaluation of 465
pharmaceutical data sets collected from river systems. Environ. Sci. Technol. 2012, 466
47, 661-677. 467
[23] Li, W.; Nanaboina, V.; Zhou, Q.; Korshin, G. V. Effects of Fenton treatment on the 468
properties of effluent organic matter and their relationships with the degradation of 469
pharmaceuticals and personal care products. Water Res. 2012, 46, 403-412. 470
[24] Mason, T. Industrial sonochemistry: potential and practicality. Ultrasonics. 1992, 30, 471
192-196. 472
[25] Kotronarou, A.; Mills, G.; Hoffmann, M. R. Decomposition of parathion in aqueous 473
solution by ultrasonic irradiation. Environ. Sci. Technol. 1992, 26, 1460-1462. 474
[26] Koda, S.; Kimura, T.; Kondo, T.; Mitome, H. A standard method to calibrate
475
sonochemical efficiency of an individual reaction system. Ultrason. Sonochem. 2003, 10,
476
149-156.[27] Gogate, P. R.; Sutkar,V. S.; Pandit, A. B. Sonochemical reactors: important 477
design and scale up considerations with a special emphasis on heterogeneous systems. Chem. 478
Eng. J. 2011, 166, 1066-1082. 479
[28] Suslick, K. S. Sonochemistry. Science. 1990, 247, 1439-1446. 480
[29] Mason, T.; Lorimer, J.; Bates, D. Quantifying sonochemistry: casting some light on a 481
‘black art’. Ultrasonics. 1992, 30, 40-42 482
[30] Quesada Peñate, I.; Julcour Lebigue C.; Jáuregui Haza U. J.; Wilhelm, A. M.; Delmas, 483
H. Sonolysis of levodopa and paracetamol in aqueous solutions. Ultrason. Sonochem. 484
2009, 16, 610-616. 485
[31] Fick, J.; Söderström, H.; Lindberg, R. H.; Phan, Ch.; Tysklind, M.; Larsson, D. G. 486
Contamination of surface, ground, and drinking water from pharmaceutical 487
production. Environ. Toxicol. Chem. 2009, 28, 2522-2527. 488
[32] Cruz González, G.; González Labrada, K.; Milián Rodríguez, Y.; Quesada Peñate, I.; 489
Colín Luna, J. A.; Ramírez Muñoz, J.; Jáuregui Haza, U. J. Enhancement of 490
paracetamol degradation by sono-Fenton process. Int. J. Chem. Mat. Environ. Res. 491
2015, 2, 37-45. 492
[33] De Bel, E.; Janssen, C.; De Smet, S.; Van Langenhove, H.; Dewulf, J. Sonolysis of 493
ciprofloxacin in aqueous solution: Influence of operational parameters. Ultrason. 494
Sonochem.. 2011, 18, 184-189. 495
[34]] Sutar, R. S.; Rathod, V. K. Ultrasound assisted Laccase catalyzed degradation of 496
Ciprofloxacin hydrochloride. J. Ind. and Eng. Chem. 2015, 31, 276-282. 497
[35] De Bel, E.; Dewulf, J.; De Witte, B.; Van Langenhove, H.; Janssen, C. Influence of 498
pH on the sonolysis of ciprofloxacin: biodegradability, ecotoxicity and antibiotic 499
activity of its degradation products. Chemosphere. 2009, 77, 291-295. 500
[36] Lastre-Acosta, A. M.; Cruz González, G.; Nuevas Paz, L.; Jáuregui Haza, U. J.; 501
Teixeira Silva Costa, A. C. Ultrasonic degradation of sulfadiazine in aqueous 502
solutions. Environ. Sci. and Pollut. Res. 2015, 22, 918-925. 503
[37] Cleceri, L.; Greenberg, A.; Eaton, A. Standard methods for the examination of water 504
and wastewater. American Public Health Association, American Water Works 505
Association, and Water Environment Association, Washington, DC, USA, 1998. 506
[38] Petrier, C.; David, B.; Laguian, S. Unexpected frequency effects on the rate of 507
oxidative processes induced by ultrasound. J. Amer. Chem. Soc. 1992, 114, 3148-508
3150. 509
[39] Petrier, C.; David, B.; Laguian, S. Ultrasonic degradation at 20 kHz and 500 kHz of 510
atrazine and pentachlorophenol in aqueous solution: Preliminary results. 511
Chemosphere. 1996, 32, 1709-1718. 512
[40] Pétrier, C.; Francony, A. Ultrasonic waste-water treatment: incidence of ultrasonic 513
frequency on the rate of phenol and carbon tetrachloride degradation. Ultrason. 514
Sonochem. 1997, 4, 295-300. 515
[41] Weavers, L. K.; Malmstadt, N.; Hoffmann, M. R. Kinetics and mechanism of 516
pentachlorophenol degradation by sonication, ozonation, and sonolytic ozonation. 517
Environ. Sci. Technol. 2000, 34, 1280-1285. 518
[42] Golash, N.; Gogate, P. R. Degradation of dichlorvos containing wastewaters using 519
sonochemical reactors. Ultrason. Sonochem. 2012, 19, 1051-1060. 520
[43] Wu, T. Y.; Guo, N.; Teh, C. Y.; Hay, J. X. W. Advances in ultrasound technology for 521
environmental remediation; Springer Science & Business Media, 2012, 95-104. 522
[44] Guo, W.; Shi, Y.; Wang, H.; Yang, H.; Zhang, G. Intensification of sonochemical 523
degradation of antibiotics levofloxacin using carbon tetrachloride. Ultrason. 524
Sonochem., 2010. 17, 680-684. 525
[45] Takács Novák, K.; Józan, M.; Hermecz, I.; Szász, G. Lipophilicity of antibacterial 526
fluoroquinolones. Int. J. of Pharmaceutics. 1992, 79, 89-96. 527
[46] Bagal, M. V.; Gogate, P. R. Wastewater treatment using hybrid treatment schemes 528
based on cavitation and Fenton chemistry: a review. Ultrason. Sonochem. 2014, 21, 1-529
14. 530
[47] Ou, H.; Ye, J.; Ma, S.; Wei, C.; Gao, N.; He, J. Degradation of ciprofloxacin by UV 531
and UV/H2O2 via multiple-wavelength ultraviolet light-emitting diodes: Effectiveness, 532
intermediates and antibacterial activity. Chem. Eng. J. 2016, 289, 391-401. 533
[48] Wei, H.; Ye, J.; Ma, S.; Wei, Cha.; Gao, N.; He, J. Intensification of levofloxacin 534
sono-degradation in a US/H2O2 system with Fe3O4 magnetic nanoparticles. Chinese 535
Chem. Eng. J. 2015, 23, 296-302. 536
[49] Gad-Allah, T. A.; Ali, M. E.; Badawy, M. I. Photocatalytic oxidation of ciprofloxacin 537
under simulated sunlight. J. Hazard. Mater. 2011, 186, 751-755. 538
[50] Hamdaoui, O.; Naffrechoux, E. Sonochemical and photosonochemical degradation of 539
4-chlorophenol in aqueous media. Ultrason. Sonochem. 2008, 15, 981-987. 540
[51] Velegraki, T.; Poulios, I.; Charalabaki, M.; Kalogerakis,N.; Samaras, P.; Mantzavinos, 541
D. Photocatalytic and sonolytic oxidation of acid orange 7 in aqueous solution. Appl. 542
Catal., B: Environ. 2006, 62, 159-168. 543
[52] Manousaki, E.; Psillakis, E.; Kalogerakis, N.; Mantzavinos, D. Degradation of sodium 544
dodecylbenzene sulfonate in water by ultrasonic irradiation. Water Res. 2004, 38, 545
3751-3759. 546
[53] Mohajerani, M.; Mehrvar, M.; Ein-Mozaffari, F. Recent achievements in combination 547
of ultrasonolysis and other advanced oxidation processes for wastewater treatment. 548
Int. J. Chem. Reactor Eng. 2010, 8, 5367-5382. 549
[54] Gogate, P. R. Treatment of wastewater streams containing phenolic compounds using 550
hybrid techniques based on cavitation: a review of the current status and the way 551
forward. Ultrason. Sonochem. 2008, 15, 1-15. 552
[55] Chakma, S.; Moholkar, V. S. Investigations in synergism of hybrid advanced 553
oxidation processes with combinations of sonolysis+ fenton process+ UV for 554
degradation of bisphenol A. Ind. Eng. Chem. Res. 2014, 53, 6855-6865. 555
[56] Rayaroth, M. P.; Aravind, U. K.; Aravindakumar, C. T. Degradation of 556
pharmaceuticals by ultrasound-based advanced oxidation process. Environ. Chem. 557
Letters. 2016, 14, 259-290. 558
[57] Méndez Arriaga, F.; Torres Palma, R. A.; Pétrier, C.; Esplugas, S.; Gimenez, J.; 559
Pulgarin, C. Ultrasonic treatment of water contaminated with ibuprofen. Water Res. 560
2008, 42, 4243-4248. 561
[58] Neyens, E.; Baeyens, J. A review of classic Fenton’s peroxidation as an advanced 562
oxidation technique. J. Hazard. Mater. 2003, 98, 33-50. 563
[59] Mehrdad, A.; Hashemzadeh, R. Ultrasonic degradation of Rhodamine B in the 564
presence of hydrogen peroxide and some metal oxide. Ultrason. Sonochem.. 2010, 17, 565
168-172. 566
[60] Bremner, D. H.; Molina, R.; Martínez, F.; Melero, J. A.; Segura, Y. Degradation of 567
phenolic aqueous solutions by high frequency sono-Fenton systems (US–Fe2O3 /SBA-568
15–H2O2). Appl. Catal., B: Environ. 2009, 90, 380-388. 569
[61] Lim, M.; Son, Y.; Khim, J. The effects of hydrogen peroxide on the sonochemical 570
degradation of phenol and bisphenol A. Ultrason. Sonochem. 2014, 21, 1976-1981. 571
[62] Ku, Y.; Tu, Y. H.; Ma, Ch. M. Effect of hydrogen peroxide on the decomposition of 572
monochlorophenols by sonolysis in aqueous solution. Water Res. 2005. 39, 1093-573
1098. 574
[63] Neppolian, B., Jung, H.; Choi, H.; Lee, J. H.; Kang, J. W. Sonolytic degradation of 575
methyl tert-butyl ether: the role of coupled Fenton process and persulphate ion. Water 576
Res. 2002, 36, 4699-4708. 577
[64] Liang, J., Komarov, S.; Hayashi, N.; Kasai, E. Improvement in sonochemical 578
degradation of 4-chlorophenol by combined use of Fenton-like reagents. Ultrason. 579
Sonochem. 2007, 14, 201-207. 580
[65] Lin, J. G.; Ma, Y. S. Oxidation of 2-chlorophenol in water by ultrasound/Fenton 581
method. J. Environ. Eng. 2000, 126, 130-137. 582
[66] Weissler A. Formation of hydrogen peroxide by ultrasonic waves: free radicals. 1959, 583
81, 1077-1081. 584
[67] Jiang, Y.; Petrier C.; Waite, T . D. Kinetics and mechanisms of ultrasonic degradation of 585
volatile chlorinated aromatics in aqueous solutions. Ultrason. Sonochem. 2002, 9, 586
317–323. 587
[68] Bobu, M.; Yediler, A.; Siminiceanu, I.; Zhang, F.; Schulte Hostede, S. Comparison of 588
different advanced oxidation processes for the degradation of two fluoroquinolone 589
antibiotics in aqueous solutions. J. Environ. Sci. Health, Part A. 2013, 48, 251-262. 590
[69] Snyder, S. A.; Westerhoff, P.; Yoon, Y.; Sedlak, D. L. Pharmaceuticals, personal care 591
products, and endocrine disruptors in water: implications for the water industry. 592
Environ. Eng. Sci. 2003, 20, 449-469. 593
[70] Westerhoff, P.; Aiken, G.; Amy, G.; Debroux, J. Relationships between the structure 594
of natural organic matter and its reactivity towards molecular ozone and hydroxyl 595
radicals. Water Res. 1999, 33, 2265-2276. 596
[71] Huber, M. M.; Gobel, A.; Joss, A.; Hermann, N.; Loffler, D.; McArdell, Ch. S.; Ried, 597
A.; Siegrist, H.; Ternes, T. A. von Gunten, U. Oxidation of pharmaceuticals during 598
ozonation of municipal wastewater effluents: a pilot study. Environ. Sci. Technol. 599
2005, 39, 4290-4299. 600
[72] Taylor, E.; Cook, B.; Tarr, M. Dissolved organic matter inhibition of sonochemical 601
degradation of aqueous polycyclic aromatic hydrocarbons. Ultrason. Sonochem., 602
1999, 6, 175-183. 603
[73] Laughrey, Z.; Bear, E.; Jones, R.; Tarr, M. A. Aqueous sonolytic decomposition of 604
polycyclic aromatic hydrocarbons in the presence of additional dissolved species. 605
Ultrason. Sonochem.. 2001, 8, 353-357. 606
[74] Lu, Y.; Weavers, L. K. Sonochemical desorption and destruction of 4-chlorobiphenyl 607
from synthetic sediments. Environ. Sci. Technol. 2002, 36, 232-237. 608
[75] Goskonda, S.; Catallo, W. J.; Junk, T. Sonochemical degradation of aromatic organic 609
pollutants. Waste Manage. 2002, 22, 351-356. 610
[76] Cheng, J.; Vecitis, Ch. D.; Park, H.; Mader, B. T. Hoffmann, M. R. Sonochemical 611
degradation of perfluorooctane sulfonate (PFOS) and perfluorooctanoate (PFOA) in 612
landfill groundwater: environmental matrix effects. Environ. Sci. Technol. 2008, 42, 613
8057-8063. 614
[77] Kang, J. W.; Hung, H. M.; Lin, A.; Hoffmann, M. R. Sonolytic destruction of methyl 615
tert-butyl ether by ultrasonic irradiation: the role of O3, H2O2, frequency, and power 616
density. Environ. Sci. Technol. 1999, 33, 3199-3205. 617
[78] Tokumura, M.; Sugawara, A.; Raknuzzaman, M.; Habibullah Al Mamun, Md.; 618
Masunaga, S. Comprehensive study on effects of water matrices on removal of 619
pharmaceuticals by three different kinds of advanced oxidation processes. 620
Chemosphere. 2016, 159, 317-325. 621
List of Figure Captions 623
Figure 1. Molecular structure of CIP 624
Figure 2. Experimental set-up: 1 –ultrasonic generator, 2 – transducer, 3 – glass reactor, 4 – 625
stirrer, 5 –thermostat, 6 – temperature measurement 626
Figure 3. Influence of ultrasonic frequency and actual ultrasonic power on CIP degradation 627
and mineralization after 120 min. Open markers with solid line represent degradation and 628
filled markers with dash line represent mineralization. Experimental conditions: ([CIP]o: 100 629
mg L-1, T: 30 °C, pHo=3) 630
Figure 4. Response surface as a function of ultrasonic power. Degradation (a) and 631
mineralization (b) of CIP 632
Figure 5. Degradation and mineralization trend in the US/H2O2 process (F = 580 kHz y P = 633
21.7 W, pH = 3, t = 60 min) 634
Figure 6. Response surface as a function concentration of [H2O2] and the relation of 635
c(H2O2)/c(Fe2) 636
Figure 7. CIP degradation and mineralization by sono-Fenton process in a real WW matrix. 637
Open markers with solid line represent degradation and filled markers with dash line mean 638
mineralization for two different H2O2 concentrations: 14.2 mM (○/●) and 31.8 mM (□/■). 639
Experimental conditions: ([CIP]o: 100 mg L-1, T: 30 °C, pHo=3) 640
Figures 642 643 Fig 1. 644 645 Fig 2. 646 647 Fig. 3. 648 0 5 10 15 20 25 0 10 20 30 40 50 0 10 20 30 40 M in e ra li za ti o n , % D e g ra d a ti o n , %
Actual ultrasonic power, W
580 862 580 862
649 (a) (b) 650 651 Fig. 4 652 653 654 Fig 5. 655 656 35,8 31 36,5 32,4 32,3 31,2 22,6 16,6 24,4 17,5 16,9 14,4 0 10 20 30 40 50 0 0,5 1 5 10 15 (%) H2O2 Stoichiometry Degradation Mineralization
31 Fig 6. 657 658 Fig 7. 659 660
32 Tables
661
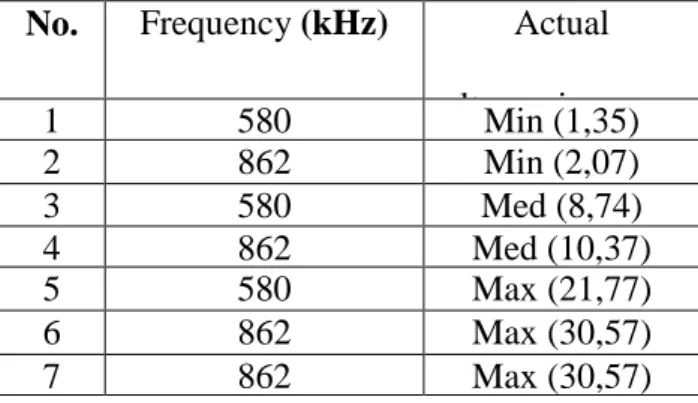
Table 1. Experimental design 2*3 for the evaluation of ultrasonic frequency and power 662
No. Frequency (kHz) Actual ultrasonic power 1 580 Min (1,35) 2 862 Min (2,07) 3 580 Med (8,74) 4 862 Med (10,37) 5 580 Max (21,77) 6 862 Max (30,57) 7 862 Max (30,57) 663
Table 2. Degradation pseudo first-order rate constant for three different ultrasonic power at 664
frequency 580-862 kHz ([CIP]o: 100 mg L-1, T: 30 °C, pHo=3) 665
666
Frequency (kHz) Pmin (W) (value) Pmed (W) (value) Pmax (W) (value)
580 0.0039 (1.35) 0.0045 (8.74) 0.0066 (21.77) 862 0.0032 (2.07) 0.0040 (10.37) 0.0045 (30.57) 667 668 669 670 671 672 673 674 675
33 Table 3. Effect of Fe2+/H
2O2 on CIP sonochemical degradation (t=15 min) and mineralization 676
(t=60 min), (F=580 kHz, P = 30.6 W, [CIP]0= 100 mg L-1, T = 30°C, pHo= 3). *Fenton 677
reaction without ultrasound 678 Row c(H2O2) mM c(H2O2)/c(Fe2+) Degradation (%), 15 min Mineralization (%), 60 min 1 0 - 9.3 17.4 2 14.2 - 9.5 24.4 3 7.1 10 92.3 31.0 4 7.1 6 99.0 36.9 5 7.1 2 93.4 31.6 6 14.2 10 89.7 31.5 7 14.2 6 98.4±1.4 96.4* 62.0±2.3 30.3* 8 14.2 2 92.4 34.5 9 28.4 10 95.9 28.5 10 28.4 6 99.8 50.4 11 28.4 2 98.5 28.5 679 680
34 Table 4. Physico-chemical characteristics of WW matrix before and after treatment by sono-681
Fenton process ([CIP]o: 100 mg L-1, T: 30 °C, pHo=3) 682
Parameter Unit WW-01a WW-02a After sono-Fentonb
Temperature ºC 26 26 30 30 pH - 6.7 3 3 3 H2O2 mM - - 14.2 31.8 H2O2/Fe2+ - - - 6 6 BOD5 mg O2 L-1 66 ± 1 76 ± 5 72 ± 3 65 ± 4 COD mg O2 L-1 203 ± 43 368 ± 18 230 ± 21 180 ± 14 TOC mg C L-1 74 ± 3 131 ± 1 85 ± 4 66 ± 4 SS mL L-1 2.5 ± 0.1 2.3± 0.2 0 0
Conductivity µS cm-1 1213 n.a. n.a. n.a.
Floating matter - present present non non
BOD5/COD - 0.33 0.21 0.31 0.36
BOD5 removal % - - 4.8* 14.2*
COD removal % - - 37.4* 51.1*
TOC removal % - - 34.6* 50.3*
aAverage of three sampling results; bAverage of two experiments; n.a: non available;
*Referred to WW-02 683
35 Supporting informat
685 686
Table 1S. Regression and variance analysis for equation 4 (Degradation as function of 687
ultrasonic frequency and power). 688
689 690
Regression analysis
Parameter Estimate Error t-statistic p-value
Constant -6.032 4.82043 -1.251 0.429 F 0.021 0.007 3.08 0.2 F * P -0.004 0.0005 -6.864 0.092 P 2.612 0.327 7.989 0.079 P * P 0.039 0.009 4.284 0.146 Analysis of variance
Source Sum of squares Mean square F-ratio p-value
Model 744.985 186.246 93.91 0.076
Residual 1.98333 1.98333
Total correlation 746.969
R-squared = 99.73 % Standard error of estimation = 1.408 Mean absolute error = 0.515
691 692
36 Table 2S. Regression and variance analysis for equation 5 (Mineralization as function of 693
ultrasonic frequency and power). 694
695
Regression analysis
Parameter Estimate Error t-statistic p-value
Constant -3.249 4.91 -0.662 0.628 F 0.007 0.007 1.0 0.5 F * P -0.002 0.0005 -4.137 0.151 P 1.949 0.333 5.852 0.108 P * P 0.017 0.009 1.831 0.318 Analysis of variance
Source Sum of squares Mean square F-ratio p-value
Model 402.0 100.5 48.85 0.0105
Residual 2.06 2.06
Total correlation 404.06
R-squared = 99.49 % Standard error of estimation = 1.434 Mean absolute error = 0.524
696 697 698 699 700 701
37 Table 3S. Regression and variance analysis for equation 17 (Mineralization as function of 702
hydrogen peroxide concentration and H2O2/Fe2+ concentration ratio for sono-Fenton reaction). 703
704
Regression analysis
Parameter Estimate Error t-statistic p-value
Constant -13.2 20.8 -0.63 0.571 H2O2 3.12 2.19 1.42 0.25 H2O2/Fe+2 13.86 4.61 3.01 0.057 H2O2* H2O2 -0.09 0.06 -1.49 0.233 H2O2* H2O2/Fe+2 0.007 0.09 0.07 0.946 H2O2/Fe+2* H2O2/Fe+2 -1.18 0.35 -3.31 0.045 Analysis of variance
Source Sum of squares Mean square F-ratio p-value
Model 856.2 171.2 12.65 0.102
Residual 194.1 64.7
Total correlation 1050.3
R-squared = 81.52 % Standard error of estimation = 8.14 Mean absolute error = 3.92
705 706 707