Publisher’s version / Version de l'éditeur:
Ice Research for a Sustainable Environment, the 21st IAHR International Symposium on Ice, pp. 985-997, 2012-06-15
READ THESE TERMS AND CONDITIONS CAREFULLY BEFORE USING THIS WEBSITE. https://nrc-publications.canada.ca/eng/copyright
Vous avez des questions? Nous pouvons vous aider. Pour communiquer directement avec un auteur, consultez la
première page de la revue dans laquelle son article a été publié afin de trouver ses coordonnées. Si vous n’arrivez pas à les repérer, communiquez avec nous à PublicationsArchive-ArchivesPublications@nrc-cnrc.gc.ca.
Questions? Contact the NRC Publications Archive team at
PublicationsArchive-ArchivesPublications@nrc-cnrc.gc.ca. If you wish to email the authors directly, please see the first page of the publication for their contact information.
NRC Publications Archive
Archives des publications du CNRC
This publication could be one of several versions: author’s original, accepted manuscript or the publisher’s version. / La version de cette publication peut être l’une des suivantes : la version prépublication de l’auteur, la version acceptée du manuscrit ou la version de l’éditeur.
Access and use of this website and the material on it are subject to the Terms and Conditions set forth at
An explanation of ice-crushing induced vibrational lock-in using the Molikpaq May 12, 1986 event as a test case
Gagnon, R. E.
https://publications-cnrc.canada.ca/fra/droits
L’accès à ce site Web et l’utilisation de son contenu sont assujettis aux conditions présentées dans le site LISEZ CES CONDITIONS ATTENTIVEMENT AVANT D’UTILISER CE SITE WEB.
NRC Publications Record / Notice d'Archives des publications de CNRC: https://nrc-publications.canada.ca/eng/view/object/?id=e143ad67-9d8d-42f6-8b02-468b196c34a4 https://publications-cnrc.canada.ca/fra/voir/objet/?id=e143ad67-9d8d-42f6-8b02-468b196c34a4
21
stIAHR International Symposium on Ice
“Ice Research for a Sustainable Environment”
Dalian, China, June 11 to 15, 2012
An Explanation of Ice-Crushing Induced Vibrational Lock-in
using the Molikpaq May 12, 1986 Event as a Test Case
R.E. Gagnon
Ocean, Coastal and River Engineering, National Research Council of Canada St. John's, NL, Canada
Robert.Gagnon@nrc.ca
The ice crushing induced vibration and so-called lock-in behavior exhibited by the Molikpaq structure during a test case event that occurred on May 12, 1986 has been explained in terms of ice spalling, and associated sawtooth load patterns, and resonance of the coupled structure-ice system where the mass and spring constant associated with the ice sheet are variable ‘effective’ quantities that depend on the ice sheet speed. Spalling at the ice edge contact zone plays a key role since the spalling frequency is directly proportional to the speed of the ice sheet towards the structure. Two modes of spalling are described for this particular event. One mode, called system resonant capped (SRC) spalling, causes loading that is similar to classic high-amplitude sawtooth loading and occurs at spalling frequencies in the vicinity of, or less than, the resonant frequency of the structure-ice system. In the present case the SRC spalling appears to be at the system resonant frequency. The other spalling mode is low-amplitude erratic spalling that is characterized by temporal unevenness and unevenness in the magnitude of consecutive load sawteeth. This type of spalling occurs at an average spalling frequency of about 4 Hz, which is substantially higher than the SRC spalling frequency range. For the analysis rough estimates for the variation of the effective mass and effective spring constant of the ice sheet throughout a range of spalling frequency were determined numerically. This treatment predicts that, for ice with similar properties as the May 12 event at least, sawtooth loading of the structure that cause structural oscillations are inevitable when an expansive ice sheet crushes against it. Potential means of significantly reducing the amplitude of the load oscillations by influencing fundamental spalling characteristics using blade-like spall initiators installed on the structure faces at the ice level are discussed.
1. Introduction
Ice crushing induced vibration has been the subject of interest in many investigations since problems were first encountered for some structures when ice sheets moved against them. The most widely known and studied events are those associated with the Gulf Canada Resources Ltd. Molikpaq caisson facility that occurred in 1986 during operations at the Amauligak I-65 site in the Canadian Beaufort Sea. Various analytical and numerical approaches have been applied to explain ice crushing induced vibration. However, none have had the capability to explain the phenomenon as complexly manifested during Molikpaq episodes. Here we show that new understandings of ice crushing, with emphasis on spalling behavior, can be applied to the problem when large-scale aspects of the ice are sufficiently taken into account and that this can explain ice-induced vibrations, including lock-in behavior. We will focus on the May 12, 1986 event since it is thought to be a test case for Molikpaq behavior during ice crushing induced vibration (Jefferies et al., 2011). Note that our definition of lock-in refers to the state the structure-ice system is in when the spalling rate is equal to the resonant frequency of the structure-ice system Gagnon (2011). Also note that this definition of ‘lock-in’ is a special case of a class of spalling we refer to as system resonant capped (SRC) spalling, described in detail below, that includes spalling at rates less than the resonant frequency of the structure-ice system.
The Molikpaq is a caisson-type structure that was designed for placement on an underwater sand berm that permits operations in a range of water depths. On May 12, 1986, a 7 km x 15 km ice floe comprised primarily of thick first-year ice with several multiyear ice inclusions began interacting and loading the structure on its northeast and north faces. Extensive crushing was observed for a significant portion of the 27 minutes that the floe was moving. Cyclic oscillations in load occurred for much of the interaction and the load on the north face reached about 250 MN. More details are given in Gagnon (2012).
2. Relationship between Ice Sheet Speed and Spalling Frequency
Various studies have shown that ice crushing, at least at rates in the brittle regime, is highly geometrical (e.g. Daley, 1992; Spencer and Masterson, 1993). That is, spalling events are determined for the most part by the geometry of the ice formation and the depth of penetration, where both can influence the level of confinement. Gagnon (2012) has shown that the spalling rate for an ice sheet crushing against a structure is directly proportional to the speed of the ice sheet and that the spall thickness is a constant. Furthermore in the case of the Molikpaq May 12, 1986 event the thickness of the spalls was about 5.4 cm. We may represent the ice sheet and its ice process surface during crushing as in Figure 1 where the sequence of spalls and their occurrence according to depth of penetration is illustrated. The process surface is the actual surface of the ice during the crushing interaction. The type of spalling event that ties in closely with the ice sheet speed involves a pair of spalls breaking away at approximately the same time, one from the lower and one from the upper edge portion of the ice sheet.
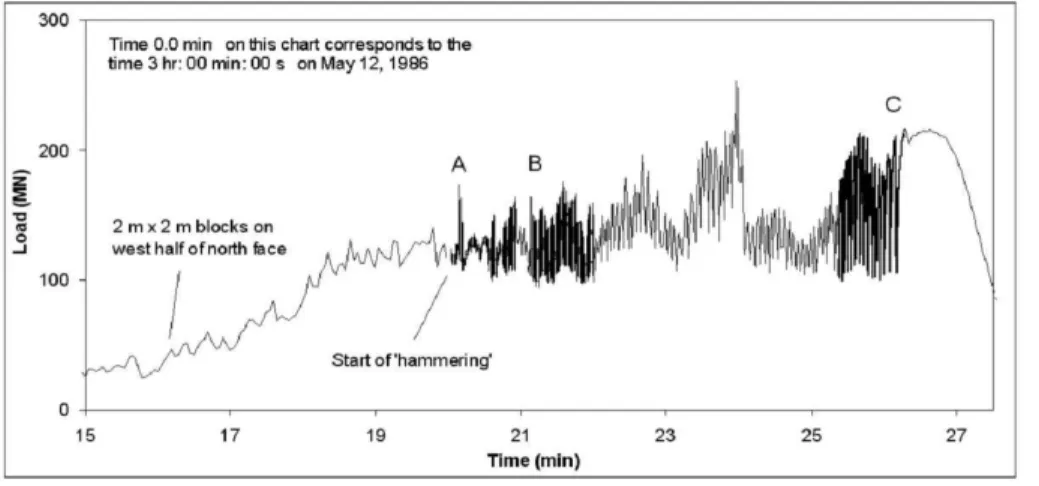
Figure 2 shows a large portion of the load record for the May 12, 1986 event. Sections of the load record will be referenced in the following discussion. The initial contact of the ice sheet with the Molikpaq occurred at around 3 hr: 01 min. Note that segments A, B and C of the load data, called burst file data, were acquired at a higher sampling rate (50 Hz) than the sampling rate (1 Hz) of the regular data, referred to as fast file data (Jefferies, 2010). An expanded view of
data segment C is shown in Figure 3. Gagnon (2012) has explained that all of the regular large oscillations in load in Figure 3, and that occurred throughout data segment B and parts of segment A, correspond to single spalling events.
3. Resonance of the Molikpaq and Ice Sheet System
Gagnon (2012) has shown that by taking the ice sheet effective mass and effective spring constant into account that the Molikpaq – ice sheet system has a variable resonant frequency that depends on the speed of the ice sheet crushing against the structure. This is due to the large extent of the ice sheet, the relatively short durations of the spalling events and the dependence of the spalling rate on ice sheet speed. Numerical
simulations were used to estimate the effective mass and effective spring constant of the ice sheet for differing spalling rates.
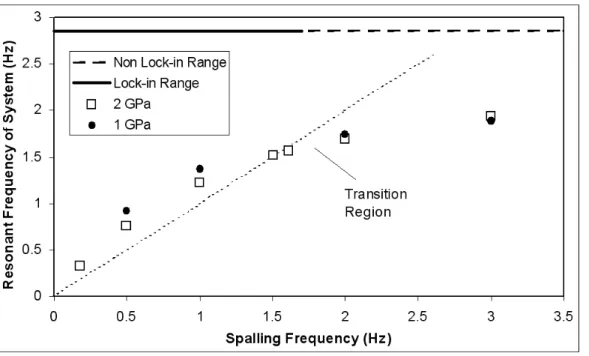
Figure 4 compares the spalling frequency with the resonant frequency of the system. Recall that Gagnon (2011) has shown in small-scale ice crushing experiments that lock-in occurs when the
spalling frequency is in the vicinity of the resonant frequency of the structure-ice system and this proximity causes it to adjust to exactly match the resonant frequency. The figure clearly shows
that this condition for lock-in exists for the spalling range from zero to roughly 1.6 Hz. This result fits very well with the Molikpaq behavior for May 12, 1986 where lock-in was evident throughout that range. We note that at higher spalling frequencies, corresponding to greater ice sheet speeds, lock-in will not occur. Earlier we introduced a designation called system resonant capped (SRC) spalling that refers to spalling where the frequency is at, or below, the resonant frequency of the structure-ice system.
Figure 1. Schematic illustrating the sequence of spalls that will occur as the ice sheet moves to the left and crushes against the Molikpaq structure. From Gagnon (2012).
Figure 2. A portion of the load record for the May 12, 1986 event. The main load trace, where the sampling rate was 1 Hz, runs for the full length of the chart. Superimposed on that are three segments of load data (dark trace), referred to as ‘burst file’ data, for the same event that were acquired at a sampling rate of 50 Hz. From Gagnon (2012).
Hence, SRC spalling includes the ‘lock-in’ description from Gagnon (2011).
4. Implications for the Molikpaq and Ice Sheet System
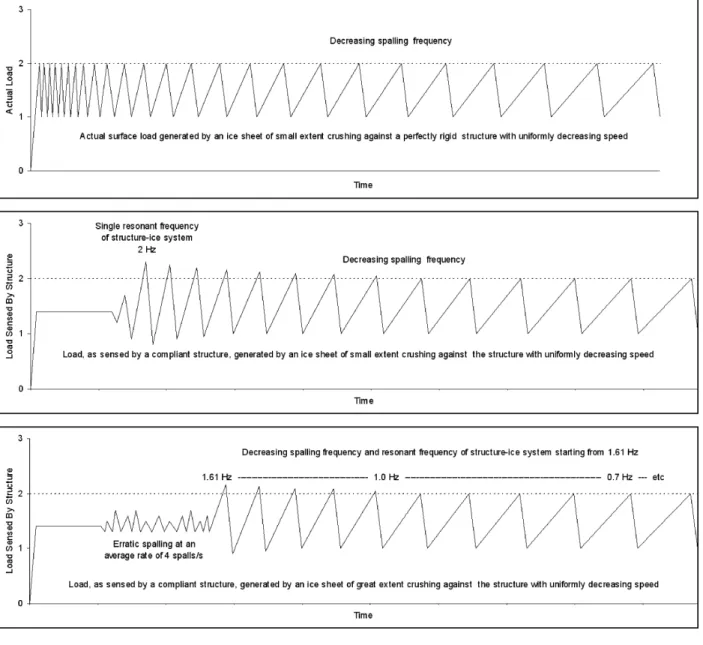
We will now look in considerable detail at three scenarios for an ice sheet interacting with a structure where the speed of the sheet slows down uniformly. The scenarios illustrated in Figure 5 are intended to assist the reader in appreciating the complex and subtle phenomenon underlying an event such as occurred at the Molikpaq structure on May 12, 1986. Before proceeding we make the important statement that the
force required at the ice edge to create a spalling event is a constant, that is, the critical stress to create the upper and lower fractures in the ice (see Figure 1) is constant, assuming the ice has uniform properties. Also note that the timescales are the same for each scenario in Figure 5.
Our first scenario will be the case of a perfectly rigid structure interacting with the ice sheet (Figure 5, top). In Figure 5 we have not assigned specific loads and times to the chart axes since we are most interested in discussing the patterns of load that develop, and the differences between the three scenarios. While the discussion is mostly qualitative some references will be made to the Molikpaq data. In this first scenario the ice sheet is not of large extent, that is, the time interval for sound to traverse the horizontal dimension of the sheet is much smaller than the periods of the load teeth in the sawtooth pattern. Since the ice sheet is of small extent we assume it is being driven by some artificial means for this discussion. The load generated by the ice during the interaction will, after the initial buildup from zero, look like the sawtooth sequence shown in Figure 5 (top). Here the peak loads correspond to the load magnitude necessary to generate the strain and stress in the ice to initiate the spalls, as mentioned above. All of the sawteeth have the same amplitude (nominal value of 2 units) and each is associated with a single spall event. Each spall event leads to a reduction in load associated with a portion of the hard-zone material (intact ice) breaking from the contact hard-zone and shattering into pulverized spall debris. The repetitive sawtooth pattern is stretching out in time as the ice sheet is slowing uniformly after the first few sawteeth. The slopes of the ascending portions of the load sawteeth are decreasing sequentially from left to right as the ice speed generally slows, whereas the
Figure 3. Data from burst file C (dark trace) overlapping fast file data (light trace) for a portion of the load record at the end of the sawtooth load oscillations that occurred during the May 12, 1986 event. From Gagnon (2012).
descending portions, i.e. the load drops, have the same steep slope that is independent of the ice sheet speed and reflects the spalling and debris extrusion characteristics of the ice itself. Note that in this first scenario the structure is rigid so it would not register any load information if we were using the movement of the structure as an indicator. Hence the load record shown in Figure 5 (top) is the actual load that would be registered by a fast response surface-mounted load measurement device on the structure face at the ice contact location.
For the second scenario (Figure 5, middle) we have a realistic structure, such as the Molikpaq, with its own spring constant and mass interacting with the ice. However, again we are assuming the ice sheet is of very small extent being driven by some artificial means at the same speed profile as in Figure 5 (top). Note that this time we are depicting the perceived load as determined from the movement of the structure and its known spring constant. In this simple case the structure-ice system will have a single resonant frequency dependent on the spring constants of the structure and ice and mass of the structure. We are ignoring the mass of the ice since we are assuming it is negligible compared to the structure. The resulting sawtooth pattern in Figure 5 (middle) is similar to the first case but it does exhibit some important differences. Note that in this case the slope on the decreasing side of the sawteeth is indicative of the response time capability of the structure itself, that depends on its own resonant frequency, since generally speaking the spalling event, as far as the ice is concerned, actually occurs much more rapidly. That is, for all of the load drops in the sawtooth pattern, no matter how fast the ice load actually drops during a spalling event, the structure response is limited by its own resonant frequency.
Figure 4. Molikpaq-ice coupled-system resonant frequency versus ice sheet spalling frequency. The diagonal line indicates where the resonant frequency and spalling frequency are the same. The horizontal line at the top of the plot indicates the spalling frequency regions where lock-in will and will not occur. From Gagnon (2012).
To continue, in the early stages where the spalling frequency is substantially higher than the resonant frequency of the structure-ice system the system cannot respond to the rapid changes so the load history for the early segment is such that an approximate average load registers, i.e. a nominal value between 1 and 2 units. At spalling rates sufficiently lower than the structure-ice resonant frequency the system can respond adequately and the load pattern will have the same amplitude as before in Figure 5 (top) (i.e. the true load amplitude as would be sensed on the face of the structure), however the frequency range will have shifted down somewhat, from the rigid structure case. This occurs because now it takes longer to reach the critical strain in the ice to attain the critical load for spalling since now there is strain in the ice and also movement of the structure. This causes the sawtooth pattern to stretch out in time somewhat compared to that in
Figure 5. Load versus time for three scenarios of an ice sheet interacting with a structure where the speed of the sheet slows down uniformly. The time scales, corresponding to the widths of the boxes, are the same for the three scenarios. The ice sheet has the same thickness and ice properties in each scenario. From Gagnon (2012).
Figure 5 (top) even though the ice sheet speed profile is the same in Figure 5 (top & middle). When a spalling event occurs both the structure and the ice surge towards each other and their combined movements account for the actual ice penetration that occurs during the spalling event. When spalls occur at the resonant frequency the system will respond with a somewhat higher amplitude due to the resonance, however it is not a run-away type behavior that is normally associated with mechanical resonance since in this case the energy pumped into the resonant system, in the form of elastic strain energy and kinetic energy, on the ascending part of a given load sawtooth is dissipated when the spall occurs. The energy dissipation is primarily due to the work associated with widening of the remaining hard intact ice area and extrusion of shattered spall debris as the ice and structure surge towards each other as described above. Due to the resonant effect during the loading portion of each cycle the structure moves further than in the non-resonant case for a given load and therefore shows an apparent higher ‘load’ when load is calculated from the structure movement and spring constant. The actual load to cause the spall, however, is no different than before. This is the type of ‘lock-in’ described by Gagnon (2011).
Before considering our third and final scenario we would like to draw attention to some details in the Molikpaq data records. If we look at data from the Molikpaq, specifically the sections of the SG09 strain gauge data set from the north face corresponding to three locations where one is 1.9 m west of the center of the face, another is 15.4 m west of the first and the third is 13.5 m east of the first (Figure 6), we note in the fine details of the signals many instances of coordination between the signals at the different locations in spite of their spatial separations. It appears that there is an underlying synchronized oscillation going on across the whole face of the Molikpaq, but of a different type than the large regular sawteeth in the load record (e.g. Figure 3). The oscillations are of higher frequency and less amplitude than the large regular load sawteeth evident in the second and third burst files. We have placed markers on Figure 6 to indicate some of the instances of
coordination
between the records. Note that while there is clearly an oscillatory pattern that it is not regular like other sections of the data where regular sawteeth are occurring, and the amplitude is less. The discussion below will address this.
The model we see in Figure 1 applies to the SRC spalling case, since the ice
Figure 6. Strain gauge data from early in the data set from three bulkheads on the Molikpaq north face for a time period when lock-in was not occurring. Markers (vertical lines) have been placed over some of the instances of coordination of local peaks in the three data traces. From Gagnon (2012).
sheet speed and spalling rate data used to generate that model, i.e. to get ~ 5.4 cm penetration per spall cycle, were taken from the three regions in the load record that corresponded to segments where resonance of the structure-ice system was apparently occurring, as we shall see below.
Now we shall look at the final case where we have a Molikpaq-type structure interacting with an ice sheet of large extent, such as occurred on May 12, 1986. This case is similar to the second scenario above but with the added feature that now we take into account the varying effective mass and effective spring constant of the ice sheet that arise due to its large extent. Remember that the time scales are the same in Figure 5 (top, middle, bottom). Also note that for low-frequency spalling events (e.g. 0.18 Hz) a relatively large amount of movement of the ice edge relative to the far-field ice occurs for each spall event cycle to create the strain and stress needed for spall initiation, due to the large extent of the sheet. Consequently the ice sheet in Figure 5 (bottom) is moving roughly 5 times faster than the ice sheet of small extent in Figure 5 (middle). This follows from recalling that the Molikpaq contribution to the ice penetration during a spalling event load drop of magnitude 100 MN is about 10 mm whereas the contribution to the ice penetration from the near-field ice movement itself must be around 44 mm since we know the combined movements must equal the net ice penetration per spalling event, i.e. ~ 5.4 cm (Figure 1). Hence, in the case of Figure 5 (middle) the ice penetration per spall event is about 10 mm, compared to ~ 54 mm in Figure 5 (bottom), because the majority of the ice penetration is due to the rebound of the structure whereas the ice rebound is small because the ice requires only a small compression (much less than 10 mm), due to its arbitrarily small extent, to generate the necessary strain and stress to initiate a spall event.
Regarding Figure 5 (bottom), when taking into account the varying effective mass and effective spring constant of the ice sheet the result is that the resonant frequency of the structure-ice system stays at, or above and in the vicinity of, the spalling rate throughout the majority of the interaction. Figure 5 (bottom) shows the load initially building up to a flat plateau corresponding to an average load associated with very rapid spalling that the structure is incapable of responding to, hence the perceived average load is between 1 and 2 units, similar to what we saw in the second scenario Figure 5 (middle). We will focus for a moment on the sawteeth occurring in the frequency range 1.61 Hz and lower. Remember that 1.61 Hz was at the transition frequency zone for SRC spalling behavior (Figure 4), where lower frequency spalling did lead to high-amplitude regular load sawtooth behavior and where higher frequency spalling did not. In this range the spalling rate is at, or less than, the resonant frequency of the structure-ice system.
This is an opportune time to explain why the thickness of spalls is only weakly dependent on the thickness of the expansive ice sheet if ice properties are fixed. Above we noted that the greater majority of penetration of the ice sheet during a spalling event is due to the movement of the ice edge during the event more so than the structure surge, since the structure movement accounts for roughly 19% of the penetration, that is, ~ 10 mm of the total 54 mm penetration per spall event. If we imagine a slowly moving substantially thinner ice sheet, e.g. 1.25 m thickness as compared to the previous 2.5 m (May 12 case), while keeping the ice properties fixed, the peak load value for a given load sawtooth would decrease by 50% to achieve the critical strain and stress for spall initiation. As noted, however, the strain in the ice sheet and movement of the ice edge to achieve the strain is exactly the same as before. Hence, during a spalling event the structure movement is reduced by 50%, because the load was reduced by that amount, but the ice
movement remains the same. The net result is that the spall thickness, i.e. the combined movement of the ice and the structure towards each other during the spall event, has only changed by about 9%. This is reflected in the mild dependence of spall thickness on ice sheet thickness that was discussed by Gagnon (2012) with respect to data from Jefferies (2010).
To continue, we are discussing the frequency range from 1.61 Hz and lower in Figure 5 (bottom). We might expect that the amplitude of the sawteeth would be the same as the actual value, as in Figure 5 (top), for the load sawteeth farther to the right of the frequency range since the spalling rate is significantly lower than the resonant frequency (~ 2 Hz) of the load measurement device itself, namely the Molikpaq structure. Similarly we might expect that on the higher end of that range, in the vicinity of 1.61 Hz, i.e. not that far from the actual resonant frequency of the Molikpaq structure, that some resonant amplification of the apparent load would show, such as the trend in Figure 5 (middle). Hence, we have left the same trend of somewhat increasing apparent load from right to left in the range 1.61 Hz and lower in Figure 5 (bottom). However, while the charts are the same in that frequency range they are radically different at frequencies higher than 1.61 Hz.
We will now discuss the nature of the drop in amplitude of the apparent load registered by the Molikpaq immediately above the 1.61 Hz frequency and other characteristics of the load pattern in that frequency region. Remember that the true magnitude of the actual force on the ice edge to cause a spall is constant. In the case of a structure like the Molikpaq a cyclic load, i.e. an
evenly spaced load sequence, cannot be applied to the structure and ice edge face at a rate higher
than the resonant frequency of the structure-ice system because the ice itself is part of the load delivery system. If the far-field ice moves at a speed to cause an average spalling rate that is higher than the resonant frequency of the structure-ice system, but close enough to the structure resonant frequency to yield some response, then spalling will occur in a somewhat erratic fashion in time and the apparent load amplitude associated with the structure movement would be smaller and uneven. That is, the spall events would be unevenly spaced in time, although the average rate would be the rate associated with the ice speed to account for the average penetration per unit time. Why is this so?
At 1.61 Hz and lower frequencies we know that the structure-ice system moves in a coordinated fashion that enables evenly spaced spalling and load cycles in time, as per our definitions of SRC spalling and lock-in. At higher frequencies the structure and ice are no longer as well coordinated so the regularity of the events is lost, that is, the spacing in time is no longer even. Being driven at a rate higher than the resonant rate of the ice and structure system causes the phase of the ice and structure movement to wander, while they remain in contact, from one spalling cycle to the next so that the peak stress needed for spalling to occur is reached at varying points in the successive cycles rather than at the same point in each cycle, as would be the case with evenly spaced spalling events. This leads to an erratic time series of spalling events. For the Molikpaq May 12, 1986 event the average frequency of this erratic-type of spalling was apparently about 4 spalls per second according to Figure 6.
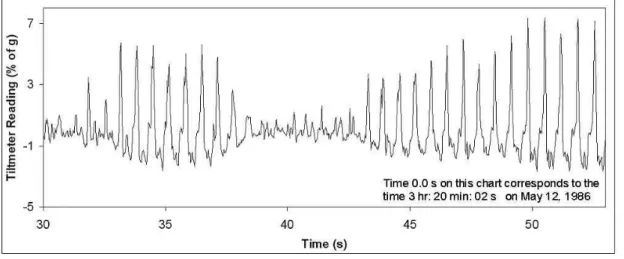
When the spalling rate abruptly slips out of the structure-ice resonant rate (just above 1.61 Hz as in Figs. 4 and 5) to the erratic spalling frequency, of around 4 spall events per second on average, the amplitude of the apparent load peaks diminishes considerably because the spalling rate is
substantially higher than the resonant frequency of the structure (~ 2 Hz). That is, the structure response is limited in amplitude and furthermore the load peaks exhibit unevenness in the apparent amplitudes for the same reasons given above associated with loss of coordination in the ice and structure movement. The ice sheet speed is not changing by much in the segment of Molikpaq data where three erratic spalling episodes occur (i.e. the low amplitude portions in data segment A, Figure 2). Indeed the system seems to be at a tipping point in this region, that is, briefly slipping in and out of erratic spalling before SRC spalling entirely takes over as the ice sheet speed continues to decrease. We speculate that slight changes in ice properties might even be determining which spalling mode prevails at any instant in time in this region. Note that the higher amplitude oscillations to the right and left of the lower amplitude central region of the tiltmeter record (Figure 7) are quite regular in time and amplitude whereas the central ones, and those at the very beginning, are not evenly spaced and have generally lower amplitude and also an unevenness in magnitude. Not only is the erratic spalling load sequence different in appearance from regular spalling but there is also a consequent reduction in the thickness of the spalls if we consider the spalls as in Figure 1. The regular spalls have a thickness of ~ 5.4 cm, as we have seen. Since the ice sheet speed at the erratic spalling segment of the data is about 0.09 m/s and 4 erratic spalls are occurring per second on average then it follows that the average thickness of the erratic spalls is ~ 2.3 cm. The reason why the erratic spalls have that particular average rate and thickness is uncertain. We conjecture that it may possibly be related to the fact that 4 hz is the first harmonic of the structure resonant frequency (~ 2 Hz).
To reiterate, the means by which regular evenly-spaced load cycles and spalling events are generated, i.e. the coordinated movement of ice and structure, is disrupted when the ice sheet speed imposes a spalling rate that is higher than the resonant frequency of the structure-ice system. The spalls must still occur, however the precise regularity is lost and is abruptly replaced by an unevenly spaced series of spalls occurring at an average rate considerably higher than the spalling rate was at the transition point. Furthermore, since the spalling rate is significantly higher than the resonant frequency of the structure the apparent amplitudes of the spall load
Figure 7. Tiltmeter reading time series for the north face of the Molikpaq during early stages of lock-in behavior. Two episodes of lock-in are evident (large amplitude oscillations) to the left and right of a central segment (low amplitude fluctuations) of the record where lock-in was not occurring. The time segment of the chart roughly corresponds to that of the second half of burst file A in Figure 2. From Gagnon (2012).
cycles will be reduced, much like limiting the response of an harmonic oscillator by forcing it at a frequency significantly higher than its natural frequency.
5. Further Considerations
Gagnon (2012) has discussed evidence that shows that spalls occur at the resonant frequency of the structure-ice system throughout the range of spalling frequencies up to about 1.61 Hz. One piece of evidence concerns the load record at the very end of the spalling sequence where the ice sheet has almost come to rest and where an oscillation is apparent (Figure 3). This oscillation is of course a record of the Molikpaq motion while in contact with the ice sheet at the point in the May 12, 1986 event where there was not quite enough load to cause another spall to occur, so the Molikpaq-ice system just briefly oscillated at its resonant frequency. The period of that one cycle just happens to match the period of the spalling events that immediately preceded it.
A consequence of the above considerations is that erratic spalling is synchronized across the face of the structure. Hence, conceptions from previous studies (Jefferies, 2010; Jefferies et al., 2011) that the lower amplitude oscillations that occur during non lock-in periods are due to non-simultaneous ice failures across the structure face may need to be revised. Instead, our proposition presents erratic spalling that occurs at an average rate that is higher than the resonant frequency of the structure-ice system as the ice crushes against the structure. That is, we have simultaneous failure of ice across the Molikpaq face but it does not lead to regular high-amplitude displacement oscillations because the average spalling frequency is too high.
From our understanding of the mechanisms that constitute spalling phenomena, e.g. Figure 1, it may be possible to incorporate active components into the design of a structure’s faces that could disrupt or control the spalling process. Studies such as the Hobson’s Choice Ice Island tests and small-scale laboratory ice crushing tests have shown that the fractures that create spalls nucleate roughly from the central region of the ice-structure contact zone. In the case of the edge of an ice sheet interacting with a large structure we could envisage an array of hydraulically-driven horizontally-oriented relatively thin metallic ‘blades’ that would punch/run into the hard zone area of the ice contact region (Figure 1) to initiate/nucleate spall-creating fractures before loads become excessively high. Furthermore, the running of the blades could be timed in such a way as to avoid simultaneous spalling across the structure face in favor of many smaller spalls spread out in time to reduce peak global loads. The blades, having suitable width dimensions and spacing, would span the full horizontal extents of the structure faces. This ‘blade runners’ concept could be easily tested in the lab and the optimum dimensions, run depth and spacing for the blades could be investigated. Such a study could also investigate the efficacy of simpler, and cheaper, fixed blades, i.e. not mechanically driven, that could influence spalling behavior and reduce loads. In principle the idea of activating large portions of a structure’s faces to influence and control spalling would probably work but the energy required to drive such a system, when considering the loads involved, would be impractical. Therefore the ‘blade runners’ concept, involving much smaller active components or potentially fixed components, is a viable approach.
6. Conclusions
In terms of forecasting, as discussed by Gagnon (2012), we can say that when a moving ice sheet of expansive extent, such as those we have mentioned, interacts with a structure such as the Molikpaq that, after an initial period of ‘settling in’, SRC spalling (i.e. regular load sawteeth)
will inevitably start at a particular speed of the sheet, as it slows down, and will continue until the ice sheet comes to rest against the structure. If the ice properties are similar to the properties of the ice sheets we have already mentioned then the ice thickness does not substantially alter the look of Figure 4. That is, if we double the thickness of an ice sheet it would cause only a slight shift to the left of the transition point that we see in the chart. That is because we would be doubling both the effective mass and the effective spring constant of the ice sheet. This would have a relatively small effect on the resonant frequency of the structure-ice system as explained by Gagnon (2012). The thickness of the ice sheet does, on the other hand, have a substantial effect on the amplitude of the baseline load and sawtooth load peaks. Doubling the sheet thickness would essentially double the loads, as we mentioned earlier in relation to load and thickness data from three different cyclic loading events on the Molikpaq (Jefferies et al., 2008). We can say that Figure 4 applies reasonably well to all three cases, i.e. the events that occurred on 17 February, 12 April and 12 May, 1986. The ice thickness may likely be the main factor that determines whether the absolute magnitude of the sawtooth loading associated with regular lock-in type spalllock-ing, or lower spalllock-ing rates, would be of concern to the structure. The connection between the spalling rates shown in Figure 4 and the speed of the interacting ice sheet is given through the simple linear relationship from Gagnon (2012). If the sheet was moving at a sufficiently high initial velocity there would also be a period of low-amplitude erratic spalling between the settling-in period and the regular sawtooth period that would probably not be a concern for the structure. In hindsight, we can say from these considerations that had the ice sheet in the 12 May, 1986 event been moving at some arbitrarily higher initial velocity that the outcome would not have been different except that the fairly level load plateau (at roughly 120 MN (Figure 2)) just before the beginning of regular sawtooth loading (SRC spalling), where low-amplitude erratic spalling was occurring, would have been longer in duration on the load record.
Acknowledgements
The author would like to thank Dr. J. Wang for assistance with some of the numerical simulations referred to from Gagnon (2012). Also the author would like to thank the Program of Energy Research and Development (PERD), Transport Canada and NRC for their support.
References
Daley, C. G., 1992. Ice edge contact and failure. Cold Regions Science and Technology, 21, 1-23.
Gagnon, R. E., 2011. An inside look at ice-crushing induced vibration and lock-in. Proc. of the 21st Int. Conf. on Port and Ocean Engineering under Arctic Conditions, Montreal, Canada, POAC 2011, paper #125.
Gagnon, R. E., 2012. An explanation for the Molikpaq May 12, 1986 Event. Cold Regions Science and Technology, in press.
Jefferies, M., 2010. Molikpaq dynamic ice-structure interaction at Amauligak 1985-6: measurements and data. Ice Induced Vibrations JIP workshop 29th -30th of November, Oslo, Norway. Copies can be obtained from M. Jefferies at geomek@hotmail.com.
Jefferies, M., Kärnä, T., and Løset, S., 2008. Field data on the magnification of ice loads on vertical structures. Proc. of IAHR 2008, Vancouver, Canada, 2, 1115-1133.
Jefferies, M. G., Rogers, B., Hardy, M., and Wright, B., 2011. Ice Load Measurement on Molikpaq: Methodology and Accuracy. Proc. of the 21st Int. Conf. on Port and Ocean Engineering under Arctic Conditions, Montreal, Canada, POAC 2011, paper #189.
Spencer, P. A., and Masterson, D. M., 1993. A geometrical model for pressure aspect-ratio effects in ice-structure interaction. Proc. of the 12th International Conference on Offshore mechanics and Arctic Engineering, OMAE 1993, 4, 113-117.