HAL Id: hal-00295578
https://hal.archives-ouvertes.fr/hal-00295578
Submitted on 17 Jan 2005
HAL is a multi-disciplinary open access
archive for the deposit and dissemination of
sci-entific research documents, whether they are
pub-lished or not. The documents may come from
teaching and research institutions in France or
abroad, or from public or private research centers.
L’archive ouverte pluridisciplinaire HAL, est
destinée au dépôt et à la diffusion de documents
scientifiques de niveau recherche, publiés ou non,
émanant des établissements d’enseignement et de
recherche français ou étrangers, des laboratoires
publics ou privés.
Oxygenated compounds in aged biomass burning plumes
over the Eastern Mediterranean: evidence for strong
secondary production of methanol and acetone
R. Holzinger, J. Williams, G. Salisbury, T. Klüpfel, M. de Reus, M. Traub, P.
J. Crutzen, J. Lelieveld
To cite this version:
R. Holzinger, J. Williams, G. Salisbury, T. Klüpfel, M. de Reus, et al.. Oxygenated compounds in aged
biomass burning plumes over the Eastern Mediterranean: evidence for strong secondary production
of methanol and acetone. Atmospheric Chemistry and Physics, European Geosciences Union, 2005, 5
(1), pp.39-46. �hal-00295578�
www.atmos-chem-phys.org/acp/5/39/ SRef-ID: 1680-7324/acp/2005-5-39 European Geosciences Union
Chemistry
and Physics
Oxygenated compounds in aged biomass burning plumes over the
Eastern Mediterranean: evidence for strong secondary production
of methanol and acetone
R. Holzinger1,*, J. Williams1, G. Salisbury1, T. Kl ¨upfel1, M. de Reus1, M. Traub1, P. J. Crutzen1, and J. Lelieveld1
1Max-Planck-Institut f¨ur Chemie, Postfach 3060, 55020 Mainz, Germany
*now at: University of California at Berkeley, Dept. Environm. Sci. Policy & Management, Berkeley, CA 94720 USA
Received: 5 August 2004 – Published in Atmos. Chem. Phys. Discuss.: 7 October 2004 Revised: 13 December 2004 – Accepted: 28 December 2004 – Published: 17 January 2005
Abstract. Airborne measurements of acetone, methanol, PAN, acetonitrile (by Proton Transfer Reaction Mass Spec-trometry), and CO (by Tunable Diode Laser Absorption Spectroscopy) have been performed during the Mediter-ranean Intensive Oxidants Study (MINOS August 2001). We have identified ten biomass burning plumes from strongly el-evated acetonitrile mixing ratios. The characteristic biomass burning signatures obtained from these plumes reveal sec-ondary production of acetone and methanol, while CO pho-tochemically declines in the plumes. Mean excess mixing ra-tios – normalized to CO – of 1.8%, 0.20%, 3.8%, and 0.65% for acetone, acetonitrile, methanol, and PAN, respectively, were found. By scaling to an assumed global annual source of 663–807 Tg CO, biomass burning emissions of 25–31 and 29–35 Tg/yr for acetone and methanol are estimated, respec-tively. Our measurements suggest that the present biomass burning contributions of acetone and methanol are signifi-cantly underestimated due to the neglect of secondary for-mation within the plume. Median acetonitrile mixing ratios throughout the troposphere were around 150 pmol/mol, in accord with current biomass burning inventories and an at-mospheric lifetime of ∼6 months.
1 Introduction
Biomass burning is among the largest anthropogenic air pol-lution sources, and it impacts the atmosphere on a global scale. The amount of biomass burned each year is estimated to be of order 8600 Tg (+/−50%, Andreae and Merlet, 2001). Along with the emission of large quantities of CO2, CO,
or-ganic aerosols, and black carbon a myriad of other oror-ganic compounds are emitted at lower but nevertheless significant Correspondence to: R. Holzinger
(holzing@nature.berkeley.edu)
levels (Yokelson et al., 1999; Goode et al., 2000; Andreae and Merlet, 2001; Holzinger et al., 1999; Simoneit, 2002).
Trace gases like acetone, carbon monoxide, methanol and peroxyacetyl-nitrate (PAN) play important roles in atmo-spheric chemistry, and all are directly emitted and/or pro-duced in biomass burning plumes. Acetone is an impor-tant source of HOxradicals (Singh et al., 1995) in the upper
troposphere. Carbon monoxide together with methane con-trols the atmosphere’s reactivity in remote areas. Methanol is one of the most significant organic compounds in the atmo-sphere, having an annual atmospheric carbon turnover that is exceeded only by methane and isoprene. The photochem-ical product PAN is relatively stable to photolysis and HO oxidation in the free troposphere, but decomposes rapidly at temperatures above 15–20◦C. In this way PAN and other organic-nitrates have the potential to sequester, transport and release nitrogen oxides (NOx) at great distances from the
source.
In this study we investigate aged biomass burning plumes observed over the Mediterranean Sea. Using acetonitrile as a marker for biomass burning we found higher levels of ace-tone and methanol than in fresh or experimental fire plumes. Our results suggest that biomass burning is a significant source of acetone, methanol and PAN.
2 Experimental
The Mediterranean Intensive Oxidant Study (MINOS) was conducted in August 2001 (Lelieveld et al., 2002). 14 measurement flights up to altitudes of 13 km were per-formed with a twinjet Falcon aircraft operated by DLR (German Aerospace Centre), from Heraklion airport, Crete (35◦N, 25◦E); for details about MINOS visit http://www. mpch-mainz.mpg.de/∼reus/minos/. Carbon monoxide was measured by Tunable Diode Laser Absorption Spectroscopy
40 R. Holzinger et al.: Oxygenated compounds in aged biomass burning plumes 48 46 44 42 40 38 36 34 30 25 20 15 10 5
biomass burning events
12x103 8 4 0
altitude [m]
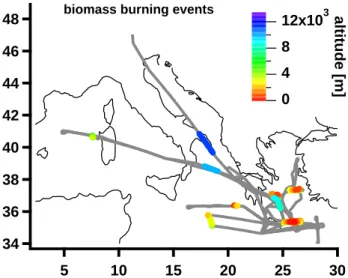
Fig. 1. Flight tracks and location of biomass burning plumes.
(TDLAS) with an accuracy of 1% and a precision of 1.5 nmol/mol (Wienhold et al., 1998). Acetone, acetoni-trile, methanol and PAN were measured by Proton-Transfer-Reaction Mass Spectrometry (PTR-MS). Like most VOCs with proton affinities higher than water, acetone, acetoni-trile and methanol are detected at their protonated masses 59, 42, and 33 amu, respectively (Lindinger et al., 1998). Protonated PAN, however, reacts with water to produce CH3C(O)OOHH+at mass 77 (Hansel and Wisthaler, 2000).
The collision energies between ions and molecules in the PTR-MS were minimised in order to prevent sensitivity loss due to the fragmentation of protonated PAN. Typical values for the ratio E/N were 90 Townsend (Td; 1 Td=10−17V cm2).
Comparison with a second PTR-MS operated under stan-dard conditions (120 Td) by the University of Utrecht showed good agreement between the two instruments (de Gouw et al., 2003). The instrument background signal was mea-sured every few minutes by converting VOCs efficiently to CO2and water in a heated stainless steel tube (350◦C) filled
with a platinum catalyst. Based on atmospheric chemistry considerations (Williams et al., 2001) and from a GC-PTR-MS analysis of several Teflon bags filled in-flight (de Gouw et al., 2003) we are confident that at masses 33, 42 and 59 no significant contributions were detected (>10%) from molecules other than methanol, acetonitrile and acetone, re-spectively. Potential interference from other molecules at mass 77 (PAN) was assessed by applying an additional ther-mal converter every few minutes. The converter was oper-ated at 120◦C and thermally destroyed PAN at this tempera-ture; other compounds were found to pass through the con-verter without losses. Using the PTR-MS technique trace gas concentrations can be calculated according to the rela-tion [VOC·H+]≈[H3O+] [VOC] kVOCt, where t is the
reac-tion time and kVOCis the reaction rate constant for the proton
transfer from H3O+to compound VOC. Note that all
param-eters in this relation are known and no in-flight calibration was needed. However, to ensure that all relevant parame-ters, namely the reaction rate constants, reaction time and transmission of the mass spectrometer were accounted for correctly, we cross checked the applied calculations and cor-rections by measuring a gravimetrically prepared calibration gas standard (Apel-Riemer Enviromental Inc) with a certified accuracy better than 5% for methanol, acetone and acetoni-trile. These compounds were calibrated against the gas stan-dard by fine-tuning parameters like reaction rate constants and transmission. In the case of PAN it is difficult to cal-culate concentrations because more than one ion-molecule reaction is involved. In laboratory studies we investigated how the detection sensitivity of PAN is influenced by param-eters such as humidity and pressure. The PTR-MS signal at-tributed to PAN was calibrated using a commercial GC-ECD (Meteo-Consult) which was calibrated using a synthesised PAN standard, the concentration of which was determined by measurements of NO after the PAN was passed through an NOyconverter. The synthesis and calibration method is
described in detail elsewhere (Williams et al., 2000). The overall accuracy for all compounds measured with PTR-MS is better than 20% (40% for PAN), with reservations regard-ing possible interference to the signal at m77 comregard-ing from molecules other than PAN.
The specific masses of methanol, acetonitrile, acetone, and PAN have been integrated for 2, 5, 2, and 5 sec, respectively. One cycle was completed in ∼20 sec, wich also included mnonitoring of the primary ion signal (4–6 million counts per second) and several engeneering parameters. The pre-cision of the PTR-MS data is dependent on integration time, background signal and mixing ratio. Detection limits, de-termined as 3σ above background, for acetone, acetonitrile, methanol and PAN were 100, 20, 500, 50 pmol/mol respec-tively; and typical values for the precision at levels of 50, 500 and 2000 pmol/mol were as follows: 30, 10, 5% for acetoni-trile; –, 25, 10% for acetone; –, 70, 20% for methanol; and 60, 20, 10% for PAN, respectively.
3 Results and discussion
3.1 Biomass burning plumes
During the MINOS campaign we identified ten biomass burning plumes at altitudes between 1 and over 11 km at vari-ous locations over the eastern Mediterranean region (Fig. 1). Plumes were identified by significant peaks in the acetoni-trile volume mixing ratio; i.e. the difference in concentra-tion between peak and neighbouring points exceeded at least three times the standard deviation of the neighbouring points. From the ten plumes, six (i.e. those below 2km and east of 24◦E) are likely to originate from agricultural burning, a great deal of which was occurring in Eastern Europe at the time of the MINOS campaign. According to a trajectory
2x10³ 10 8 6 4 2 0 altitude [m] 09:00 19.08.01 10:00 11:00 UTC 2.6 2.4 2.2 2.0 1.8 1.6 300 250 200 150 100 4 3 2 1 160 140 120 100 80 300 250 200 150 100 acetonitrile acetone methanol PAN CO VOCs in units of nmol/mol (acetonitrile pmol/mol)
acetonitrile
Fig. 2. An example biomass burning signature. Usually good correlation of acetonitrile with CO, acetone, methanol and PAN was observed
in biomass burning plumes.
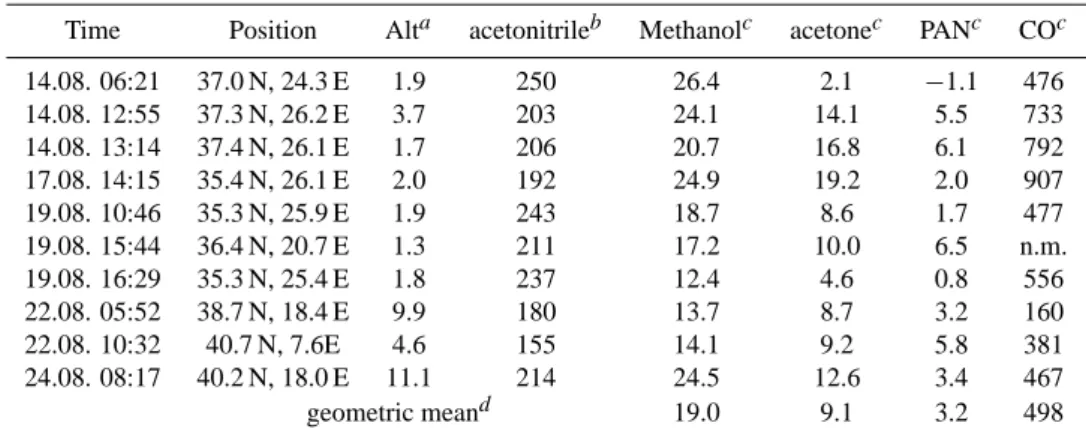
Table 1. Time, position and NEMRs of biomass burning plumes encountered during MINOS.
Time Position Alta acetonitrileb Methanolc acetonec PANc COc 14.08. 06:21 37.0 N, 24.3 E 1.9 250 26.4 2.1 −1.1 476 14.08. 12:55 37.3 N, 26.2 E 3.7 203 24.1 14.1 5.5 733 14.08. 13:14 37.4 N, 26.1 E 1.7 206 20.7 16.8 6.1 792 17.08. 14:15 35.4 N, 26.1 E 2.0 192 24.9 19.2 2.0 907 19.08. 10:46 35.3 N, 25.9 E 1.9 243 18.7 8.6 1.7 477 19.08. 15:44 36.4 N, 20.7 E 1.3 211 17.2 10.0 6.5 n.m. 19.08. 16:29 35.3 N, 25.4 E 1.8 237 12.4 4.6 0.8 556 22.08. 05:52 38.7 N, 18.4 E 9.9 180 13.7 8.7 3.2 160 22.08. 10:32 40.7 N, 7.6E 4.6 155 14.1 9.2 5.8 381 24.08. 08:17 40.2 N, 18.0 E 11.1 214 24.5 12.6 3.4 467 geometric meand 19.0 9.1 3.2 498 aAltitude in km.
bAverage volume mixing ratio of acetonitrile in the plume in units of pmol/mol. cNormalized excess mixing ratio (NEMR) in units of mol/mol.
dGeometric mean of individual NEMRs; negative values have been omitted.
analysis the age of these plumes was about 2–3 days (Traub et al., 2003). It was not possible to identify the source region of the other plumes.
A case study of a biomass burning plume encountered towards the end of flight 10 (19 August 2001; 08:15– 11:10 UTC (=Local time −3 h)) is presented in Fig. 2. The left-hand chart depicts cruising altitude and acetonitrile vol-ume mixing ratios. The biomass burning plvol-ume is high-lighted with a grey circle; in this region a good correlation occurs between acetonitrile and acetone (n=70, r2=0.85), CO (n=54, r2=0.69), methanol (n=70, r2=0.69), and PAN (n=60, r2=0.40) (right-hand chart).
The time, position, and altitude of all biomass burning plumes is given in Table 1, together with acetonitrile mix-ing ratios and normalized excess mixmix-ing ratios (NEMR) of acetone, CO, methanol, and PAN; the latter were obtained as follows: excess mixing ratios (EMR) were calculated by sub-tracting the mixing ratios just before or after a biomass burn-ing plume from in-plume values. Note that for each plume a different background was used, which reflected atmospheric concentrations outside the plume. In a second step the EMRs were normalized by division by the EMR of acetonitrile. A mean NEMR was calculated for each compound by forming the geometric mean from all NEMRs of individual biomass
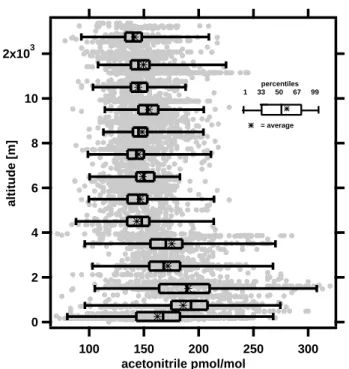
42 R. Holzinger et al.: Oxygenated compounds in aged biomass burning plumes 2x10³ 10 8 6 4 2 0 altitude [m] 300 250 200 150 100 acetonitrile pmol/mol percentiles 1 33 50 67 99 = average
Fig. 3. Height profile of acetonitrile with a statistical evaluation of
the data points at different altitudes.
burning events (Table 1). To avoid overestimation because of outliers we favoured the geometric mean.
In a fresh biomass burning plume the NEMR is equivalent to the emission ratio (ER), however, NEMRs obtained here may be different because the plumes were aged and organic species might have been produced or destroyed. In Table 2 NEMRs based on CO are shown together with emission tios from previous laboratory and field studies. Emission ra-tios of ∼1.2 mmol acetonitrile per mol CO have been consis-tently reported from several laboratory and field experiments. Significantly higher emission ratios have been reported from Indonesian fuels (Christian et al., 2003) of which the nitrogen content was higher than in fuels from other regions; the same was assumed to be the case in the single fire study reported by Jost et al. (2003).
During the MINOS campaign we observed a mean NEMR of 2.0 mmol acetonitrile per mol CO which is ∼50% higher than most reported values from other studies (Table 2). This may reflect a higher nitrogen content of the fuels causing the observed plumes. Another plausible explanation for this discrepancy is photochemical degradation of CO since the plumes encountered over the Eastern Mediterranean were considerably aged. On average 24 h mean concentrations of HO of 4.5×10⁶molecules/cm3were measured at the Fi-nokalia ground station in Crete during the MINOS campaign (Berresheim et al., 2003). If such high values are represen-tative for the region, 24% of the CO in a biomass burning plume would be removed within the assumed travel time from the source region northeast of the Black sea (3 days),
whereas mixing ratios of acetonitrile would not be reduced significantly on this timescale. The chemical CO loss is partly balanced by secondary CO production; however, the sum of compounds (based on Andreae and Merlet, 2001) that might form secondary CO is about an order of magni-tude lower. If the NEMR is corrected for 24% chemical CO loss the obtained value of 1.5 mmol/mol is close to what is reported for fresh biomass burning emissions.
The NEMRs of methanol and acetone found during MI-NOS (Table 2) are significantly higher than what was found in previous studies; methanol is enhanced by a factor of 2– 6, and acetone by a factor of 2–14. Photochemical degra-dation of CO can by no means explain these discrepancies, as the lifetimes of both acetone and methanol are shorter than that of CO. Therefore our results strongly indicate secondary production of methanol and acetone in biomass burning plumes and support recent measurements by Jost et al. (2003) who found fast chemical production of ace-tone in a fresh biomass burning plume over Namibia. By scaling to an assumed annual carbon monoxide emission of 663–807 Tg (Bergamaschi et al., 2000) our results suggest a global biomass burning source of 25–31 Tg and 29–35 Tg for acetone and methanol, respectively. Comparing these numbers with global budget estimates for acetone (95 Tg/yr, Jacob et al., 2002) and methanol (345 Tg/yr, Heikes et al., 2002) the biomass burning contribution may be ∼25% and
∼10%, respectively. Most recently, Singh et al. (2004) esti-mated annual biomass burning sources of 9 and 11 Tg/yr for acetone and methanol, respectively. Our results imply that oxidation processes in the plume are quite efficient, and that secondary production dominates over primary emission for both compounds; the mechanism for this oxidation, however, remains unclear.
Salisbury et al. (2003) compared acetone and methanol measurements performed at Finokalia station, Crete, Au-gust 2001, with the modelled concentrations of the MATCH-MPIC (Model of Atmospheric Chemistry and Transport, Lawrence et al., 2002). Although the modelled and measured acetone and methanol were well correlated, the model signif-icantly underestimated the concentrations. Part of this dis-crepancy can probably be resolved by initialising the model with higher production factors as is suggested by our mea-surements.
As far as we know, there are no studies assessing a pro-duction rate of PAN from biomass burning, although it has been reported as a secondary product in biomass burning plumes (Mauzerall et al., 1998; Talbot et al., 1999; Singh et al., 2004). Considering the thermolability of this compound, however, we refrain from a global extrapolation for PAN pro-duction in biomass burning plumes (which would be of the order of 29–35 Tg/yr).
Table 2. Emission ratios and NEMRs based on CO (mmolVOC/molCO).
Fuel Type methanol acetonitrile acetone PAN this study1
not identified 38 2.0 18 6.5
Holzinger et al. (1999), lab study
Savanna grass 6.4 1.3 5.4
Christian et al. (2003), lab study
African savanna fuels 15 1.2 1.3
Indonesian fuels 24 6.5 4.6
Jost et al. (2003), field study
African savanna fire 2.6–3.8 4.8–11.3 Mauzerall et al. (1998), field study
not identified 6.3
Singh et al. (2004), field study
not identified 10.6–16.3 4.7–7.5 3.8–4.1 Andreae and Merlet (2001), review paper
Savanna and grassland 18 1.2 1.9–4.6 extratropical forest 16 1.2 2.3–2.7 agricultural residues 19 1.3 3.3
1These values have been calculated from the mean NEMRs in Table 1. E.g. NEMR
methanol=1000×19.0/498≈38
3.2 Acetonitrile mixing ratios
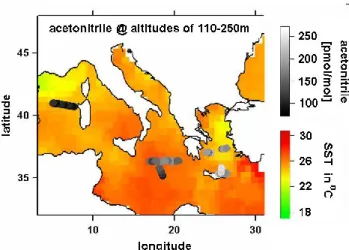
Mixing ratios and a statistical evaluation of acetonitrile are shown in Fig. 3. At the lowest two altitude levels signif-icantly lower average than median mixing ratios were ob-served. From trajectory analysis (Traub et al., 2003) we can exclude that these air masses had been recently mixed with clean background air, so we conclude that the variabil-ity in the lowest 4 km of the troposphere was higher due to a stronger influence from biomass burning sources and uptake into the sea. Interestingly, the variability was also higher at altitudes above 11 km. Again based on trajectory analysis we attribute this to fresh pollution advected from the con-vective monsoon regions in South Asia, where biofuel use is common (Scheeren et al., 2003). Figure 4 shows acetoni-trile mixing ratios in the marine boundary layer and average sea surface temperature (SST) in August 2001 (Smith et al., 1996). The lowest acetonitrile mixing ratios were measured during a flight to the west of Sardinia. A potential reason for this can be found ∼200 km upwind, where acetonitrile was likely deposited into the sea over an extended zone of relatively cool, upwelling water. Similar observations were made by Warneke and de Gouw (2001) over the western In-dian Ocean. From our data we do not see clear evidence for ocean uptake in other regions. Acetonitrile may still be taken up over the Eastern Mediterranean Sea but the uptake may be masked by continuous advection of biomass burning emissions. However, if acetonitrile is not biochemically re-moved in the seawater, ocean uptake (or release) of acetoni-trile would basically be a function of sea surface temperature. In this case the ocean would only acts as reservoir and
ace-Fig. 4. Acetonitrile mixing ratios in the marine boundary layer, and
the average sea surface temperature (SST) in August 2001 obtained from the NOAA/NASA Pathfinder Program (Smith et al., 2003).
tonitrile could be emitted from warmed up seawater as has been recently suggested by Sanhueza et al. (2004) to explain high acetonitrile concentrations over a Venezuelan savanna. This is also supported by results from a ship cruise across the tropical Atlantic; most time water concentrations of acetoni-trile were found to be in equilibrium with air concentrations (Williams et al., 2004).
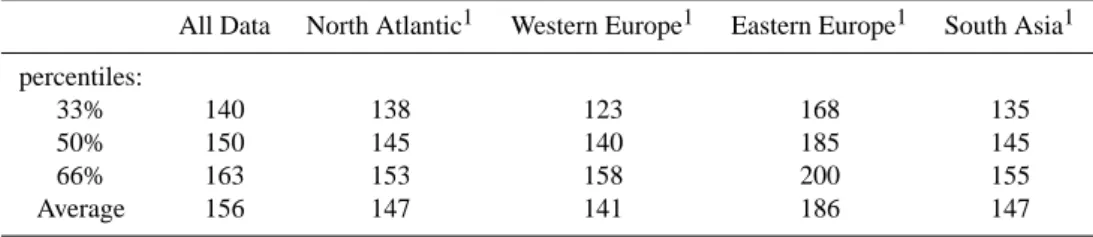
Based on the trajectory analysis by Traub et al. (2003) we split the dataset into 4 sub-sets (North Atlantic, Western Europe, Eastern Europe, and South Asia) according to the source region of the air masses; typical acetonitrile mixing
44 R. Holzinger et al.: Oxygenated compounds in aged biomass burning plumes
Table 3. Typical mixing ratios (pmol/mol) of acetonitrile in air from different source regions.
All Data North Atlantic1 Western Europe1 Eastern Europe1 South Asia1 percentiles:
33% 140 138 123 168 135
50% 150 145 140 185 145
66% 163 153 158 200 155
Average 156 147 141 186 147
1Source regions according to Traub et al. (2003).
ratios are presented in Table 3. From this analysis we infer that average mixing ratios of 140–150 pmol/mol are preva-lent throughout the troposphere. Singh et al. (2003) mea-sured average acetonitrile mixing ratios of 149 pmol/mol at altitudes of 0–12 km over the Pacific Ocean (February– April, 2001), just several of months previously, and in excel-lent agreement with our results from the Eastern Mediter-ranean. Assuming an annual biomass burning source of 1.3±0.65 Tg acetonitrile per year (Andreae and Merlet, 2001) and an average concentration of 150 pmol/mol a life-time of ∼6±3 months can be calculated; equal to the ra-tio obtained by dividing the tropospheric burden by the an-nual source. Considering a global mean HO concentration of 1.16×10⁶molecules cm−3(Spivakovsky et al., 2000) and a reaction rate constant of 1.4×10⁻¹⁴cm3molecules−1s−1 (Atkinson et al., 1997, T=266 K) the photochemical lifetime of acetonitrile is ∼2 years. Therefore, dry deposition to land and/or sea surfaces likely is the dominant sink for acetoni-trile.
4 Conclusions
During the MINOS campaign ten biomass burning plumes were identified over the eastern Mediterranean. The NEMRs of acetone and methanol obtained from these plumes were higher than those observed in controlled experimental fires, whereas a lower production factor was measured for CO. We infer secondary production of acetone and methanol in the biomass burning plumes, while CO is subject to net photo-chemically removal in the plumes.
Acetonitrile mixing ratios have been measured over the eastern Mediterranean Sea at altitudes of 0–13 km. Given that current biomass burning inventories are correct, av-erage concentrations are consistent with a lifetime of
∼6±3 months. Therefore other sinks must dominate over photochemical degradation, most likely dry deposition over land and/or sea.
Acknowledgements. We thank two anonymous referees for con-structive and high quality reviews. We gratefully acknowledge the support of the pilots and technicians of the DLR Falcon. We thank H. Fischer, B. Scheeren, and J. de Gouw for insightful comments on earlier manuscripts of this paper.
Edited by: W. T. Sturges
References
Andreae, M. O. and Merlet, P.: Emission of trace gases and aerosols from biomass burning, Global Biogeochem. Cyc., 15 (4), 955– 966, 2001.
Atkinson, R., Baulch, D. L., Cox, R. A., Hampson, R. F., Kerr, J. A., Rossi, M. J., and Troe, J.: Evaluated kinetic and photochemical data for atmospheric chemistry: Supplement VI – IUPAC sub-committee on gas kinetic data evaluation for atmospheric chem-istry, J. Phys. Chem. Ref. Data, 26 (6), 1329–1499, 1997. Bergamaschi, P., Hein, R., Brenninkmeijer, C. A. M., and Crutzen,
P. J.: Inverse modeling of the global CO cycle 2. Inversion of C-13/C-12 and O-18/O-16 isotope ratios, J. Geophys. Res., 105 (D2), 1929–1945, 2000.
Berresheim, H., Plass-Dulmer, C., Elste, T., Mihalopoulos, N., and Rohrer, F.: OH in the coastal boundary layer of Crete during MINOS: Measurements and relationship with ozone photolysis, Atmos. Chem. Phys., 3, 639–649, 2003,
SRef-ID: 1680-7324/acp/2003-3-639.
Christian, T. J., Kleiss, B., Yokelson, R. J., Holzinger, R., Crutzen, P. J., Hao, W. M., Saharjo, B. H., and Ward, D. E.: Comprehen-sive laboratory measurements of biomass-burning emissions: 1. Emissions from Indonesian, African, and other fuels, J. Geophys. Res., 108 (D23), doi:10.1029/2003JD003704, 2003.
de Gouw, J. A., Warneke, C., Holzinger, R., and Williams, J.: Inter-comparison Between Airborne Measurements of Methanol, Acetonitrile and Acetone Using Two Different Configured PTR-MS Instruments, Int. J. Mass Spectrom., 239 (2-3), 129–137, doi:10.1016/j.ijms.2004.07.025, 2004.
Goode, J. G., Yokelson, R. J., Ward, D. E., Susott, R. A., Bab-bitt, R. E., Davies, M. A., and Hao, W. M.: Measurements of excess O-3, CO2, CO, CH4, C2H4, C2H2, HCN, NO, NH3, HCOOH, CH3COOH, HCHO, and CH3OH in 1997 Alaskan biomass burning plumes by airborne fourier transform infrared spectroscopy (AFTIR), J. Geophys. Res., 105 (D17), 22 147– 22 166, 2000.
Hansel, A. and Wisthaler, A.: A method for real-time detection of PAN, PPN and MPAN in ambient air, Geophys. Res. Lett., 27 (6), 895–898, 2000.
Heikes, B. G., Chang, W. N., Pilson, M. E. Q., Swift, E., Singh, H. B., Guenther, A., Jacob, D. J., Field, B. D., Fall, R., Riemer, D., and Brand, L.: Atmospheric methanol bud-get and ocean implication, Global Biogeochem. Cyc., 16 (4), doi:10.1029/2002GB001895, 2002.
Holzinger, R., Warneke, C., Hansel, A., Jordan, A., Lindinger, W., Scharffe, D. H., Schade, G., and Crutzen, P. J.: Biomass burning as a source of formaldehyde, acetaldehyde, methanol, acetone, acetonitrile, and hydrogen cyanide, Geophys. Res. Lett., 26 (8), 1161–1164, 1999.
Jacob, D. J., Field, B. D., Jin, E. M., Bey, I., Li, Q. B., Logan, J. A., Yantosca, R. M., and Singh, H. B.: Atmospheric budget of ace-tone, J. Geophys. Res., 107 (D10), doi:10.1029/2001JD000694, 2002.
Jost, C., Trentmann, R., Sprung, D., Andreae, M. O., McQuaid, J. B., and Barjat, H.: Trace gas chemistry in a young biomass burn-ing plume over Namibia: Observations and model simulations, J. Geophys. Res., 108 (D13), doi:10.1029/2002JD002431, 2003. Lawrence, M., Rasch, P. J., von Kuhlmann, R., Williams, J., Fis-cher, H., de Reus, M., Lelieveld, J., Crutzen, P. J., Schultz, M., Stier, P., Huntrieser, H., Heland, J., Stohl, A., Forster, C., Elbern, H., Jakobs, H., and Dickerson, R. R.: Global chemical weather forecasts for field campaign planning: predictions and observa-tions of large-scale features during MINOS, CONTRACE, and INDOEX, Atmos. Chem. Phys., 3, 267–289, 2003,
SRef-ID: 1680-7324/acp/2003-3-267.
Lelieveld, J., Berresheim, H., Borrmann, S., Crutzen, P. J., Den-tener, F. J., Fischer, H., Feichter, J., Flatau, P. J., Heland, J., Holzinger, R., Korrmann, R., Lawrence, M. G., Levin, Z., Markowicz, K. M., Mihalopoulos, N., Minikin, A., Ramanathan, V., de Reus, M., Roelofs, G.J., Scheeren, H. A., Sciare, J., Schlager, H., Schultz, M., Siegmund, P., Steil, B., Stephanou, E. G., Stier, P., Traub, M., Warneke, C., Williams, J., and Ziereis, H.: Global air pollution crossroads over the Mediterranean, Sci-ence, 298, 794–799, 2002.
Lindinger, W., Hansel, A., and Jordan, A.: On-line monitoring of volatile organic compounds at pptv levels by means of proton-transfer-reaction mass spectrometry (PTR-MS) – Medical appli-cations, food control and environmental research, Int. J. Mass Spectrom., 173 (3), 191–241, 1998.
Mauzerall, D. L., Logan, J. A., Jacob, D. J., Anderson, B. E., Blake, D. R., Bradshaw, J. D., Heikes, B., Sachse, G. W., Singh, H., and Talbot, B.: Photochemistry in biomass burning plumes and implications for tropospheric ozone over the tropical South At-lantic, J. Geophys. Res., 103 (D7), 8401–8423, 1998.
Salisbury, G., Williams, J., Holzinger, R., Gros, V., Mihalopou-los, N., Vrekoussis, M., Sarda-Esteve, R., Berresheim, H., von Kuhlmann, R., Lawrence, M., and Lelieveld, J.: Ground-based PTR-MS measurements of reactive organic compounds dur-ing the MINOS campaign in Crete, July-August 2001, Atmos. Chem. Phys., 3, 925–940, 2003,
SRef-ID: 1680-7324/acp/2003-3-925.
Sanhueza, E., Holzinger, R., Kleiss, B., Donoso, L., and Crutzen, P. J.: New insights in the global cycle of acetonitrile: release from the ocean and dry deposition in the tropical savanna of Venezuela, Atmos. Chem. Phys., 4, 275–280, 2004,
SRef-ID: 1680-7324/acp/2004-4-275.
Scheeren, H. A., Lelieveld, J., Roelofs, G. J., Williams, J., Fis-cher, H., de Reus, M., de Gouw, J. A., Warneke, C., Holzinger, R., Schlager, H., Klupfel, T., Bolder, M., van der Veen, C., and Lawrence, M.: The impact of monsoon outflow from India and Southeast Asia in the upper troposphere over the eastern Mediter-ranean, Atmos. Chem. Phys., 3, 1589–1608, 2003,
SRef-ID: 1680-7324/acp/2003-3-1589.
Simoneit, B. R. T.: Biomass burning – A review of organic tracers for smoke from incomplete combustion, Appl. Geochem., 17 (3), 129–162, 2002.
Singh, H., Salas, L., Herlth, D., Kolyer, R., Czech, E., Viezee, W., Li, Q. B., Jacob, D., Blake, D., Sachse, G., Harward, C. N., Fuelberg, H., Kiley, C. M., Zhao, Y. J., and Kondo, Y.: In-situ measurements of HCN and CH3CN over the Oacific Ocean: Sources, Sinks, and budgets, J. Geophys. Res., 108 (D20), doi:10.1029/2002JD003006, 2003.
Singh, H. B., Kanakidou, M., Crutzen, P. J., and Jacob, D. J.: High-Concentrations and Photochemical Fate of Oxygenated Hydro-carbons in the Global Troposphere, Nature, 378 (6552), 50–54, 1995.
Singh, H. B., Salas, L. J., Chatfield, R. B., Czech, E., Fried, A., Walega, J., Evans, M. J., Field, B. D., Jacob, D. J., Blake, D., Heikes, B., Talbot, R., Sachse, G., Crawford, J. H., Avery, M. A., Sandholm, S., and Fuelberg, H.: Analysis of the atmo-spheric distribution, sources, and sinks of oxygenated volatile or-ganic chemicals based on measurements over the Pacific during TRACE-P, J. Geophys. Res., 109, doi:10.1029/2003JD003883, 2004.
Smith, E., Vazquez, J., Tran, A., and Sumagaysay, R.: Satellite-Derived Sea Surface Temperature Data Available From the NOAA/NASA Pathfinder Program, http://www.agu.org/eos elec/95274e.html, American Geophysical Union, 2003. Spivakovsky, C. M., Logan, J. A., Montzka, S. A., Balkanski, Y. J.,
Foreman-Fowler, M., Jones, D. B. A., Horowitz, L. W., Fusco, A. C., Brenninkmeijer, C. A. M., Prather, M. J., Wofsy, S. C., and McElroy, M. B.: Three-dimensional climatological distribution of tropospheric OH: Update and evaluation, J. Geophys. Res., 105 (D7), 8931–8980, 2000.
Talbot, R. W., Dibb, J. E., Scheuer, E. M., Blake, D. R., Blake, N. J., Gregory, G. L., Sachse, G. W., Bradshaw, J. D., Sandholm, S. T., and Singh, H. B.: Influence of biomass combustion emissions on the distribution of acidic trace gases over the southern Pa-cific basin during austral springtime, J. Geophys. Res., 104 (D5), 5623–5634, 1999.
Traub, M., Fischer, H., de Reus, M., Kormann, R., Heland, J., Ziereis, H., Schlager, H., Holzinger, R., Williams, J., Warneke, C., de Gouw, J., and Lelieveld, J.: Chemical characteristics as-signed to trajectory clusters during the MINOS campaign, At-mos. Chem. Phys., 3, 459–468, 2003,
SRef-ID: 1680-7324/acp/2003-3-459.
Warneke, C. and de Gouw, J. A.: Organic trace gas composition of the marine boundary layer over the northwest Indian Ocean in April 2000, Atmos. Environ., 35 (34), 5923–5933, 2001. Wienhold, F. G., Fischer, H., Hoor, P., Wagner, V., Konigstedt, R.,
Harris, G. W., Anders, J., Grisar, R., Knothe, M., Riedel, W. J., Lubken, F. J., and Schilling, T.: TRISTAR – a tracer in situ TD-LAS for atmospheric research, Appl. Phys. B-Lasers and Optics, 67 (4), 411–417, 1998.
Williams, J., Poeschl, U., Crutzen, P. J., Hansel, A., Holzinger, R., Warneke, C., Lindinger, W., and Lelieveld, J.: An atmospheric chemistry interpretation of mass scans obtained from a proton transfer mass spectrometer flown over the tropical rainforest of Surinam, J. Atmos. Chem., 38 (2), 133–166, 2001.
Williams, J., Roberts, J. M., Bertman, S. B., Stroud, C. A., Fehsen-feld, F. C., Baumann, K., Buhr, M. P., Knapp, K., Murphy, P. C., Nowick, M., and Williams, E. J.: A method for the airborne
46 R. Holzinger et al.: Oxygenated compounds in aged biomass burning plumes
measurement of PAN, PPN, and MPAN, J. Geophys. Res., 105 (D23), 28 943–28 960, 2000.
Williams, J., Holzinger, R., Gros, V., Xu, X., Atlas, E., and Wal-lace, D. W. R.: Measurements of organic species in air and seawater from the tropical Atlantic, Geophys. Res. Lett., 31, doi:10.1029/2004GL020012, 2004.
Yokelson, R. J., Goode, J. G., Ward, D. E., Susott, R. A., Babbitt, R. E., Wade, D. D., Bertschi, I., Griffith, D. W. T., and Hao, W. M.: Emissions of formaldehyde, acetic acid, methanol, and other trace gases from biomass fires in North Carolina measured by airborne Fourier transform infrared spectroscopy, J. Geophys. Res., 104 (D23), 30 109–30 125, 1999.
![[PDF] Apprendre la programmation Android avec base de données - Free PDF Download](data:image/gif;base64,R0lGODlhAQABAIAAAP///wAAACH5BAEAAAAALAAAAAABAAEAAAICRAEAOw==)