A validated GC-MS method for the determination and
quantification of residual solvents in counterfeit tablets
and capsules
E. Deconinck1, M. Canfyn1, P.-Y. Sacré1,2, S. Baudewyns1, P. Courselle1, J.O. De Beer1,*
1
Division of food, medicines and consumer safety, Section Medicinal Products, Scientific Institute of Public Health (WIV-ISP)), J. Wytmansstraat 14, B-1050 Brussels, Belgium
²Analytical Chemistry Laboratory, CIRM, University of Liège, Avenue de l’Hôpital 1, B36, B-4000 Liège, Belgium
Abstract:
A fast headspace GC-MS method was developed and validated for the detection and quantification of residual solvents of all three ICH-classes in counterfeit tablets and capsules. The method was validated for ten solvents, selected based on an initial screening of counterfeit medicinal products. The considered solvents were ethanol, 2-propanol, acetone, ethylacetate, chloroform, carbon tetrachloride, benzene, toluene, dichloromethane and ethylbenzene. The proposed method uses a Phenomenex 624 capillary column (60 m x 0.32 mm; 1.8 µm film thickness) (Phenomenex, Torrance, USA) with an oven temperature program from 60°C (held for 5 min) to 270°C at 25 °C/min. 270°C is held for 10 min. The total run time is 23.4 minutes.
The obtained method was fully validated by applying the “total error” profile. Calibration lines for all components were linear within the studied ranges. The relative bias and the relative standard deviations for all components were smaller than 5%, the β-expectation tolerance limits did not exceed the acceptance limits of ±10% and the relative expanded uncertainties were acceptable for all of the considered components.
A method was obtained for the screening and quantification of residual solvents in counterfeit tablets and capsules, which will allow a fast screening of these products for the presence of residual solvents.
Keywords: residual solvents, headspace, GC-MS, counterfeit, method validation *corresponding author: [email protected]
Tel. +32 2 642 51 70 Fax. +32 2 642 53 27
1. Introduction
The analysis of residual solvents in pharmaceutical preparations is an important issue in the quality control of medicines, due to the potential risks for public health. In general the analysis of these solvents consists of a quantitative analysis using gas chromatography, which is used to check the adherence of the products to the limits for residual solvents imposed by the competent authorities. In 1997 the International Committee for Harmonisation issued a guideline for residual solvents [1]. The limits proposed in this guideline have been adopted by the United States Pharmacopoeia [2], the European Pharmacopoeia [3] and the Japanese Pharmacopoeia [4]. The guidelines divide the residual solvents into three classes. Class 1 consists of solvents that should be avoided in pharmaceutical preparations due to their high toxicity, class 2 are the solvents that should be limited and class 3 consists of the solvents with a relatively low toxicity. Following the European Pharmacopoeia [3] the class 1 solvents (e.g. benzene, carbon tetrachloride,…) have limits between 2 and 8 ppm. 1,1,1-trichloroethane is also part of the class 1 solvents due to its environmental hazard. The limit here is up to 1500 ppm. For the class 2 solvents (e.g. chloroform, methanol, hexane,…) the limits vary between 50 and 5000 ppm, while the class 3 solvents (e.g. acetic acid, ethanol, formic acid,…) are limited to 5000 ppm.
The European Pharmacopoeia describes two gas chromatographic methods with static head-space injection and a flame ionisation detector, which allow: the identification of class 1, 2 and 3 solvents, to conduct a limit test and to quantify class 2, with limits higher than 1000 ppm, and class 3 solvents if necessary. The European Pharmacopoeia also allows the use of a mass spectrometer and if needed an electron capture detector for chlorinated solvents of class 1 [3].
Due to the importance of the control of residual solvents in the quality of medicines several methods, applications and issues concerning residual solvents were already published and recently reviewed by Grodowska and Parczewski [5,6]. Despite the extended number of papers published in this domain, it is still an actual subject as is shown by some recent publications by the group of Adams and Van Schepdael [7-9].
Residual solvents are also one of the concerns in the domain of counterfeit medicines. Counterfeit medicines are a growing threat for public health, both in developing as in industrial countries and this due to the extension of the internet [10,11]. The European Agency for Access to Safe Medicines (EAASM) claims that about 50% of the medicines sold through non identified/recognized websites are counterfeit and that 10% of the market in the developing countries and about 1% of the European market is covered by counterfeits [12]. In Europe and the United States the most popular groups of medicines bought through the internet are the phosphodiesterase type 5 (PDE-5) inhibitors and slimming products containing anorexics.
The World Health Organization (WHO) [13] defines a counterfeit drug as: “one which is deliberately and fraudulently mislabelled with respect to identity and/or source. Counterfeiting can apply to both branded and generic products and counterfeit products may include products with the correct ingredients or with the wrong ingredients, without the active ingredients, with insufficient active ingredient or with fake packaging.”
Health risks related to these products can be due to the absence of the active ingredient, the presence of a wrong active substance, a wrong dosage, possible high concentrations of toxic impurities and a combination of (non-approved) active substances. In general counterfeit medicines are evaluated based on an identification and quantification of the active substances and sometimes the determination of some degradation products [14-15]. Due to the fact that the majority of the counterfeit medicines are produced by street laboratories, without respecting the norms of Good Manufacturing Processes (GMP) or other quality norms, and using inferior primary substances, the impurities are more and more of interest for the
evaluation of counterfeit pharmaceutical preparations. For example a preparation can be considered relatively save based on the qualitative and quantitative analysis of the active substance, but can contain high concentrations of potential toxic impurities. One of the groups of impurities, which are of major concern, especially for products used chronically, are the residual solvents.
This paper describes a gas chromatographic method that can be used to identify and quantify residual solvents in pharmaceutical preparations. The method uses a static headspace injector and a mass spectrometer as detection. The method was validated for a group of solvents encountered frequently in counterfeit medicines and over a wide range of concentrations. This due to the fact that it is to be expected that concentrations can be higher compared to regular/genuine pharmaceutical preparations.
2. Methods and materials 2.1. Chemicals and reagents
2-propanol (HPLC grade), dichloromethane (HPLC grade) ethylacetate (pesti-S), acetone (HPLC-grade) ethanol absolute and acetonitril (HPLC grade) were purchased from Biosolve (Valkenswaard, The Netherlands). Chloroform (for gas chromatography), benzene, carbon tetrachloride (CCl4) (for spectroscopy) and ethylbenzene (for gas chromatography) were
purchased from Merck (Darmstadt, Germany) and Toluene (pesticide residues) and cyclohexane from VWR prolabo (Fontenay-Sous-Bois, France). These solvents were used as reference standards. Dimethyl Sulfoxide, used as solvent for the samples was purchased from Merck.
2.2. Instrumental conditions
The samples were injected on a GC-MS system using a G188A headspace sampler (Agilent Technologies, Palo Alto, USA). The analyses were performed on an Agilent 6890N gas chromatograph coupled to an Agilent 5973N mass selective detector. Full automation was achieved using Agilent MSD ChemStation data acquisition and data handling software. After incubation of the sample (5 ml in a 10 ml headspace vial) at 120°C for 15 min, during which it was shaken, 0.5 ml of the vapour phase was injected into the GC/MS system in a split injection mode (split ration 6.8:1). The temperatures of the headspace loop, the transfer line and the EPC volatiles interface were 135, 145 and 160°C respectively. The solvents were separated on a Phenomenex 624 capillary column (60 m x 0.32 mm; 1.8 µm film thickness) (Phenomenex, Torrance, USA). The oven temperature was programmed from 60°C (held for 5 min) to 270°C at 25 °C/min. 270°C is held for 10 min. The total run time is 23.4 minutes. The temperatures of the injection port, the ion source, the quadrupole and the interface were set at 160, 230, 150 and 280°C, respectively. For the identification of the solvents present in the samples the mass spectrometer was operated in full scan mode. For quantification and validation the mass spectrometer was operated in SIM mode (100 ms dwell times). Table 1 presents the specific m/z ratios monitored for each of the selected solvents as well as their retention times and the group start times (opening window) for the SIM mode. For quantification a calibration line was measured and calculated using ordinary least squares regression.
Table1: specific m/z ratios and retention times for the selected solvents
Solvent Specific m/z ratios Group start times (min)
Retention times (min)
Ethanol 45.0 - 5.14 2-propanol 41.0, 43.0, 45.0, 49.0 5.50 5.81 Acetone 41.0, 43.0, 45.0, 49.0 5.50 5.73 Dichloromethane 49.0 5.50 6.33 Ethylacetate 43.1 7.65 7.81 Chloroform 82.9 8.10 8.20 Carbon tetrachloride 56.1, 116.9 8.32 8.63 Benzene 78.1 8.75 8.87 Toluene 91.1 10.70 10.86 Ethylbenzene 106.0 12.20 12.30 2.3. Sample preparations
2.3.1. Preparation of internal standard solution
A stock solution containing 1000 ppm of acetonitril and cyclohexane in dimethylsulfoxide was prepared separately. 1 ml was diluted to 100,0 ml dimethylsulfoxide and used as internal standard. Cyclohexane was used for the quantification of CCl4, benzene, toluene and
ethylbenzene, while acetonitril was used as internal standard for the remaining solvents. The selection of the internal standards was based on an initial screening of counterfeit samples. Both internal standards were not detected or only as traces.
2.3.2. Preparation of standards
One stock solution was prepared containing 1000 ppm of all the selected solvents, besides acetonitril and cyclohexane, in dimethyl sulfoxide. Starting from the stock solutions, dilutions were prepared in the same solvent to obtain standards containing 10, 1 and 0.5 ppm of each solvent. 500 µl of the internal standard solution was added to 5 ml of the standard solutions to obtain concentrations of internal standard of about 1 ppm. The solutions were brought in vials and electronically sealed. Dimethyl sulfoxide was used as blank. The choice of the solvent was based on a preliminary screening of about 150 samples in which dimethyl sulfoxide could not be detected. Therefore it was assumed that dimethyl sulfoxide is not present in the samples.
2.3.3. Preparation of samples
In order to validate the method following, the “total error” approach, blank spiked samples were prepared starting from a stock solution with the same concentrations as the one used for the preparation of the standards. As blank matrix, lactose monohydrate was used, since it is the most used excipient in counterfeit samples of PDE-5 inhibitors and slimming products, the two main groups of counterfeit medicines seized in Belgium. A stock solution for sample preparation, containing 1000 ppm of each solvent, was prepared separately from the one used for the standards. Starting from this stock solution, three samples were prepared with different concentration levels. The selected levels were 0.5, 1 and 10 ppm of each of the selected solvents. Also here 500 µl of the internal standard solution was added to 5 ml of the sample solution. The solutions were brought in vials and electronically sealed.
For the analysis of tablets, the tablets were broken in two before addition of 5 ml of dimethylsulfoxide. Tablets were broken because of the coating of some of the tablets, possibly preventing the recovery of the residual solvents. To this solution 500 µl of the internal standard solution was added. Capsules were opened before addition of the solvent.
2.4. Method validation
The method validation was performed in accordance with the requirements of the ISO17025 guideline using the total error approach [16-19].
2.5. Statistics
The statistical analysis was performed using Microsoft Excel 2003. 3. Results
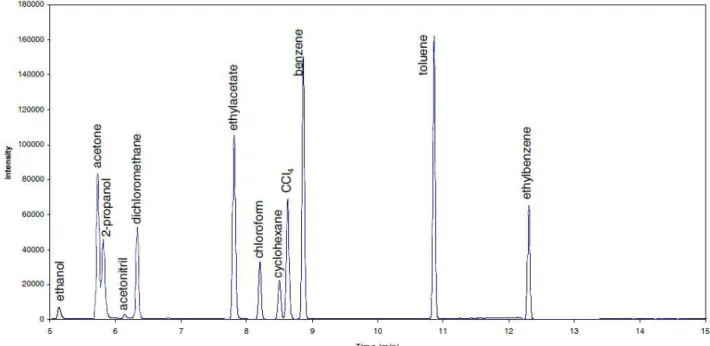
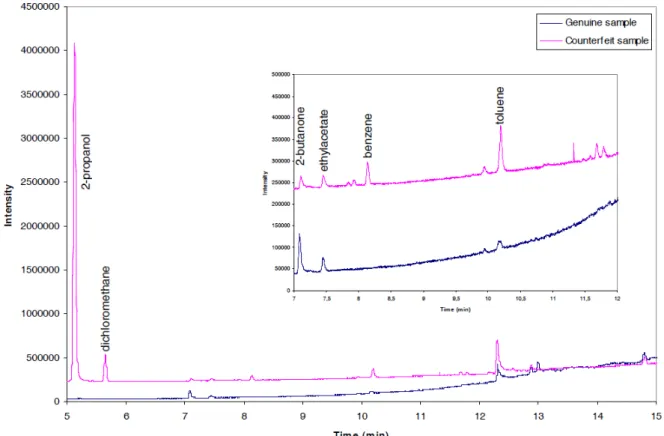
The method as described in section 2.2 was applied to standards and samples. Figure 1 shows the chromatogram as obtained for a standard solution containing the ten selected solvents for validation and the two internal standards. The chromatogram was recorded in full scan mode. Figure 2 gives an example of a chromatogram obtained for a genuine sample compared to the one obtained for a corresponding counterfeit sample. As example a genuine and a counterfeit tablet of Viagra® was used. Both chromatograms were recorded in full scan mode. The chromatograms show a clear difference in the amounts of residual solvent difference and so in the risk they can represent to public health. The presence of 2-butanone in both genuine as counterfeit sample is due to the fact that it is originating from the synthesis of sildenafil.
Figure 1: Chromatogram of a standard solution containing all the selected solvents. The chromatogram was
Figure 2: Chromatograms obtained for a genuine and a counterfeit samples in full scan mode.
3.1. Selectivity
The selectivity of the detection was ensured by monitoring the specific ions of the residual solvent in selective ion monitoring (SIM) mode of the mass spectrometer.
3.2. Linearity of the calibration line
For all ten solvents three calibration standards were prepared in order to evaluate the relationship between the area under the curve and the concentration. The linearity of the relationship was evaluated for each of the components in a concentration range of 0.5 to 10 ppm, covering the range in which residual solvent analysis is usually performed.
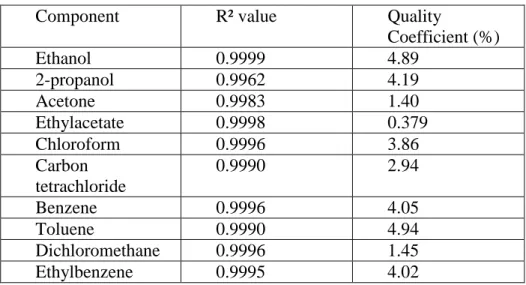
The calibration curves were obtained using ordinary least-square linear regression and the linearity was confirmed with the R² values and a quality coefficient [20]. Table 2 summarizes for the twelve solvents the R² values and the quality coefficients. For all curves the g values were below 0.01 [21]. From this table it can clearly been concluded that the calibration curves for all components are linear within the chosen concentration ranges.
3.3. Trueness, precision, accuracy and uncertainty assessment
A statistical approach based on the “total error” profiles was applied to validate the method. As explained in section 2.3.2 spiked blank samples were prepared at three concentration levels. For the different solvents the blank sample (lactose) was spiked with amounts of solvent resulting in concentrations of respectively 0.5, 1 and 10 ppm. Every sample was prepared in triple and analysed for three consecutive days.
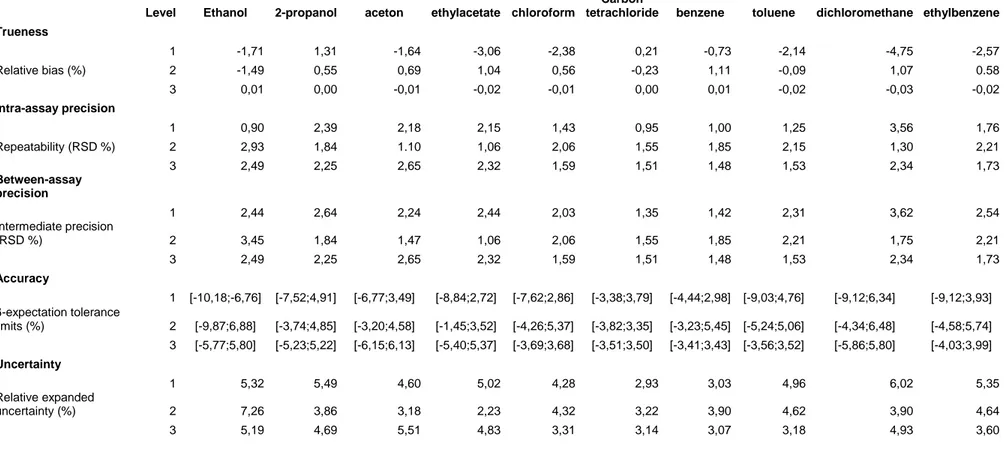
The concentrations of the spiked samples were back-calculated using the calibration lines, prepared as described in section 2.3.1., to determine the linearity between theoretical and measured concentrations, the mean relative bias, the repeatability, the intermediate precision, the β-expectation tolerance or total error intervals at the 5% level and the measurement uncertainty. All results are shown in table 3.
Table 2: summary of the quality of the calibration curves for the different solvents
Component R² value Quality
Coefficient (%) Ethanol 0.9999 4.89 2-propanol 0.9962 4.19 Acetone 0.9983 1.40 Ethylacetate 0.9998 0.379 Chloroform 0.9996 3.86 Carbon tetrachloride 0.9990 2.94 Benzene 0.9996 4.05 Toluene 0.9990 4.94 Dichloromethane 0.9996 1.45 Ethylbenzene 0.9995 4.02
The relationship between the theoretical and the calculated concentrations for each of the ten solvents is clearly linear with R²-values from 0.9994 to 1.000.
Trueness (ISO definition) refers to the closeness of agreement between the average of the obtained values and the known exact concentration of the spiked samples and is a measure for the systematic errors of the method [19]. It is expressed in terms of relative bias. From table 3 it can be concluded that the trueness for all components is acceptable since the relative bias is always smaller than 5%. Five percent is accepted, since we are working with GC-MS, which is a semi quantitative method.
The precision is a measure for the relative errors of the method and is expressed as the relative standard deviations (RSD) for repeatability and intermediate precision. From table 3 it can be seen that an acceptable precision is obtained for all solvents. The maximal RSD is obtained for the intermediate precision for dichloromethane and is 3.62%.
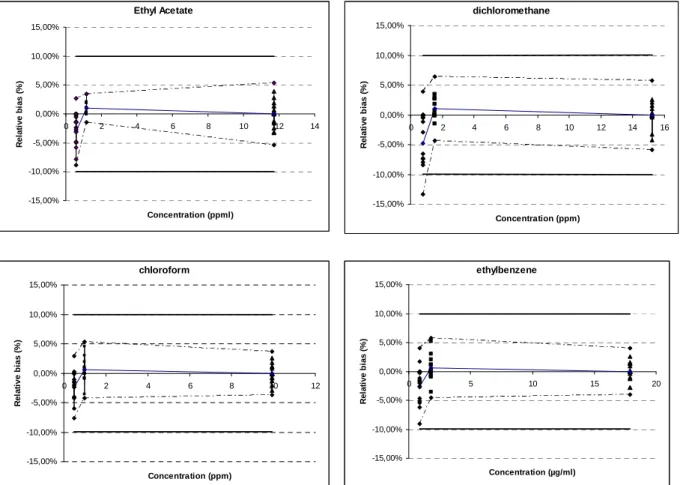
Accuracy takes into account the total error of the test results and is represented by the β -expectation tolerance intervals. The acceptance limits for the bias were set at ±10 %. As shown in table 3 and figure 3 the relative β-expectation tolerance intervals did not exceed the acceptance limits, except for the lowest level of ethanol (0.5 ppm). Since ethanol is a class 3 solvent and the fact that concentrations can be augmented for quantification when ethanol is detected, this is not considered a problem. This means that each future measurement of unknown samples will be included in the tolerance limits for the relative bias at the 10% level.
The uncertainty represents the dispersion of the values that could reasonably be attributed to the analyte. The expanded uncertainty represents an interval around the results where the unknown true value can be observed with a confidence level of 95%. The relative expanded uncertainties (%) are obtained by dividing the corresponding expanded uncertainties with the corresponding concentrations. Results are shown in table 3.
Table 3: Trueness, precision, accuracy and uncertainty
Level Ethanol 2-propanol aceton ethylacetate chloroform
Carbon
tetrachloride benzene toluene dichloromethane ethylbenzene Trueness 1 -1,71 1,31 -1,64 -3,06 -2,38 0,21 -0,73 -2,14 -4,75 -2,57 Relative bias (%) 2 -1,49 0,55 0,69 1,04 0,56 -0,23 1,11 -0,09 1,07 0.58 3 0,01 0,00 -0,01 -0,02 -0,01 0,00 0,01 -0,02 -0,03 -0,02 Intra-assay precision 1 0,90 2,39 2,18 2,15 1,43 0,95 1,00 1,25 3,56 1,76 Repeatability (RSD %) 2 2,93 1,84 1.10 1,06 2,06 1,55 1,85 2,15 1,30 2,21 3 2,49 2,25 2,65 2,32 1,59 1,51 1,48 1,53 2,34 1,73 Between-assay precision 1 2,44 2,64 2,24 2,44 2,03 1,35 1,42 2,31 3,62 2,54 Intermediate precision (RSD %) 2 3,45 1,84 1,47 1,06 2,06 1,55 1,85 2,21 1,75 2,21 3 2,49 2,25 2,65 2,32 1,59 1,51 1,48 1,53 2,34 1,73 Accuracy 1 [-10,18;-6,76] [-7,52;4,91] [-6,77;3,49] [-8,84;2,72] [-7,62;2,86] [-3,38;3,79] [-4,44;2,98] [-9,03;4,76] [-9,12;6,34] [-9,12;3,93] β-expectation tolerance limits (%) 2 [-9,87;6,88] [-3,74;4,85] [-3,20;4,58] [-1,45;3,52] [-4,26;5,37] [-3,82;3,35] [-3,23;5,45] [-5,24;5,06] [-4,34;6,48] [-4,58;5,74] 3 [-5,77;5,80] [-5,23;5,22] [-6,15;6,13] [-5,40;5,37] [-3,69;3,68] [-3,51;3,50] [-3,41;3,43] [-3,56;3,52] [-5,86;5,80] [-4,03;3,99] Uncertainty 1 5,32 5,49 4,60 5,02 4,28 2,93 3,03 4,96 6,02 5,35 Relative expanded uncertainty (%) 2 7,26 3,86 3,18 2,23 4,32 3,22 3,90 4,62 3,90 4,64 3 5,19 4,69 5,51 4,83 3,31 3,14 3,07 3,18 4,93 3,60
Ethanol -15,00% -10,00% -5,00% 0,00% 5,00% 10,00% 15,00% 0 2 4 6 8 10 12 Concentration (ppml) R e la ti v e b ia s ( % ) carbon tetrachloride -15,00% -10,00% -5,00% 0,00% 5,00% 10,00% 15,00% 0 2 4 6 8 10 12 Concentration (ppm) R e la ti v e b ia s ( % ) 2-propanol -15,00% -10,00% -5,00% 0,00% 5,00% 10,00% 15,00% 0 2 4 6 8 10 12 14 Concentration (ppml) R el a ti v e b ia s ( % ) Benzene -15,00% -10,00% -5,00% 0,00% 5,00% 10,00% 15,00% 0 2 4 6 8 10 12 Concentration (ppm) R e la ti v e b ia s ( % ) Aceton -15,00% -10,00% -5,00% 0,00% 5,00% 10,00% 15,00% 0 2 4 6 8 10 12 Concentration (ppm) R e la ti ve b ias ( % ) tolueen -15,00% -10,00% -5,00% 0,00% 5,00% 10,00% 15,00% 0 2 4 6 8 10 12 14 Concentration (ppm) R e lat ive b ia s ( % )
Ethyl Acetate -15,00% -10,00% -5,00% 0,00% 5,00% 10,00% 15,00% 0 2 4 6 8 10 12 14 Concentration (ppml) R el a ti v e b ia s ( % ) dichloromethane -15,00% -10,00% -5,00% 0,00% 5,00% 10,00% 15,00% 0 2 4 6 8 10 12 14 16 Concentration (ppm) R e la ti v e b ia s ( % ) chloroform -15,00% -10,00% -5,00% 0,00% 5,00% 10,00% 15,00% 0 2 4 6 8 10 12 Concentration (ppm) R e la ti ve b ias ( % ) ethylbenzene -15,00% -10,00% -5,00% 0,00% 5,00% 10,00% 15,00% 0 5 10 15 20 Concentration (µg/ml) R e la ti v e b ia s ( % )
Figure 3: Accuracy profile of ten solvents. The plain line is the relative bias, the dashed lines are the β -expectation tolerance limits, the bold plain line are the acceptance limits (10%) and the dots represent the
relative back-calculated concentrations, plotted with respect to their targeted concentration. 3.4. Limits of detection and quantification (LOD AND LOQ)
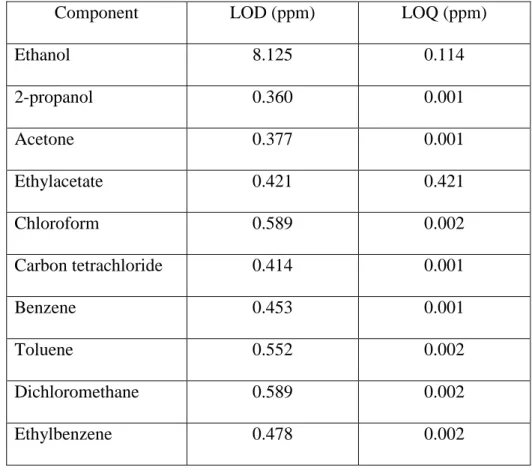
The LOD and LOQ were determined using the signal to noise ration (S/N) method. This approach consists in measuring the peak-to-peak noise around the retention time of the considered analyte, followed by an estimation of the concentration of the analyte that would result in a predetermined value for S/N. In general an S/N value of 3 is accepted for the estimation of the LOD and an S/N value of 6 for the LOQ. In practise blank samples, spiked with decreasing amounts of the analyte are analysed. The lowest concentrations fulfilling the S/N criteria are the LOD and LOQ. Table 4 gives an overview of the estimated LOD/LOQ for each of the considered solvents. The LOD was determined using the screening method (the total ion current), while the LOQ was determined using the quantification method in SIM mode.
3.5. Recovery
The absolute recoveries of the ten solvents were determined at the three concentration levels used to construct the accuracy profile. The recoveries were determined by analysing spiked blank samples and calculating their concentrations using calibration lines in analogy with what was done for the accuracy profile. The mean recoveries for all ten solvents considered in the validation are ranging from 99.2 to 100.5 %. The recoveries are within the limits of 98.5 and 101.5%, indicating that the method is suited for the analysis of the considered residual solvents in pharmaceutical preparations.
Table 4: Estimated values for LOD (TIC-mode, screening) and LOQ (SIM-mode, quantification) for the
different solvents
Component LOD (ppm) LOQ (ppm)
Ethanol 8.125 0.114 2-propanol 0.360 0.001 Acetone 0.377 0.001 Ethylacetate 0.421 0.421 Chloroform 0.589 0.002 Carbon tetrachloride 0.414 0.001 Benzene 0.453 0.001 Toluene 0.552 0.002 Dichloromethane 0.589 0.002 Ethylbenzene 0.478 0.002 4. Conclusions
A fast approach for the screening and the quantification of residual solvents in counterfeit tablets and capsules was developed and validated. The validation was performed following the ISO17025 requirements and proved that the method was suited for purpose and can be used in the routine analysis of these pharmaceutical preparations. For the validation a set of ten residual solvents was selected, based on an initial screening of a set of counterfeit samples. Nevertheless the method is suited for the detection and quantification of all residual solvent described in the European Pharmacopoeia [3], since the ten selected solvents cover the whole range of the chromatogram.
The method uses a Phenomenex 624 capillary column (60 m x 0.32 mm; 1.8 µm film thickness) (Phenomenex, Torrance, USA) and an oven program starting from 60°C (held for 5 min) to 270°C at 25 °C/min. 270°C is held for 10 min. The temperatures of the injection port, the ion source, the quadrupole and the interface were set at 160, 230, 150 and 280°C, respectively.
The method was applied in the analysis of routine samples at our lab and showed a good overall performance. Just as example table 5 shows the results obtained for a few tablets of professional and non-professional imitations of Viagra® analysed at our lab. The table represents only the selected solvents in this study, since the selection was based on this group of counterfeits (Viagra®). It is clear that the screening and quantification method can also be
the identification and the quantification of the active substances and sometimes the presence of analogs and degradation products. We are strongly convinced that in the future the governmental institution should turn to a more complete risk evaluation of counterfeit samples where, besides the active ingredients also secondary ingredients should be taken into account, like impurities originating from the manufacturing process. Residual solvent screening fits in this idea, since high levels of residual solvents can be considered an important threat to public health.
Table 5: residual solvent content for 10 professional en non professional imitations of Viagra® (sildenafil) tablets analysed with the proposed method. (“-“ indicates an amount lower than the quantification limit)
sample Ethanol (ppm) 2-propanol (ppm) Acetone (ppm) Ethyl acetate (ppm) Chloroform (ppm) CCl4 (ppm) Benzene (ppm) Toluene (ppm) Dichloromethane (ppm) Ethylbenzene (ppm) 1 - 184.9 20.5 - - - - 2 - 1112.7 7.7 - - - - 3 - 333.7 4.9 - - - 3.2 - 4 - 301.7 16.1 - - - 6.8 - 5 - 23.2 217.0 - - - - 6 - 563.8 22.3 - - - 5.9 - 7 858.6 22.9 0.7 10.6 - - - - 8 25.5 4.8 7.4 - - 7.8 - - - - 9 27.4 116.5 63.8 - - 47.0 - - - - 10 - 140.6 5.3 - - - -
References
[1] International Conference on Harmonisation (ICH) of Technical Requirements for the Registration of Pharmaceuticals for Human Use, Q3C: impurities: Guidelines for Residual Solvents, Step 4 (1997)
[2] United States Pharmacopoeia 35, United States Pharmacopeial Convention, Inc., Rockville, MD, USA (2010)
[3] European Pharmacopoeia 7.0 (2010), Council of Europe, Strasbourg, France
[4] Japanese Pharmacopoeia, 16th ed., Society of Japanese Pharmacopoeia, Tokyo (2011) [5] K. Grodowska, A. Parczewski, Organic solvents in the pharmaceutical industry, Acta Pol. Pharm. 67 (2010), 3-12
[6] K. Grodowska, A. Parczewski, Analytical methods for residual solvents determination in pharmaceutical products, Acta Pol Pharm. 67 (2010), 13-26
[7] W. D'Autry, C. Zheng, K. Wolfs, S. Yarramraju, J. Hoogmartens, A. Van Schepdael, E. Adams, Mixed aqueous solutions as dilution media in the determination of residual solvents by static headspace gas chromatography, J. Sep Sci. 34 (2011),1299-1308
[8] W. D'Autry, C. Zheng, J. Bugalama, K. Wolfs, J. Hoogmartens, E. Adams, B. Wang, A. Van Schepdael, Liquid paraffin as new dilution medium for the analysis of high boiling point residual solvents with static headspace-gas chromatography, J. Pharm. Biomed. Anal. 55 (2011), 1017-1023.
[9] W. D'Autry, K. Wolfs, J. Hoogmartens, E. Adams, A. Van Schepdael, Improving quantitative gas chromatography-electron ionization mass spectrometry results using a modified ion source: demonstration for a pharmaceutical application, J. Chromatogr. A 18 (2011), 4034-4038.
[10] A. Weiss, Buying prescription drugs on the internet: promises and pitfalls, Cleve. Clin. J. Med. 73 (2006), 282-288.
[11] M. Veronin, B.-B. Youan, Magic bullet gone astray: medications and the internet, Science 305 (2004) 481.
[12] European Alliance For Acces to Safe Medicines: www.eaasm.eu
[13] WHO, sixty-second world health assembly item 12.9, counterfeit medical products, april 2009. http://aps.who.int/gb/ebhwa/pdf_files/A62/A62_13-en.pdf
[14] P.Y. Sacré, E. Deconinck, P. Chiap, J. Crommen, E. Rozet, P. Courselle, J. O. De Beer, Development and validation of a UHPLC-UV method for the detection and quantification of erectile dysfunction drugs and some of their analogues found in counterfeit medicines, J. Chromatogr. A 1218 (2011) 6439-6447.
[15] E. Deconinck, K. Verlinde, P. Courselle, J. De Beer, A validated Ultra High Pressure Liquid Chromatographic method for the characterisation of confiscated illegal slimming products containing anorexics, J. Pharm.Biomed. anal. 59 (2012) 38-43.
[16] EN ISO/IEC 17025 (2005) General requirements for the competence of testing and calibration laboratories (www.iso.org)
[17] M. Fienberg, Validation of analytical methods based on accuracy profiles, J. Chromatogr. A 1158 (2007), 174-183.
[18] M. Feinberg, M. Laurentie, A global approach to method validation and measurement uncertainty, Accred Qual Assur 11(2006), 3-9.
[19] B. De Backer, B. Debrus, P. Lebrun, L. Theunis, N. Dubois, L. Decock, A. Verstraete, P. Hubert, C. Charlier, Innovative development and validation of an HPLC/DAD method for the qualitative and quantitative determination of major cannabinoids in cannabis plant material, J. chromatogr. B 877 (2009), 4115-4124.
[20] J.O. De Beer, T.R. De Beer, L. Goeyens, Assessment of quality performance parameters for straight line calibration curves related to the spread of the abscissa values around their mean, Anal Chim Acta. 584 (2007) 57-65
[21] J.O. De Beer, C. Naert, E. Deconinck, the quality coefficient as performance assessment parameter of straight line calibration curves in relationship with the number of calibration points., Accred. Qual. Assur. In press, DOI: 10.1007/s00769-011-0871-1