JOURNAL OF GEOPHYSICAL RESEARCH, VOL. 91, NO. A9, PAGES 10,136-10,140, SEPTEMBER 1, 1986
AE-D Measurements
of the NO Geomagnetic
Latitudinal Distribution
and
Contamination by N +(sS) Emission
J. C. G•RARD AND C. E. NOEL
Institut d'Astrophysique, Universitd de Lidge, Lidge-Ou•r•e, Bel•lium
Measurements
of the
NO 7 (1,
0) band
resonance
scattering
distribution
obtained
with
the
Atmosphere
Explorer D satellite have been inverted to generate maps of the meridional distribution of nitric oxide
between
90 and
160
km.
It is shown
that
the
results
are
better
organized
in terms
of geomagnetic
rather
than
geographic
latitudes,
especially
at high
latitudes.
In particular,
the
presence
of an œ region
maxi-
mum associated with the summer auroral zone is clearly demonstrated. The existence below the NO
peak
of larger
concentrations
in the
winter
than
in the
summer
hemisphere
is also
observed.
Comparison
between
calculations
and
rocket
observations
of the
2143-A
doublet
emission
indicates
that
the
quantum
yield
of N+(sS)
is considerably
less
than
unity.
The
possible
contamination
of the
observations
by this
emission is shown to be negligible in these observations.
INTRODUCTION
Satellite observations of the fluorescence of the nitric oxide
Jands have provided information about the vertical and lati- tudinal distribution of thermospheric NO and its dependence on geophysical factors such as season, solar activity, and local time. The NO ultraviolet spectrometer (UVNO) on the Atmo- sphere Explorer C and D satellites [Barth et al., 1973] in
particular
measured
the intensity
distribution
of the (1, 0) y
band centered
near 2149 ,t,. High-latitude
observations
ob-
tained on AE-D despun orbits were analyzed by Cravens [1981], whereas Cravens et al. [1979] presented measurements at 200 km from AE-C despun orbits.
Data obtained with AE-D in the spinning mode were re- cently presented by Cravens et al. [1985]. They provide a data base describing the statistical distribution of thermospheric NO at solstice during the period of very low solar activity that prevailed during the AE-D mission. The measurements de- scribed in that paper were presented in terms of contour plots of the NO concentrations versus altitude and geographic lati- tude. They showed a maximum concentration near 110 km with a peak density minimum near 40øN and increasing with latitude in both hemispheres. However, a steeper gradient was observed in the northern (winter) hemisphere. Since particle precipitations are known to be responsible for the increase of the NO density in the polar regions, it is of interest to analyze the NO distribution in geomagnetic coordinates to verify the existence of a high-latitude maximum associated with the sta-
tistical location of the auroral zones.
We also investigate the question of the potential contami- nation of the fluorescence scattering measurements of the NO
(1, 0) y band by the 2143-,1,
emission
originating
from the
N+(sS)
doublet.
This
emission
was
first
observed
in the spec-
trum of the ultraviolet aurora by Duysinx and Monfils [1972] and Sharp and Rees [1972] and later identified as the N+(SS)
3P2-5S
2 doublet
by Dick [1978].
Its intensity
in the ultraviolet
dayglow was measured from a rocket by Barth and Steele [1982] and recently from Spacelab 1 by Tort and Tort [1985a]. Calculations by Victor and Dalgarno [1982] indicat-
Copyright 1986 by the American Geophysical Union.
Paper number 5A8288. 0148-0227/86/005 A- 8288 $05.00
ed that its presence in the passband of ultraviolet spec- trometers may contribute to the signal assigned to the (1, 0) gamma band at high altitudes. It is presumably excited by electron impact dissociative ionization in the aurora and diss- ociative ionization by photons with energy above 329 ,• in the dayglow. We examine whether contamination of the present
AE-D NO gamma
measurements
by the NII 2143-,•
dayglow
emission is significant.
INVERSION OF THE VERTICAL PROFILES
The data set analyzed in this study is identical to that used by Cravens et al. [1985] to investigate the distribution of the NO horizontal column density. Its characteristics were de- scribed by Cravens et al. [1985] and will only be summarized below. The measurements were collected on AE-D spinning orbits from late November 1975 to early February 1976. The local time of the perigee shifted approximately from 1000 at 70øN to 0530 at the South Pole. In order to preserve a vertical resolution better than 10 km at the NO peak and to avoid any significant contamination by the N+(SS) doublet, only data collected when the spacecraft was between 200 km and perigee were considered in this study.
In order to improve the statistics, three consecutive spins were added together to form a vertical profile. Data points were subsequently filtered out, averaged, or rejected, depend- ing on the quality of the data. The Rayleigh scattering contri- bution was removed by fitting an exponentially decreasing curve to the signal measured at a tangent ray height of 75 km. Figure 1 shows an example of a vertical NO profile measured at low latitudes. The total number of counts, the subtracted Rayleigh scattering, and the resulting difference are plotted as a function of the altitude of the minimum ray height. In this profile the Rayleigh scattering contribution becomes negligible above 120 km and reaches about 25% of the total signal near 100 km. The NO and the Rayleigh scattering contributions are equal at 90 km, and at 80 km, virtually all the signal is due to Rayleigh scattering. The relative magnitude of the two con- tributions depends on the NO amount and the solar zenith angle. In the most unfavorable case the Rayleigh scattering signal contributes about 50% of the total of the NO peak. The intersection of the Rayleigh scattering and corrected NO signal is always located between 90 and 95 km. The Rayleigh scattering contribution remains below 1% above 120 km. An-
G•RARD AND NOEL' AE-D GEOMAGNETIC LATITUDINAL DISTRIBUTION OF NO 10,137 120 100 80 60 Orbit: 902 Lat.: 2.5 øS I I 2 2.5 3 3.5 Log10C
Fig. 1. Plot of the decimal logarithm of the counting rate (counts/21 ms) measured on a low-latitude profile by the UVNO experiment. The dotted line shows the total signal, the dashed line is the subtracted Rayleigh scattering contribution, and the solid line represents the difference. The error bars indicate the standard devi-
ation of the count rate.
other effect of the removal of the Rayleigh scattering contri- bution is to slightly increase the altitude of the NO maximum compared to the uncorrected profiles.
Counts were then converted into NO horizontal column
densities by combining the curve of growth of the NO 7 (1, 0)
emission rate with the instrumental sensitivity. Finally, a total
of 1325
profiles
of the NO horizontal
column
versus
al•titude
of the tangent point entered the dat a set.
As the line of sight of the telescope scans the limb below the spacecraft, a series of column emission rates 4zrl are obtained.
They are related to the NO density by the relationship
4rrl(z)
= 10-6g
f;•
n(s)ds
(1)where ds is the element along the line of sight, n the local NO concentration, and g the emission rate factor equal to 7.7
x 10 -6 s-• for the optically thin (1, 0) NO 7 band. Because of possible self-absorption, g depends on the NO colpmn density between the sun, the scattering volume, and the satellite. The
relationship
given
by Stewart
and Cravens
[1978], corrected
for the AE-D instrument sensitivity, is adopted.
If the spacecraft altitude is substantial!y larger than the - tangent ray p and assuming spherical symmetry, equation (1)
may
be written
in the
form
of a Fredholm
integral
equation
of
the
first
kind'
• 140
'-
4hi(p)
= 2 x 10⁻⁶g n(r)r
(r
2 _ p2)t/2
dr
(2) '• 130-
where
n(r)
is the
geocentric
NO vertical
distribution
and
r the
120-'
radial distance. 11 o z
Various numerical methods (substitution, least squares ap-
proximation,
iterativei
may
be used
to invert
equation
(2).
100-
However,
this
relation
is an Abel
integral
equ•ation
which
has
go
-
an analytical solution given by
1 d
f•o•
4hi(p)
r dp
n(r)
= -2 x 10⁻⁶gK
d• (p2
__
r2)1/2
p
(3)Roble and Hays [1972] gave a method to solve (3) numeri-
cally. Equation (3) is first written in the equivalent form;
1 f•o•
d(4nI)/dp
n(r)
= 2 x 10⁻⁶g•z
(p2
__
r2)1/2
dp
(4)
A function f(p) representing 4hi is then locally fitted to the measurements over N adjacent data points using a least squares method. The derivative inside integral (4) may then be obtained analytically, and the integral is replaced by a discrete sum. In the case of the AE-D data a quadratic form was used for f(p), and the smoothing parameter N was taken equal to 5, a compromise between statistical noise smoothing and spatial resolution.
LATITUDINAL DISTRIBUTION
The Abel inversion (4) using the numerical procedure de- scribed above was applied to all the individual intensity pro- files of the data set. The resulting NO density data points were then sorted into 5ø-latitude by 2-km-altitude bins. The data in each bin were averaged, and a contour map of NO con-
centrations was constructed with the inverted data. The distri-
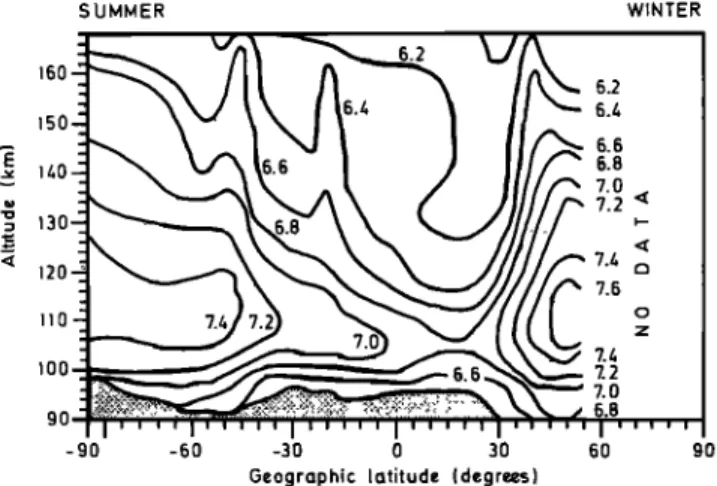
bution versus geographic latitude is shown in Figure 2. As expected, it is very similar to the map in Figure 14 by Cravens et al. [1985], although the inversion was made using a differ- ent method. It shows a clear latitudinal NO gradient with minimum values less then 1 x 10 7 cm -3 near 20øN, rising
more steeply
in the northern
hemisphere.
Comparison
with
Cravens et al. [1985], however, indicates that the present
number densities are somewhat less than their values. This
may be explained in part by the fact that although they orig- inate from the same global data base, the two data sets are not identical. Besides, in this work the Rayleigh scattering contri-
bution was subtracted from the low-altitude signal, in contrast to the previous results.
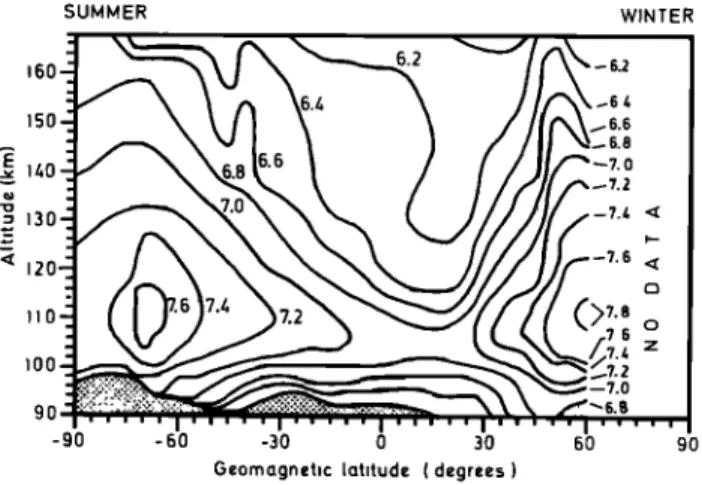
Figure 3 shows the same inverted data, organized in geo- magnetic latitudes. Several interesting differences from Figure 2 are observed. The most conspicuous one is seen at high
summer latitudes, where a clear maximum is now obtained
near 70øS.
This peak
in the southern
auroral
zone
is associ-
ated with the effects of the high-energy particle precipitations, which generate odd nitrogen in the lower thermasphere through direct and indirect N 2 dissociation. This maximum, predicted by two-dimensional models [GErard et al., 1984; G•rard and Roble, 1986], is not clearly apparent in Figure 2,
SUMMER WINTER 6.4 6.6 6.8 7.0 7.2 <• 7.4 r• 7.6 7.4 7.2 7.0 I .... I''''' I '' '' I .... '1 '' ' ' ... -90 -60 -30 0 30 60 90
Geographic latitude (degrees)
Fig. 2. Contour plot in geographic latitudes of 1ogx0 of the nitric oxide concentration (per cubic centimeters) obtained by inverting the
10,138 G•zRARD AND NO•L' AE-D GEOMAGNETIC LATITUDINAL DISTRIBUTION OF NO summER WINTER 6.• .-6.4
•0:
6 7.
•?.• •
ioo -90 -60 -30 0 30 60 90Geomagnetic latitude (degrees)
Fig. 3. Same as Figure 2 in geomagnetic latitudes. where the latitudinal distribution is spread out by the use of geographic coordinates. It is thus clear that geomagnetic lati- tude is a more appropriate coordinate than geographic lati- tude to represent the high-latitude thermospheric NO distri- bution. The low-latitude part of the map is virtually un- changed. In the winter hemisphere the contours suggest that another peak may exist at latitudes higher than 60øN. The lack of high-latitude winter data is inherent in the experi- mental method, which requires the observed region to be sunlit.
Another feature, common to both figures, is the large NO density below the NO peak observed at latitudes higher than 40øN in contrast to the low values below 100 km at high summer latitudes. This is also in agreement with model calcu- lations, which predict a stronger downward flow of NO into the mesosphere in the winter than in the summer regions. It is also consistent with the trend which may be deduced from the comparison of NO rocket measurements at various latitudes [G•rard and Deneye, 1984]. It is probably a consequence of the large diurnally averaged photolysis rate of nitric oxide by
solar radiation
near 1980 A. Another
possible
factor is the
seasonal dependence of the strength of downward turbulent transport [Garcia and Solomon, 1985].
In addition to the natural variability of nitric oxide, the main sources of error are (1) the statistical photon noise in the
limb scans, whose standard deviation is between 3 and 10% of
the measured count rate, (2) the presence of stars undetected by the filtering procedure, which may erroneously increase the value of some data points, and (3) the inversion procedure itself, which introduces an error that depends on the statistical noise, the smoothing parameter N, and the interval between
successive samples.
The variability of the derived NO density is illustrated in Figure 5, where the standard deviation of the concentration is shown for three different latitude bins at 130 km and at the
altitude of the maximum. It is of the order of 100% at both
altitudes. The standard deviation of the altitude of the peak is shown to be about 5 km. It is clear that the natural variability of NO exceeds by far the other sources of uncertainties de- scribed above.
CONTAMINATION BY THE N+(sS) EMISSION Victor and Dalgarno [1982] suggested that the excitation of
metastable
N+(sS) ions in the sunlit atmosphere
proceeds
through the process
N2 + hv-• N+(sS) + NOS) + e- (5)
They indicated that the cross section for this process may be estimated by assuming that each removal of an electron on the 2s% orbital of N2 leads to the production of an N+(5S) ion. The excitation cross section aN+ for this removal may be ob- tained from the differential oscillator strength for removal of 2s% electrons measured by Wight et al. [1976] up to 50 eV.
Thus
the rate of N +(5S)
ion production
is given
by
P[N
+(5S)]
= [N2]a
fo
•
•rF(•)O'N+(• ) d• (6)where
e is the yield
of N+(SS)
ions
in the 2s% electron
re-
moval,
'•m
the energy
threshold
equal
to 329 ,•, and ztF(,•)
the
attenuated solar irradiance. The volume emission rate r/ is
deduced
from (6) assuming
that N+(sS) is quenched
by N 2
with a deactivation coefficient k--2.5 x 10 -9 cm 3 s -•[Knight, 1982].
A determination of the value of e may be obtained by ana- lyzing the rocket observations by Barth and Steele [1982]. This measurement of ultraviolet dayglow was made in No- vember 1981 for a solar zenith angle of 61.7 ø at a latitude of
40øN. At 200 km the measured emission rate was 333 + 67 R at a zenith angle of 87.6 ø ñ 0.5 ø. Since the EUV solar fluxes derived from Atmosphere Explorer observations were recently revised, we reanalyze the observations of Barth and Steele, carefully considering the geometry of the observations. In these calculations the solar irradiances are calculated using the revised solar fluxes recently published by Tort and Tort [1985b] and the effective absorption cross sections given by Tort et al. [1979]. The neutral atmosphere densities are ob- tained from the modified mass spectrometer/incoherent scatter model atmosphere [Hedin, 1983].
Using the geophysical parameters appropriate to the time of the observations (F10.7 - 235, F10.7 = 216, Ap = 4) and the solar fluxes given by Torr and Torr [1985b] appropriately scaled to the value of F10.7, the vertical distribution of r/ is calculated and integrated from 200 km along the line of sight of the instrument. The calculated volume emission rate
reaches
a peak of 54 ph/cm
3 s at 195 km (Fighre
4). The
integrated column emission rate is 3.65 kR with limits of 3.53øø
I ' 'L,' ' ,
,
28ø
I
",,,
•
-
_
•80 120 10-2 10 -• •0 o 10 • N*{•51 Volume emission rate (cm-•s-•!Fig. 4. Calculated vertical distribution of the NII 2143-/1. volume
emission rate for the conditions of the Barth-Steele rocket measure- ments (solid line) and for the AE-D UVNO observations (dashed line). The solar zenith angle for both curves is 67.1 ø, and the N+(SS)
GI•RARD AND NOEt.' AE-D GEOMAGNETIC LATITUDINAL DISTRIBUTION OF NO 10,139 •60 ,so 130 120 11o IOO
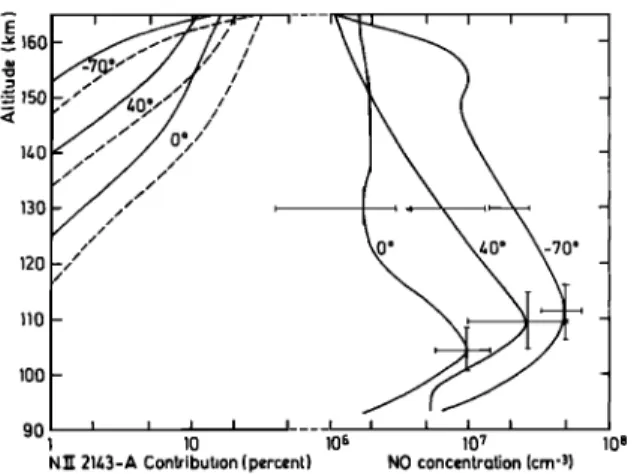
Fig. 5. Three examples of NO vertical profiles averaged over 5 ø of
latitude and corresponding calculated contamination by the N+(sS) doublet. The fractional contribution of the 2143-,• doublet is plotted for three different latitudes and two values of the N +(5S) yield e = 0.1
(solid lines) and 0.2 (dashed lines).
and 3.9 kR. Comparing this value to the experimental result, a
value e = 0.09 is obtained. This value is substantially smaller than the 18% derived from the comparison of the same exper-
imental data with the calculations by Victor and Dalgarno [1982]. The difference between the two calculations is trace- able to the zero optical depth production efficiency and thus to the solar fluxes used. Values of 1.6 x 10 -8 s-• for solar minimum and 2.4 x 10 -8 s-• for solar maximum are given by
Victor and Dalgarno,
whereas
our values
are 1.2 x 10
-8 and
3.9 x 10 -8 s-•, respectively. Slightly different N2 densities and a somewhat different extrapolation toward short wave- lengths of Wight et al.'s [1976] measurements may also con-
tribute to the difference. A value of 20% was also deduced for
e by Torr and Torr [1985a], based on Spacelab 1 limb scan-
nings of the 2143-,• emission
made with an imaging
spec-
trometer at a resolution of 2.5 ,•. However, these measure-
ments were made for unfavorable conditions near the termina-
tor where the solar zenith angle changed by over 13 ø during the vertical scans.
In summary, dayglow observations of the N+(•S) emission
indicates
that the yield
of N +(5S)
ions
is considerably
less
than
unity, based on the measurements of Wight et al. [1976]. Rocket and Spacelab obsei'vations give a range of values be- tween 0.09 and 0.20. In the following discussion a value of 0.1 will be adopted.
We now consider the AE-D NO measurements to examine
whether
the presence
of the N+(sS)
2143-Jt
doublet
makes
any
substantial contribution to the observations described before.Figure 4 shows the calculated volume emission rate using pa- rameters typical of the AE-D solar minimum activity period
(Ap = 12, F10.7
= 73) for a solar
zenith
angle
of 67.1
ø. The
peak emission
rate reaches
a value of 3.7 cm
-3 s -•. It is
located at 165 km and is thus lower in altitude and smaller in
magnitude than at solar maximum.
Figure 5 shows the vertical profiles of NO obtained at three geomagnetic latitudes and averaged over 5 ø of latitude. They show distinctive features such as peak concentrations, peak altitudes, and shape above and below the maximum, as evi- denced in Figures 2 and 3. The vertical distributions of the N II 2143-,• emission rate has been calculated following equa- tion (4) as described before and using values of solar zenith angles and local times appropriate to each latitude. To esti-
mate the possible contamination of the NO maps by this emission, the emission rate of N+(•S) is calculated and con- verted into fractional contribution of the UVNO signal by considering the efficiency of the instrument collection of the NO and N+(sS) emissions. The results are shown in Figure 5 for two values of the efficiency and indicate that the contami-
nation is totally negligible in the lower thermosphere and amounts to less than 15% at higher altitudes at all latitudes.
Its relative contribution maximizes at low latitudes. Even if the N+(•S) yield was 0.2, the contribution would be less than 30% and would thus not significantly affect the derived NO
densities.
Results of N+(•S)calculations must be considered with some caution until discrepancies between values of e deduced from the dayglow observations and laboratory measurements are understood. The peak cross section of 1.1 x 10 -•8 cm -2 for the removal of 2s% electrons [Wight et al., 1976] is com- parable with the value deduced from the auroral [Dalgarno et al., 1981] and laboratory [Knight, 1982] measurements, thus suggesting a high efficiency for the production of N+(sS) ions by electron impact. It is not clear why the efficiency would be substantially smaller in the case of photoionization. Other
sources of uncertainties in the N +(5S) distribution include the
value
of the solar
irradiance
below
329 ,•, its dependence
on
solar activity, and the vertical distribution of N2 as given by model atmospheres. More measurements of the 2143-A doub- let and comparisons with model calculations in various geo- physical conditions are clearly needed to clarify this question.DISCUSSION AND CONCLUSIONS
The latitudinal distribution of thermospheric nitric oxide is best represented in terms of geomagnetic rather than geo- graphic latitudes, especially at high latitudes. The existence of a high-latitude E region maximum in the vicinity of the summer auroral zone is clearly demonstrated. Even higher concentrations are probably associated with the winter auro- ral zone, where densities exceed 7 x 107 cm -3, whereas the low-latitude peak values are less than 1 x 107 cm -3. The re- verse trend was observed by Cravens [1981] and predicted by model calculations at higher (200 km) altitudes, where the summer concentrations exceed the winter values. It sho:•ld be
remembered that these are latitudinally averaged values at
quiet solstice periods very close to solar cycle minimum. Steeper latitudinal gradients are probably present at given particular times. The shape of the vertical profiles is latitude dependent, as discussed by Cravens et al. [1985]. This is clear- ly examplified by the drastic differences in shape among the
three profiles in Figure 4.
The main features of the observed NO distribution are re- produced satisfactorily by the two-dimensional models of G•rard et al. [1984] and G•rard and Roble [1986]. In particu-
lar,
the
steeper
latitudinal
gradien
t in winter
than
summer
and
the maximum associated with the southern auroral zone are in
agreement with the model results. This accord is improved when the data are plotted in terms of geomagnetic latitudes. The use of geographic coordinates tends to smear out the Peaks associated with the zones of particle precipitation. The agreement with two-dimensional models is also improved by removing the Rayleigh scattering. Figures 2 and 3 suggest that
the minimum associated with the NO photolysis near the
mesopause and the weaker K coefficient in summer is deeper
in the summer
hemisphere,
in agreement
with the two-
dimensional'model
results.
However,
a quantitative
compari-
10,140 Gl•RARD AND NOJ•L: AE-D GEOMAGNETIC LATITUDINAL DISTRIBUTION OF NO
son is made difficult by the weakness of the NO scattering compared to the Rayleigh scattering below 100 km. The shapes of the vertical profiles and their latitudinal dependence
are also well matched by the calculations.
Model calculations of the vertical distribution of the N +(5S) volume emission rate show that its contribution in the data analyzed here is negligible. Nevertheless, the relative impor-
tance
of the 2143-Jt
doublet
depends
on altitude,
local time,
latitude, and season as well as instrument characteristics. Italso depends on solar activity, and comparison between the two curves in Figure 4 shows that it increases by over an order of magnitude at high altitudes. The solar cycle depen- dence of the high-altitude NO concentration has not been observed, but it may be expected that it responds differently from N+(sS) to changes in solar activity. Consequently, the
possible
contamination
by the 2143-Jt
dayglow
must
be evalu-
ated carefully for each observational condition.
Acknowledgments. One of us (J.C.G.) is supported by the Belgian Foundation for Scientific Research (FNRS). This research was fin- anced in part by FRFC grant 2-4507-82.
The Editor thanks S. Solomon and G. A. Victor for their assistance
in evaluating this paper.
REFERENCES
Barth, C. A., and R. E Steele, Rocket observations of the NII 2143A dayglow, Geophys. Res. Lett., 9, 559, 1982.
Barth, C. A., D. W. Rusch, and A. I. Stewart, The UV nitric oxide
experiment for Atmosphere Explorer, Radio Sci., 8, 379, 1973.
Cravens, T. E., The global distribution of nitric oxide at 200 km, J.
Geophys. Res., 86, 5710, 1981.
Cravens, T. E., J. C. G6rard and A. I. Stewart, and D. W. Rusch, The latitudinal gradient of nitric oxide in the lower thermosphere, J.
Geophys. Res., 84, 2675, 1979.
Cravens, T. E., J. C. G6rard, M. Lecompte, A. I. Stewart, and D. W. Rusch, The global distribution of nitric oxide in the thermosphere as determined by the Atmosphere Explorer D satellite, J. Geophys.
Res., 90, 9862, 1985.
Dalgarno, A., G. A. Victor, and T. W. Hartquist, The auroral 2145 A
feature, Geophys. Res. Lett., 8, 603, 1981.
Dick, K. A., The auroral 2150A feature: A contribution from lines of singly ionized nitrogen, Geophys. Res. Lett., 5, 273, 1978.
Duysinx, R., and A. Monfils, Auroral spectra recorded between 2000A
and 3000A with a fast scanning spectrometer, Ann. Geophys., 28,
109, 1972.
Garcia, R., and S. Solomon, The effect of breaking gravity waves on
the dynamics and chemical composition of the mesosphere and
lower themosphere, J. Geophys. Res., 90, 3850, 1985.
G6rard, J. C., and E. J. Deneye, The transport of thermospheric nitric oxide into the mesosphere, Ann. Geophys., 2, 187, 1984.
G6rard, J. C., and R. G. Robie, The role of nitric oxide on the zonally
averaged structure of the thermosphere: Solstice conditions for
solar cycle minimum, Planet. Space Sci., 34, 131, 1986.
G6rard, J. C., R. G. Robie, D. W. Rusch, and A. I. Stewart, The global distribution of thermospheric odd nitrogen for solstice conditions during solar cycle minimum, J. Geophys. Res., 89, 1725, 1984. Hedin, A. E., A revised thermospheric model based on mass spec-
trometer and incoherent scatter data' MSIS-83, J. Geophys. Res.,
88, 10,170, 1983.
Knight, R. D., Radiative lifetime of the 5S 2 metastable state of N +,
Phys. Rev. Lett., 48, 792, 1982.
Robie, R. G., and P. B. Hays, Density profile of atmospheric gases from planetary occultation data, Planet. Space Sci., 20, 1727, 1972.
Sharp, W. E., and M. H. Rees, Auroral spectrum between 1200 and
4000 angstroms, J. Geophys. Res., 77, 1810, 1972.
Stewart, A. I., and T. E. Cravens, Diurnal and seasonal effects in E
region low-latitude nitric oxide, J. Geophys. Res., 83, 2453, 1978.
Torr, M. R., and D. G. Torr, The NII 2143-,•I dayglow from Spacelab
1, J. Geophys. Res., 90, 6679, 1985a.
Torr, M. R., and D. G. Torr, Ionization frequencies for solar cycle 21' Revised, J. Geophys. Res., 90, 6675, 1985b.
Torr, M. R., D. G. Torr, R. A. Ong, and H. E. Hinteregger, Ionization
frequencies for major thermospheric constituents as a function •f
solar cycle 21, Geophys. Res. Lett., 6, 671, 1979.
Victor, G. A., and A. Dalgarno, The 2145A dayglow and the high altitude nitric oxide density, Geophys. Res. Lett., 9, 866, 1982.
Wight, G. R., M. J. Van der Wiel, and C. E. Brion, Dipole excitation,
i6nization and fragmentation of N2 and CO in the 10-60 eV region,
J. Phys. B, 9, 675, 1976.
J. C. Gbrard and C. E. Noel, Institut d'Astrophysique, Universit•
de Libge, 5 avenue de Cointe, 4200 Libge-Ougrbe, Belgium.
(Received October 30, 1985' revised May 15, 1986' accepted April 25, 1986.)