Urolithin B, a newly identi
fied regulator of skeletal
muscle mass
Julie Rodriguez1,2, Nicolas Pierre1, Damien Naslain1, Françoise Bontemps3, Daneel Ferreira4, Fabian Priem2, Louise Deldicque1& Marc Francaux1*
1Institute of Neuroscience, Université catholique de Louvain, 1 place Pierre de Coubertin, 1348 Louvain-la-Neuve, Belgium;2PROCELL nutrition sprl, 2 Rue Jean Burgers, 7850
Enghien, Belgium;3De Duve Institute, Université catholique de Louvain, 75 Avenue Hippocrate, 1200 Brussels, Belgium;4Department of Biomolecular Sciences, Division of
Pharmacognosy, Research Institute of Pharmaceutical Sciences, University of Mississippi, Medicinal Plant Garden, RM 104, University, MS 38677, USA
Abstract
Background The control of muscle size is an essential feature of health. Indeed, skeletal muscle atrophy leads to reduced strength, poor quality of life, and metabolic disturbances. Consequently, strategies aiming to attenuate muscle wasting and to promote muscle growth during various (pathological) physiological states like sarcopenia, immobilization, malnutrition, or cachexia are needed to address this extensive health issue. In this study, we tested the effects of urolithin B, an ellagitannin-derived metabolite, on skeletal muscle growth.
Methods C2C12 myotubes were treated with 15μM of urolithin B for 24 h. For in vivo experiments, mice were implanted with mini-osmotic pumps delivering continuously 10μg/day of urolithin B during 28 days. Muscle atrophy was studied in mice with a sciatic nerve denervation receiving urolithin B by the same way.
Results Our experiments reveal that urolithin B enhances the growth and differentiation of C2C12 myotubes by increasing protein synthesis and repressing the ubiquitin–proteasome pathway. Genetic and pharmacological arguments support an implication of the androgen receptor. Signalling analyses suggest a crosstalk between the androgen receptor and the mTORC1 pathway, possibly via AMPK. In vivo experiments confirm that urolithin B induces muscle hypertrophy in mice and reduces muscle atrophy after the sciatic nerve section.
Conclusions This study highlights the potential usefulness of urolithin B for the treatment of muscle mass loss associated with various (pathological) physiological states.
Keywords Polyphenols; Hypertrophy; Androgen receptor; mTORC1 signalling Received: 14 April 2016; Revised: 1 January 2017; Accepted: 10 January 2017
*Correspondence to: Prof. Marc Francaux, Institute of Neuroscience, Université catholique de Louvain, Place Pierre de Coubertin 1, bte L8.10.01, Louvain-la-Neuve 1348, Belgium. Phone: +32-10-474457, Fax: +32-10-472093, Email: marc.francaux@uclouvain.be
Introduction
Skeletal muscle represents about 45% of body mass in young male adults. Owing to its capacity to generate strength, muscle is responsible for mobility, respiration, and posture maintenance. Muscles also play a major role in metabolism regulation by consuming large amount of glucose and lipids, particularly during exercise. Several physiological and physiopathological conditions like ageing, immobilization, chronic hypoxia, cancer, or sepsis disrupt the equilibrium
between muscle protein synthesis and breakdown and lead to muscle atrophy and consequently, to strength loss and metabolic disturbances.1Therefore, pursuing strate-gies to reduce muscle atrophy is a major challenge for researchers.
Urolithins are ellagitannin or ellagic acid metabolites, with different phenolic hydroxylation patterns, produced by the microflora in the gastrointestinal tract after the ingestion of some fruits.2 The first product of ellagic acid catabolism is urolithin D, and successive loss of hydroxy groups result in
Journal of Cachexia, Sarcopenia and Muscle (2017)
the formation of urolithins C, A, and B.3All mammals seem able to produce urolithins from ellagitannins found in food.4,5 In healthy humans, urolithins A and B are most abundant.5,6 Urolithin A is the most reported analogue due to its anti-oxidative and anti-inflammatory properties in various tissues.7–10Supplementing the diet with ellagitannins attenu-ates muscle damage experienced during strenuous exer-cise,11 and ellagitannin-rich pomegranate extract protects muscle against stresses induced by a high-fat diet.12 Never-theless, because of the low bioavailability of ellagitannins,13 it is likely that ellagitannin-derived metabolites are responsi-ble for the reported effects. Therefore, it seems important to characterize the effects of urolithins themselves. Doing this, we incidentally observed that myotubes in culture were big-ger after incubation with urolithin B and thereby discovered a new characteristic of urolithin B. Therefore, we sought to describe this phenomenon further and to understand the underlying molecular mechanisms.
In this study, we report that urolithin B enhances myotubes growth and differentiation, induces muscle cell hypertrophy, and inhibits the ubiquitin–proteasome pathway both in vitro and in vivo.
Results
Urolithin B enhances differentiation of C2C12
myotubes
We incubated myotubes with different urolithin concentra-tions during 24 h and evaluated the impact of each treat-ment on their size (see Supporting Information, Figure S1A–S1D). The latter was never affected in the presence of urolithin A, whereas low doses of urolithin B increased the diameter of myotubes. The most effective concentration was identified at 15 μM as the effect disappeared with higher doses (see Supporting Information, Figure S1A and S1B). This concentration was used for the experiments reported in Figure 1, which confirms the anabolic properties of urolithin B in myotubes (Figure 1A and 1B). The higher fusion index (+16.3%) indicated an enhanced fusion capability of the cells (Figure 1C). The up-regulation of the myogenic factor myogenin (P = 0.06) and the marker of differ-entiation, desmin14(P< 0.05) after 5 days, confirmed the stimulation of cell differentiation in the presence of urolithin B (Figure 1D and 1E).
Urolithin B stimulates protein synthesis in C2C12
myotubes by activating mTORC1 signalling
To test the hypothesis that urolithin B stimulates muscle anabolism to induce hypertrophy, we investigated the
Akt/mTORC1 (protein kinase B/mammalian target of rapamycin complex 1) pathway. When Akt is activated, it phosphorylates the mTORC1 complex.1 4E-BP1, a repressor of mRNA translation, is then phosphorylated and inactivated by mTORC1.15 S6K1 is another downstream target of mTORC1 that is a kinase for the ribosomal protein rpS6. The phosphorylation state of S6K1 correlates with an increase in translation of mRNA transcripts.1 Here, we did not detect any change in the phosphorylation state of Akt with urolithin B (Figure 1F). Nevertheless, the phosphorylation states of mTOR, rpS6, and 4E-BP1 were higher, and rapamycin, a well-known inhibitor of mTORC1,16completely blunted the effects (Figure 1G–1I). These results strongly suggest that the mTORC1 pathway was activated independently of Akt in response to urolithin B treatment.
We also analysed another regulator of mTORC1 activity, that is, AMP-activated protein kinase (AMPK). Compatible with a higher mTORC1 activity, AMPK was dephosphorylated by 42.2% (Figure 1J). However, this regulation was neither due to a modification of adenine nucleotide concentrations (see Supporitng Information, Figure S1E) nor to a reduction in the phosphorylation state of the liver kinase B1, another regulator of AMPK (see Supporting Information, Figure S1F). Finally, we measured protein synthesis in myotubes using the non-radioactive SUnSET method.17 Myotubes were treated either with urolithin B (15 μM) or the vehicle (DMSO), or rapamycin (40 nM) as a negative control, or insu-lin (100 nM) as a positive control. As expected, compared with untreated cells, puromycin incorporation was decreased by about 11.2% after rapamycin incubation and increased by 61.5% after insulin incubation (Figure 1K and 1L). Urolithin B up-regulated protein synthesis in myotubes by 96.1% (P < 0.001 vs. control, Figure 1K and 1L). Here again, we did not detect any difference in puromycin incorporation with the same concentration of urolithin A, showing that the two isoforms, urolithins B and A, do not induce the same effects in muscle cells (see Supporting Information, Figure S1G and S1H).
Collectively, these data indicate that urolithin B stimulates protein synthesis in myotubes by an mTORC1-dependent mechanism, possibly triggered by a decreased AMPK activity.
Urolithin B inhibits protein degradation by
down-regulating the ubiquitin
–proteasome pathway
The signalling pathways regulating protein synthesis or degra-dation are largely interconnected at the level of Akt1 or mTORC1.18,19The Akt/mTORC1 pathway regulates two pro-teolytic systems in muscle cells, namely, the ubiquitin– proteasome and the autophagy–lysosomal pathways. Akt prevents the nuclear translocation of the forkhead box fac-tors 1 and 3a (FoxO1 and 3a) by phosphorylating multiple sites.20,21 FoxOs are among the major transcription factors
Figure 1 Urolithin B (UroB) promotes growth and differentiation of C2C12 myotubes. (A) After 4 days of differentiation, C2C12 myotubes were treated with UroB (15μM) or vehicle DMSO (CTRL), for 24 h. Cells were then fixed and immunostained with anti-desmin, nuclei were revealed by Hoechst staining. Scale bar = 50μm. (B) Mean diameter of the myotubes seen in (A). Histograms are means ± SEM for 10 assays. Independent cell cultures were carried out in triplicate. At least 2000 myotubes were analysed for both treated and untreated cells. ***P< 0.001 vs. CTRL cells (Student’s t-test). (C) Fusion index of myotubes seen in (A) from at leastfive independent cultures. Data are means ± SEM. ***P < 0.001 vs. CTRL cells (Student’s t-test). (D–F, J) Quantification and representative immunoblots of proteins, as indicated. Data are means ± SEM for at least three experiments. P-values were determined by Student’s t-test. *P < 0.05 vs. CTRL. (G–I) Quantification and representative immunoblots of proteins, as indicated. Data are means ± SEM for at least three experiments. P-values were determined by Bonferroni post-hoc test. *P< 0.05, **P < 0.01, and ***P < 0.001 vs. ve-hicle (vh) CTRL;$$$P< 0.001 vs. rapamycin (Rapa, 40 nM) CTRL. (K) Representative image of WB analysis for puromycin and eEF2, a stable protein in our samples. Insulin (Ins, 100 nM) was added as a positive control and rapamycin (40 nM) as a negative control. (L) Quantification of the puromycin-labelled peptides, expressed as a percentage of the values obtained in untreated CTRL cells. Data are means ± SEM. P-values were determined by one-way analysis of variance with Bonferroni post-hoc test.*P< 0.05, **P < 0.01, and ***P < 0.001 vs. CTRL. See also Supporting Information Figure S1.
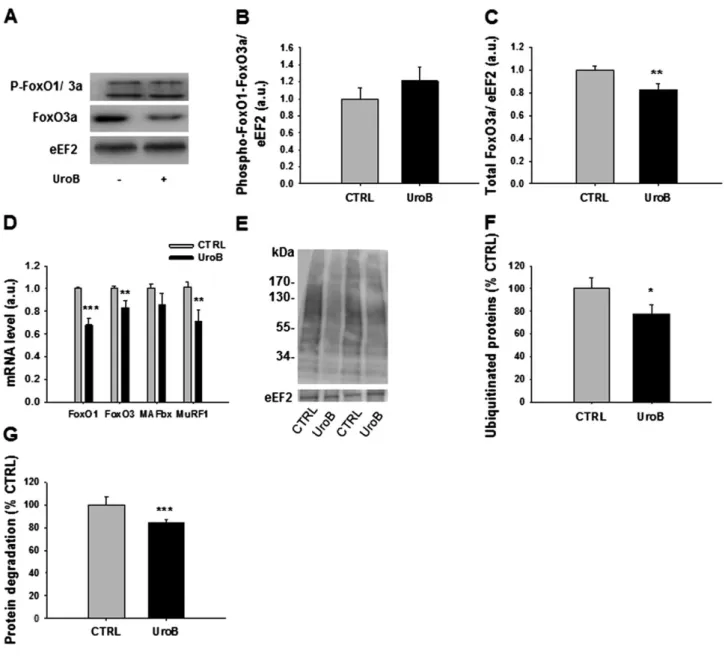
regulating the expression of the muscle-specific ligases MAFbx and MuRF1, which are induced during several situa-tions of muscle atrophy.20,22 The phosphorylated form of FoxO1 and 3a were not modified by urolithin B (Figure 2A and 2B). Interestingly, we observed a significant reduction of the total form of FoxO3a (Figure 2C). Reverse transcription quantitative PCR analysis also indicated that mRNA coding FoxO1 and FoxO3, as well as the mRNA levels of ubiquitin
ligase MAFbx and MuRF1 were decreased by urolithin B (Figure 2D). Immunoblotting using an anti-P4D1 antibody revealed a lower amount of ubiquitinated proteins in treated cells ( 22.1%, P < 0.05, Figure 2E and 2F). These results strongly suggest a lower activity of the ubiquitin–proteasome system in myotubes treated with urolithin B.
We also analysed whether urolithin B was capable of repressing the autophagy–lysosomal pathway, which is
Figure 2 Urolithin B (UroB) down-regulates the ubiquitin–proteasome pathway. (A–C) Effect of UroB (15 μM) on phospho-FoxO1/FoxO3a and total FoxO3a. eEF2 was used as a loading control on protein extracts from C2C12 myotubes collected after 24 h of UroB treatment. Data are means ± SEM for at least three experiments. P-values were determined by Student’s t-test. **P < 0.01. (D) Effect of UroB (15 μM) on FoxO1, FoxO3a, MAFbx, and MuRF1 mRNA levels, normalized to RPL19 mRNA, as assessed by quantitative PCR. Data are means ± SEM for at least three experiments. P-values were determined by Student’s t-test. **P < 0.01 and ***P < 0.001 vs. CTRL. (E–F) Representative immunoblot for ubiquitinated protein and quantification. Data are means ± SEM for at least three experiments. P-values were determined by Student’s t-test. *P < 0.05 vs. CTRL. (G) Protein degradation quan-tification by35S-labeling. Data are means ± SEM from three experiments. P-values were determined by Student’s t-test. ***P < 0.001 vs. CTRL. See also Supporting Information Figure S2.
another important proteolytic pathway in muscle regulated by mTORC1 and FoxOs as well.23,24No markers of autophagy that we studied were changed in the presence of urolithin B. As expected, insulin (100 nM) decreased both phospho-ULK1 (Ser757) and the ratio LC3bII/I. Inversely, rapamycin (40 nM) and phosphate-buffered saline (PBS) increased them (see Supporting Information, Figure S2A and S2B). Adding urolithin B in all these conditions did not modify further the autophagy markers. Moreover, autophagy-related gene expression programme did seem to be affected as assessed by unchanged Lc3b, p62, and Gabarapl1 mRNA (see Supporting Information, Figure S2C).
As the ubiquitin–proteasome system seems to be regu-lated by urolithin B, we next measured the protein degrada-tion rate by diludegrada-tion of 35S-methionine in myotubes and found that urolithin B decreased it by 16.7% (P < 0.001, Figure 2G).
Collectively, these results show that the faster growth of myotubes in the presence of urolithin B is due to a higher protein synthesis combined with a reduced activity of the ubiquitin–proteasome system, independently of autophagy.
The anabolic effect of urolithin B is mediated by
the androgen receptor
Because previous studies highlighted a link between andro-gen receptor (AR) and the mTORC1 pathway25and provided evidence for anti-aromatase properties of urolithin B in breast cancer cells,26 we hypothesized that urolithin B induces hypertrophy in myogenic cells through the activation of AR. Thus, we inactivated AR genetically by using a set of specific small interfering RNA (siRNAs) and pharmacologically by using bicalutamide. The siRNA transfection repressed the mRNA level of AR by 72.4%, and urolithin B treatment had no effect on this level (see Supporting Information, Figure S3A). In comparison with the scramble condition, the genetic repression of AR completely abolished the enhancement of myotube size induced by urolithin B (Figure 3A and 3B). Inter-estingly, siRNAs totally blocked the hypertrophy induced by both testosterone and urolithin B, providing thefirst evidence for the implication of AR in the enhanced growth of myotubes in the presence of urolithin B. To ensure that the transfection still allowed hypertrophy induced by other molecules targeting other receptors, we successfully repeated the same experiment with insulin (see Supporting Information, Figure S3B and S3C).
To confirm our results acquired on the basis of a genetic repression model, we used bicalutamide (5 μM), a pharma-cological inhibitor of AR.27As anticipated, bicalutamide to-tally repressed the increase in myotube size induced by testosterone and urolithin B (Figure 3C and 3D). The inhibi-tion of AR by bicalutamide also prevented the increase of phosphorylated mTOR and rpS6 induced by urolithin B
(Figure 3E and 3F). In agreement with the idea that AMPK af-fects urolithin B-induced signalling, we did not observe any change in the AMPK phosphorylation state when cells were simultaneously treated with bicalutamide and urolithin B (Figure 3G). This also suggests that AMPK could be a link between AR and mTORC1.
To provide more evidence in favour of the activation of AR upon urolithin B treatment, we transfected C2C12 cells with a dual-luciferase reporter gene under the control of AR pro-moter. A higher activity of AR promoter when the myotubes were incubated with urolithin B (+90.6%, P < 0.001, Figure 3H) or testosterone (+49.6%, P < 0.05, Figure 3H) was ob-served. No synergic effects were observed with simultaneous treatment of urolithin B and testosterone compared with urolithin B alone, suggesting a saturation process.
To ensure the specificity of AR activation, we examined whether the oestrogen receptor 1 (ER1) also mediated the hypertrophic effects of urolithin B. Thus, we inactivated ER1 with a set of specific siRNAs, which also induced a decreased diameter of the myotubes under control conditions (see Supporting Information, Figure S3D and S3E). Even though the transfection of siRNA against ER1 receptor induced a decrease of myotubes diameter, we still observed the effects of testosterone and urolithin B on myotube size, showing that ER1 is probably not involved.
Collectively, our results provide strong evidence in favour of the implication of AR in the enhancement of C2C12 myotubes growth induced by urolithin B.
Urolithin B-induced skeletal muscle hypertrophy in
mice
To confirm the aforementioned results in an animal model, we implanted mini-osmotic pumps delivering urolithin B (10 μg/day) in male mice. In a preliminary experiment, we found that such a perfusion rate led to a plasma concentra-tion of urolithin B of 1.3 μM, which is very compatible with the concentration of urolithin A or B found in the plasma of rodents fed with ellagitannin-rich extracts.28During thefirst 3 weeks of treatment, the body weight gain was higher in mice receiving urolithin B, but this difference reached a plateau during the 4th week (Figure 4A). At that time, the animals were sacrificed, and the muscles were collected. The weight of tibialis anterior (TIB), soleus (SOL), and quadri-ceps muscles (QUA) was higher in mice receiving urolithin B (Figure 4B), while the weight of epididymal adipose tissue (EpiD) and testis was lower (Figure 4B). Cross-sectional area of TIB muscle fibres was 11.9% larger in mice treated with urolithin B than in controls (Figure 4C). Moreover, thefibres distribution analysis showed a shift towards a higher percent-age of largefibres (Figure 4D). In agreement with the results from the cellular model, the phosphorylation state of Akt remained unchanged in the presence of urolithin B, whereas
Figure 3 Implication of the androgen receptor (AR) in myotubes hypertrophy induced by urolithin B (UroB). (A–G) The androgen receptor was inactivated in C2C12 myotubes by siRNA (siRNA AR) or by bicalutaimide (Bic, 5μM). Myotubes were then treated, during 24 h, with either vehicle DMSO or 15μM UroB or 100 nM testosterone (T) used as a positive control. (A) Representative immunofluorescence images of myotubes, transfected with siRNA targeting the AR or the scramble vector (Scr) and stained with anti-desmin antibody and Hoescht. (B) Quantification of myotube diameter. Data are means ± SEM from three experiments, each with>300 myotubes measured per condition. P-values were determined by Bonferroni post-hoc test. **P< 0.01 and ***P < 0.001 vs. Scr CTRL;$$$P< 0.001 vs. Scr UroB;£££P< 0.001 vs. Scr T. (C) Representative immunofluorescence images of myotubes, treated with bicalutamide or vehicle DMSO (vh) and stained with anti-desmin antibody and Hoechst. (D) Quantification of myotube diam-eter. Data are means ± SEM from three experiments, each with>300 myotubes measured per condition. **P < 0.01 and ***P < 0.001 vs. vh CTRL;$$
$
P< 0.001 vs. vh UroB;££P< 0.01 vs. vh T. (E–G) Quantification and representative immunoblot for phosphorylated and total mTOR, phosphorylated rpS6 and eEF2, and phosphorylated and total AMPK, as indicated. Data are means ± SEM from at least three experiments. P-values were determined by Bonferroni post-hoc test. *P< 0.05 vs. CTRL vh group. (H) Quantification of AR promotor activity measured with a dual-luciferase assay. Myoblasts were transfected by nucleofection with dual reporter genes, differentiated and then treated the 4th day of differentiation with 50 μM UroB, 500 nM T, or both (UroB + T), during 24 h. Firefly luciferase activity was subsequently normalized against renilla luciferase reporter. *P < 0.05, **P< 0.01, and ***P < 0.001 vs. CTRL. P-values were determined by one-way analysis of variance with Bonferroni post-hoc test. See also Supporting Information Figure S3.
Figure 4 Urolithin B (UroB) induces skeletal muscle hypertrophy in mice. Twelve-week-old male mice were implanted with a mini-osmotic pump con-taining UroB or the control vector DMSO (CTRL). The pumps delivered 10μg of UroB per day during 28 days. Thirty minutes before sacrifice, mice were treated by intraperitoneal injection with puromycin reagent for measuring protein synthesis. (A) Body weight gain throughout the duration of exper-iment. Data are means ± SEM from six mice per condition. P-values were determined with Student’s t-test on body weight differences. *P < 0.05 and **P< 0.01. (B) Weights of tibialis anterior (TIB), extensor digitorum longus (EDL), gastrocnemius (GAS), soleus (SOL), and quadriceps (QUA) muscles and weights of epididymal adipose tissue (EpiD) and testis. Data are means ± SEM from six mice per condition. P-values were determined with Stu-dent’s t-test. *P < 0.05, **P < 0.01, and ***P < 0.001 vs. CTRL. (C) Azorubine staining of TIB sections was used to quantify the relative cross-sectional area. Data are means ± SEM from three mice per condition. *P< 0.05 vs. CTRL. (D) Fibre size distribution. Data are expressed as the percentage of the total number of measuredfibres. Data are means ± SEM. P-values were determined with Student’s t-test. *P < 0.05 and **P < 0.01 vs. CTRL group. (E–F) Representative immunoblot and quantification for phosphorylated and total Akt, phosphorylated FoxO1/FoxO3a and total FoxO3a, phosphory-lated and total mTOR, phosphoryphosphory-lated and total rpS6, and eEF2 in TIB muscle. In each TIB muscle, the ratio of phosphoryphosphory-lated protein on total protein was calculated (each one was previously normalized to the level of the stable protein eEF2). Data are means ± SEM from six mice per condition. P-values were determined with Student’s t-test. *P < 0.05 and **P < 0.01 vs. CTRL group. (G) Representative image of WB analysis for puromycin and the stable protein eEF2. (H) Quantification of the puromycin-labelled peptides in TIB muscle expressed as a percentage of the values obtained in the CRTL group. Data are means ± SEM from six mice per condition. P-values were determined with Student’s t-test. **P < 0.01 vs. CTRL group. (I) Plasma testosterone level in CTRL and UroB groups. See also Supporting Information Figure S4.
the phosphorylation levels of mTOR and rpS6 were higher in TIB muscle (Figure 4E and 4F). Although the body weight gain showed a clear levelling-off, muscle protein synthesis was still higher after 4 weeks of treatment with urolithin B as revealed by puromycin incorporation (P< 0.01, Figure 4G and 4H in TIB muscle, and see Supporting Information, Figure S4 in SOL muscle). Finally, the muscle hypertrophy due to urolithin B treatment did not seem related to plasma testosterone levels as the latter was not affected (Figure 4I).
These results confirm the in vitro data and show that urolithin B increases muscle protein synthesis by a mecha-nism dependent upon mTORC1 but independent of plasma testosterone concentration.
Urolithin B reduces the loss of muscle weight
induced by denervation
As urolithin B induces muscle hypertrophy, we hypothesized that this compound could have a protective effect during at-rophy. Female mice were denervated by transecting the left sciatic nerve and were simultaneously implanted with a mini-osmotic pump delivering urolithin B (10 μg/day). After 7 days, the ratio denervated/innervated muscle weight was higher for TIB (P < 0.05), EDL (extensor digitorum longus, P< 0.05), SOL (P < 0.001), and QUA (P < 0.01) muscles of animals treated with urolithin B compared with untreated an-imals (Figure 5A). This ratio was not different in gastrocne-mius (GAS) muscle. In order to understand the mechanisms leading to the protective effects of urolithin B, we performed histological and biochemical analyses in the TIB muscle. Urolithin B prevented the decrease in the cross-section area of the fibres of denervated TIB muscles, as observed with azorubine staining (Figure 5B and 5C). In fact, denervation in-duced a shift towards the left of the distribution of the mus-clefibre cross-section areas in mice treated with the vehicle, whereas this shift was less pronounced in animals treated with urolithin B (Figure 5D). Collectively, these data indicate that urolithin B reduces denervation-induced muscle atrophy. To determine the molecular mechanisms responsible for denervation-induced muscle atrophy and protection by urolithin B, we analysed the major markers involved in signal-ling pathways controlsignal-ling protein degradation after 3 days of denervation. We observed significant increases in FoxO1 and FoxO3, ubiquitin ligases MAFbx and MuRF1, and myostatin (growth factor reducing muscle mass29) mRNA levels in de-nervated CTRL TIB compared with inde-nervated CTRL TIB (Figure 5F). Interestingly, these increases were reduced in de-nervated urolithin B TIB compared with inde-nervated urolithin B TIB (Figure 5F). As expected from the previous results, the to-tal form of FoxO3a was significantly increased in CTRL muscle after denervation, but not in urolithin B-denervated muscle (see Supporting Information, Figure S5A). The phosphorylation levels of FoxO1/FoxO3a or Akt were not affected under any of
the conditions (see Supporting Information, Figure S5B and S5C). The amount of ubiquitinated proteins was significantly increased by denervation in CTRL muscle (P< 0.01), whereas it remained unchanged in urolithin B-denervated muscle (Fig-ure 5G and 5H). In denervated muscles of animals receiving urolithin B, the ratio of phosphorylated AMPK on total AMPK was reduced in comparison with mice receiving the vehicle (see Supporting Information, Figure S5D). The phosphoryla-tion state of mTOR (Ser2448) and rpS6 were increased in denervated CTRL mice, whereas this increase was not significant between the two groups having received urolithin B (see Supporting Information, Figure S5E–S5F).
Recently, urolithin B was identified as an inhibitor of aromatase26and thereby the conversion of testosterone into estradiol. In agreement with this study, we observed a lower level of aromatase in animals having received urolithin B (see Supporting Information, Figure S5G and S5H). To assess the impact of low aromatase levels on the androgen status of the animals, we measured plasma testosterone. Contrary to our hypothesis, plasma testosterone was decreased after 3 days (P< 0.001 vs. CTRL mice) and unchanged after 7 days of treatment with urolithin B (Figure 5E), suggesting that the inhibition of aromatase is likely not the major molecular event in the regulation of muscle mass induced by urolithin B.
Discussion
Recent studies highlighted that some small natural molecules found in plants or fruits might be used in the treatment or prevention of skeletal muscle atrophy.30–32Here, we demon-strate that urolithin B, a small molecule generated in the in-testine after the ingestion of fruits containing ellagitannins, induces muscle hypertrophy both in vitro and in vivo. This hypertrophy is related to a significant increase in protein synthesis rate and higher phosphorylations of mTOR and its downstream target rpS6. These effects on cell growth are not induced by urolithin A (Figure S1), supporting the speci-ficity of action of urolithins A and B, even if they differ by only a hydroxyl group. Urolithin B also decreases protein degrada-tion, through a down-regulation of the ubiquitin–proteasome pathway. The mechanisms of action seem to be mediated by the AR. Blockage of this receptor by a siRNA or a pharmaco-logic agent totally prevents the effect of urolithin B. This is confirmed by dual-luciferase assays showing that urolithin B targets the AR in C2C12 myotubes.
Our results are consistent with previous findings showing that activation of the AR by testosterone enhances growth and differentiation and activates the mTORC1 pathway in C2C12 myotubes.33,34 Nevertheless, the mechanistic link between the AR and mTORC1 is not yet fully elucidated. Our results suggest that AMPK is an intermediate in this process. Indeed, mTORC1 is inhibited by AMPK, which itself
Figure 5 Urolithin B (UroB) reduces denervation-induced skeletal muscle atrophy in mice. On Day 0, the left hindlimb of mice were denervated by transecting the sciatic nerve and implanted with mini-osmotic pumps containing UroB, or vehicle DMSO. On Day 3 or 7, muscles were harvested under anaesthesia. Muscles taken at Day 3 were used for analysing the signalling pathways, whereas those taken at Day 7 were used for weight and histo-logical analyses. (A) For each mouse, the weight of the denervated muscle (DEN) was normalized to the weight of the innervated muscle (INN). Results are expressed as the ratio DEN/INN (%). Data are means ± SEM from 10 mice per condition. P-values were determined with Student’s t-test. *P < 0.05, **P< 0.01, and ***P < 0.001 vs. CTRL. (B) Azorubine staining of tibialis anterior (TIB) sections was used to quantify the area and the distribution of fibres. (C) Relative cross-sectional area of the TIB muscle. Data are means ± SEM from three mice per condition. ***P < 0.001 vs. CTRL INN;££ £
P< 0.001 vs. CTRL DEN. (D) Fibre size distribution. Data are expressed as the percentage of the total number of measured fibres. (E) Effect of UroB on plasma testosterone level after 3 or 7 days of denervation. Data are means ± SEM fromfive mice per condition after 3 days and 10 mice per con-dition after 7 days of denervation. P-values were determined with Student’s t-test. ***P < 0.001 vs. CTRL. (F) Effect of UroB on FoxO1, FoxO3a, MAFbx and MuRF1, and myostatin (mstn) mRNA levels, relative toβ2-microglobulin level, after 3 days of denervation, as assessed by quantitative PCR. Data are means ± SEM, n = 5 mice per condition. P-values were determined with two-way analysis of variance (ANOVA) and a Bonferroni post-hoc test. **P< 0.01 and ***P < 0.001 vs. CTRL INN;$P< 0.05,$$P< 0.01, and$$$P< 0.001 vs. UroB INN;£P< 0.05 and£££P< 0.001 vs. CTRL DEN. (G–H) Representative immunoblots and quantification of the ubiquitinated proteins level. Data are means ± SEM, n = 5 mice per condition. P-values were determined with two-way ANOVA and a Bonferroni post-hoc test. *P< 0.05 vs. CTRL INN. Data are means ± SEM, n = 5 mice per condition. P-values were determined with two-way ANOVA and a Bonferroni post-hoc test. *P< 0.05 and ***P < 0.001 vs. CTRL INN;$P< 0.05 vs. UroB INN. See also Supporting Information Figure S5.
is regulated by the AR and testosterone35,36 as well as urolithin B. The latter does not alter the energy status of the cell as evidenced by unchanged nucleotide concentra-tions and does not modify the phosphorylation state of liver kinase B1, an AMPK activator. Although more data are re-quired to highlight the mechanism by which urolithin B is able to activate mTORC1, our results ruled out a mandatory participation of Akt. High and low testosterone concentra-tions seem to both activate mTORC1 but by an Akt-dependent34 and an Akt-independent mechanism,25 respectively. Therefore, we do not exclude that Akt is acti-vated by higher urolithin B concentrations than those used in our experimental conditions in which we never observed any change in Akt phosphorylation state. Moreover, PRAS40 does not seem implicated either. It has previously been shown that the activation of mTORC1 by testosterone in C2C12 myoblasts is independent of PRAS40 phosphoryla-tion.25This was corroborated by our results with urolithin B (data are not shown). Data acquired in vivo support the role of mTORC1 in the enhancement of protein synthesis induced by urolithin B as the phosphorylation states of mTOR and rpS6 were both increased.
As expected from the results on Akt, urolithin B did not change the phosphorylation state of FoxO in vitro and after a continuous perfusion of 3 days in the denervation experi-ment. On the opposite, a long-term period of urolithin B treatment (4 weeks) increases the phosphorylation of FoxO suggesting an inhibition of protein degradation, possibly mediated by kinases regulating FoxO activity independently of Akt, like the serum glucocorticoid-regulated kinase 1 (SGK1) or AMPK. Moreover, urolithin B and insulin have no additive effect on protein synthesis assessed by the SUnSET method in fully differentiated C2C12 myotubes (data not shown).
Testosterone is known to suppress the ubiquitin ligase-mediated atrophy pathway to preserve muscle mass.37–39,34 Here again, our results support the idea that urolithin B mimics the effects of testosterone as it decreased the mRNA of the muscle-specific ligases MuRF1 and MAFbx and the level of ubiquitinated proteins both in vitro and in denervated muscles.
As the activation of mTORC1 was assessed by a number of its downstream targets, an inhibition of autophagy was expected. Contrary to our hypothesis, urolithin B did change the autophagy markers neither in basal conditions nor in autophagy-activated models. This suggests that the reduced protein degradation observed in the presence of urolithin B in C2C12 myotubes is probably due to an inhibition of the ubiquitin–proteasome system rather than autophagy, which remained unchanged.
Other potential mechanisms of action may involve the anti-aromatase properties of urolithin B.26 The aromatase enzyme is a cytochrome P450 CYP19A1 enzyme that is responsible for catalyzing the reaction for the conversion of
testosterone into 17β-estradiol.40 Inhibition of aromatase activity induces a higher plasma testosterone concentration in rats,41whereas urolithin B did not change the latter in our mice. Consequently, it is unlikely that the anabolic prop-erties of urolithin B are related to anti-aromatase activity. It seems rather that urolithin B has‘testosterone-like’ effects. This hypothesis is supported by a lower mass of testicular and epididymal adipose tissue in mice having received urolithin B. Indeed, it is well established that the long-term use of androgenic steroids affects the testis size in young men42and decreases body fat mass.43However, our results cannot support incontrovertibly the implication of ARs in vivo, and clearly, further studies should carefully evaluate the potential interest of urolithin B as a drug. Currently, the dose–response and time–effect curves are unknown, and possible side effects are numerous.
As urolithin B has‘testosterone-like’ properties in vitro, we decided to carry out afirst in vivo experiment in male mice aiming to verify the enhancement of muscle growth. A sec-ond study was dedicated to the protective effects of urolithin B against muscle atrophy. For this experiment, we used a de-nervation model in females because they are more sensitive to muscle wasting. We found that urolithin B not only in-duces muscle hypertrophy but also rein-duces denervation-induced muscle atrophy in mice. Nevertheless, as the in vitro results support a role of ARs, it is likely that these ef-fects are gender-dependent and hence, could be larger in males.
After 7 days of denervation, muscle mass was reduced by 11–29% depending on the muscle studied. SOL, a typical slow-twitch muscle, showed the largest degree of atrophy. When the mice received urolithin B, this atrophy was clearly reduced in SOL, completely blunted in TIB, EDL, and QUA, but not affected in GAS. Currently, we have no explanation re-garding this lack of effect in GAS. However, afibre-type de-pendent action of urolithin B may not be retained because GAS is a mixed muscle, whereas EDL and SOL contain mostly fast-twitch and slow-twitchfibres, respectively.
It seems that the largest fibres (>5000 μm2) were more sensitive to denervation in control mice, whereas the smallest ones (between 1000 and 2000μm2) were more af-fected in mice having received urolithin B. Although we have no definitive explanations for this surprising result, it sug-gests that urolithin B is less efficient in the small size fibres. Moreover, 7 days of urolithin B treatment do not increase thefibre size in innervated muscle of female mice. Because of the reduced number of ARs, one may not exclude that urolithin B would be less efficient in females.
As expected from previous studies,23,44–46 the ubiquitin– proteasome and the lysosomal–autophagy pathways were activated in TIB muscle 3 days after denervation. Our results are in agreement with previousfindings showing that an inhi-bition of the ubiquitin–proteasome system reduces muscle atrophy in a model of denervation in rats.47 Surprisingly,
mTORC1 was activated 3 days after denervation in CTRL mice. These results are in agreement with those obtained in other studies,48,45indicating that mTORC1 activation could be an adaptive or compensatory mechanism following denervation. However, in those studies, the inactivation of mTORC1 by rapamycin did not rescue the atrophy phenotype, suggesting that the activation of mTORC1 is essential to maintain the activity of protein synthesis in serious situations of denerva-tion. This activation is possibly the consequence of a high ubiquitin–proteasome activity associated with the release of a large amount of amino acids.45In our context, this activa-tion of mTORC1 was not found in mice treated with urolithin B. Therefore, we postulated that, after 3 days of denervation, ubiquitin–proteasome activity was not high enough to stimu-late the mTORC1 pathway in the treated animals.
It has been shown that myostatin mRNA level is increased during muscle atrophy.49Our results corroborate thisfinding. We also observed a lower induction of myostatin mRNA in the presence of urolithin B. The reduction of about 20% of myostatin mRNA level by urolithin B during denervation represents an important additional effect participating to the conservation of muscle mass, but it may not explain by itself the protective effects of urolithin B. Indeed, a recent study demonstrated that denervation-induced atrophy was not reduced by myostatin inhibition.48
To conclude, we identified the ellagitannin-derived metab-olite urolithin B as a regulator of skeletal muscle mass. This study highlights the potential usefulness of urolithin B for the treatment of muscle mass loss associated with various (pathological) physiological states.
Experimental procedures
Cell culture
C2C12 murine skeletal muscle myoblasts (ATCC, Manassas, VA, USA) were grown as described.50After 4 days in differen-tiation medium, the myotubes were treated with urolithin B (15 μM), rapamycin (40 nM), testosterone (100 nM), or bicalutamide (5μM) for 24 h. Myotubes were also incubated with insulin (100 nM) for 1 h (puromycin incorporation exper-iment) or 24 h (immunofluorescence experiment) before harvesting. Dulbecco’s modified Eagle’s medium was purchased from Invitrogen (Carlsbad, CA, USA); horse serum and foetal calf serum were purchased from Hyclone (Thermo Fisher Scientific, Waltham, MA, USA). Rapamycin and bicalutamide were from Sigma-Aldrich (St Louis, MO, USA).
Immuno
fluorescence assay and analysis
C2C12 myotubes werefixed in PBS containing 4% paraformal-dehyde and permeabilized with PBS 0.5% triton X-100. The
preparation was incubated with an desmin primary anti-body (1/100; Sigma-Aldrich) diluted in PBS/BSA for 1 h at 37°C then washed in PBS, followed by a 30 min incubation with fluorescein-conjugated anti-mouse (1/100; Interchim Fluoprobes 488). Nuclei were stained with Hoechst (0.1 mg/ mL; Sigma). The slides were examined with an Axiovert 40 fluorescent microscope (Carl Zeiss, Oberkochen, Germany). To estimate myotube size, the diameter of at least 500 myotubes per condition in at least three independent cul-tures was measured using the ZEN lite software (Carl Zeiss, Oberkochen, Germany). The average diameter per myotube was calculated as the mean of three measurements taken along the length of the myotube. The fusion index is defined as the proportion of cells that contain three or more nuclei. The fusion index was determined after 5 days of differentia-tion by counting at least 1000 nuclei per condidifferentia-tion and per culture in three independent cultures.
Western blot
Proteins were extracted, and western blots were run as described,51see Supporting Information.
RNA extraction and quantitative real-time PCR
Total RNA extraction from myotubes was performed with Trizol® (Invitrogen, Carlsbad, CA, USA), according to the man-ufacturer’s instructions. The RNA quality and quantity were assessed by Nanodrop® spectrophotometry. Reverse transcription was performed with iScript cDNA synthesis kit (Bio-Rad, Hercules, CA, USA) from 1μg total RNA. Real-time
PCR experiments were performed using a MyIQ2
thermocycler (Bio-Rad). Melting curves were analysed to ensure the specificity of the amplification process. Target genes were normalized using the reference gene RPL-19 (ri-bosomal protein 19) orβ2-microglobulin (for the in vivo de-nervation experiment), see Supporting Information for additional details.
Androgen receptor luciferase activity measurement
Androgen receptor activity was measured with dual-luciferase reporter genes (Qiagen, Venlo, The Netherlands). C2C12 myoblasts were transfected by nucleofection accord-ing to the manufacturer’s instructions (Lonza formerly known as Amaxa®, Cologne, Germany). C2C12 myoblasts (1.106)
were suspended in mouse nucleofector solution with 4 μg of reporter or negative or positive control plasmids to ensure the transfection efficiency. The myoblasts were then nucleofected and cultivated as described earlier. The cells were treated the 4th day of differentiation and harvested the day after. For this purpose, the cells were lysed with
passive lysis buffer (Promega, The Netherlands), and firefly and renilla activities were measured using the dual-luciferase kit (Promega). AR activity was assessed by normalizing the firefly luciferase activity with the renilla luciferase activity.
In vivo models
Twelve-week-old male or female C57/Bl6 J mice (Janvier, France) were housed in cages placed in a controlled environ-ment (22–23°C, 14/10 h light/dark cycle). Mice were fed ad libitum with the standard laboratory chow and used for experiments within 3 weeks of their arrival. To ensure the effect of urolithin B on skeletal muscle hypertrophy, male mice were implanted subcutaneously with a mini-osmotic pump (Alzet Model 2004, ALZA, CA, USA), which delivered urolithin B (10μg/day) or DMSO, continuously. After 28 days, mice were injected intraperitoneally with 1μM of puromycin. Muscles, epididymal adipose tissue and testes were extracted 30 min after the injection. To assess the protective effects of urolithin B against muscle atrophy, unilateral sciatic nerve section was performed in female mice, and mini-osmotic pumps were implanted (Alzet Model 2001, ALZA, CA, USA) for delivering 10 μg/day urolithin B or DMSO. Three and 7 days after surgery, muscles from hindlimbs were removed. Muscles from the non denervated limb served as a control. All procedures used in this study were accepted by the com-mittee for ethical practices in animal experiments of the Université catholique de Louvain. The housing conditions were in accordance with the Belgian Law of 29 May 2013 on the protection of laboratory animals (agreement number: LA-1220548).
Histological analysis
Fresh tibialis muscles were collected, embedded with opti-mal cutting temperature (OCT) medium, and immediately frozen in isopentane cooled in liquid nitrogen. Transverse sections (15 μm in thickness) were cut with a cryostat. Sections were then stained with azorubine solution (1%) to allow quantification of fibre number and area using the imageJ software.
Statistical analysis
The results are expressed as means ± SEM. Statistical analy-ses between urolithin B and control groups were performed by Student’s t-test using Sigmaplot 12.5 software. When ex-perimental designs included more than two exex-perimental conditions and one or two factors, a one-way analysis of var-iance (ANOVA) or a two-way ANOVA was conducted after testing standard assumptions. When a main effect was iden-tified, Bonferroni post-hoc test was used to localize the
differences. Two-way ANOVA analyses were performed using GraphPad Prism 6. The significance threshold was set at a P-value<0.05.
Acknowledgements
The authors would like to thank Patrice Cani and Ronald Deumens for their useful advices concerning the surgery of animals. The authors also thank Caroline Bouzin for her help in microscopy analysis and Patrice Chiap and Jean-Claude Van Heugen for HPLC analyses. The authors certify that they com-ply with the ethical guidelines for authorship and publishing of the Journal of Cachexia, Sarcopenia, and Muscle.52
This work including the postdoctoral fellowship of J.R., was supported by PROCELL nutrition sprl and the Walloon region of Belgium. This work was also supported in part by the United States Department of Agriculture ARS Specific Cooper-ative agreement no. 58-6408-2-0009.
Authors
’ contributions
J.R. contributed to the experimental design, the execution of experiments, data analysis, and manuscript preparation. N.P., D.N., F.B., and L.D. participated to the execution of experi-ments. D.F. synthesized urolithins A and B. F.P. and M.F. supervised and contributed to the overall project and manu-script preparation. All authors revised and approved thefinal version of the manuscript.
Online supplementary material
Additional Supporting Information may be found in the online version of this article at the publisher's web-site:
Figure S1. Effect of urolithins A and B on the size and effect of urolithin B on the energy status of C2C12 myotubes. (A and C) After four days of differentiation, C2C12 myotubes were treated with urolithin B, urolithin A or vehicle DMSO (CTRL) for addition-ally 24 h. Cells were thenfixed and immunostained with anti-desmin, nuclei were revealed by Hoechst staining. Scale bar =50μm. (B and D) Mean diameter of the myotubes seen in A and C, respectively. Histograms are means ± SEM for 10 assays. Independent cell cultures were carried out in triplicate. At least 2000 myotubes were analysed for both treated and untreated cells. ***p< 0.001 vs CTRL cells (Student’s t-test). (E) Effect of urolithin B (UroB, 15μM) on the adenine nucleotides ratio in C2C12 myotubes. (F) C2C12 myotubes were treated with urolithin B (UroB, 15μM) for 24 h. Western blot analysis and rep-resentative image for phosphorylated-LKB1. (G-H) C2C12 myotubes were treated with 15 μM urolithin B or 15 μM
urolithin A or a vehicle DMSO. Representative image of WB anal-ysis for puromycin and eEF2, a stable protein in our samples. Quantification of the puromycin-labeled peptides, expressed as a percentage of the values obtained in untreated CTRL cells. Data are means ± SEM. P-values were determined by one-way ANOVA with Bonferroni post-hoc test. ***p< 0.001 vs CTRL.
Figure S2. Urolithin B does not regulate autophagy in C2C12 myotubes. (A) Quantification and representative immunoblots of the ULK1 phosphorylation state at Ser757 and (B) the ratio LCBII/?LC3BI. (C) Effect of urolithin B on Lc3b, p62 and Gabarapl-1 mRNA levels, normalized to RPL-19 mRNA, as assessed by qPCR. Incubation conditions: urolithin B (UroB-15μM), insulin (Ins-100 nM) and rapamycin (Rapa-40 nM). P-values were determined by t-test. *p < 0.05, **p < 0.01, ***p< 0.001 vs CTRL
Figure S3. Positive and negative controls supporting the implica-tion of the androgen receptor in enhancement of myotube growth induced by urolithin B. (A-C) The androgen receptor (AR) was inactivated in C2C12 myotubes by siRNA targeting the receptor (siRNA AR). (A) mRNA level of AR in cells transfected with a scramble (Scr) or siRNA, and treated or not with 15μM of urolithin B. (B-C) Myotubes were treated, during 24 h, with 100 nM insulin (Ins) as a positive control. (A) Representative im-munofluorescence images of myotubes, transfected with siRNA AR or the scramble vector (Scr), and stained with anti-desmin an-tibody and Hoescht. (B) Quantification of myotube size. Data are means ± SEM from 3 experiments, each with>300 myotubes measured per condition. P-values were determined by two-way ANOVA with Bonferroni post-hoc test. *p < 0.05, **p< 0.01 vs Scr CTRL,ααp < 0.01 vs siRNA AR CTRL. (C-D) The estrogen receptor 1 (ER1) was inactivated in C2C12 myotubes by siRNA targeting the receptor (siRNA ER1). Myotubes were then treated during 24 h with either vehicle DMSO or 15μM urolithin B (UroB) or 100 nM testosterone (T) used as a positive control. (C) Representative immuno fluores-cence images of myotubes, transfected with siRNA targetting the ER1 or Scr, and stained with anti-desmin antibody and Hoescht. (D) Quantification of myotube size. Data are means ± SEM from 3 experiments, each with>300 myotubes measured
per condition. P-values were determined by two-way ANOVA and a Bonferroni post-hoc test. *p < 0.05, **p < 0.01, ***p < 0.001 vs Scr CTRL; $$$p < 0.001 vs Scr UroB, ££
£
p< 0.001 vs Scr T;ααp< 0.01,αααp< 0.001 vs siRNA ER1 CTRL. Figure S4. Urolithin B increases puromycin incorporation in soleus muscle. (A) Representative image of WB analysis for puromycin, from SOL protein samples. (B) Quanti fica-tion of the puromycin-labeled peptides in SOL muscle, expressed as a percentage of the values obtained in the control group. Data are means ± SEM from 6 mice per con-dition. P-values were determined with Student’s t-test. **p< 0.01, vs CTRL group.
Figure S5. Signaling associated with reduction of muscle atrophy by urolithin B in mice. (A-F) Representative im-munoblots and quantification for total FoxO3a or
phos-phorylated FoxO1/?FoxO3a normalized to GAPDH
expression, for the ratio of phosphorylated Akt on total Akt, for the ratio of phosphorylated AMPK on total AMPK, for the ratio of phosphorylated mTOR on total mTOR or for the ratio of phosphorylated rpS6 on total rpS6. Data are means ± SEM, n = 5 mice per condition. P-values were determined with two-way ANOVA with Bonferroni post-hoc test. *p < 0.05 vs CTRL. (G) mRNA level normalized to β2-microglobulin level and (H) pro-tein level (representative immunoblot + quantification) for aromatase. Data are means ± SEM, n = 5 mice per condition. P-values were determined with two-way ANOVA and a Bonferroni post-hoc test. *p < 0.05, **p < 0.01 and ***p < 0.001 vs CTRL group.
Supplemental Experimental Procedures
Con
flict of interest
F.P. is stockholder of Procell nutrition sprl. J.R., F.P., and M.F. are inventors on a patent application involving urolithin B.
References
1. Glass DJ. Skeletal muscle hypertrophy and atrophy signaling pathways. Int J Biochem Cell Biol 2005;37:1974–1984.
2. Cerda B, Periago P, Espin JC, Tomas-Barberan FA. Identification of urolithin a as a metabo-lite produced by human colon microflora from ellagic acid and related compounds. J Agric Food Chem 2005;53:5571–5576. 3. Espin JC, Gonzalez-Barrio R, Cerda B,
Lopez-Bote C, Rey AI, Tomas-Barberan FA. Iberian pig as a model to clarify obscure
points in the bioavailability and
metabolism of ellagitannins in humans. J Agric Food Chem 2007;55:10476–10485. 4. Gonzalez-Barrio R, Truchado P, Ito H, Espin
JC, Tomas-Barberan FA. UV and MS identi-fication of urolithins and nasutins, the bio-available metabolites of ellagitannins and ellagic acid in different mammals. J Agric Food Chem 2011;59:1152–1162.
5. Seeram NP, Henning SM, Zhang Y, Suchard M, Li Z, Heber D. Pomegranate juice ellagitannin metabolites are present in hu-man plasma and some persist in urine for
up to 48 hours. J Nutr
2006;136:2481–2485.
6. Cerda B, Espin JC, Parra S, Martinez P, Tomas-Barberan FA. The potent in vitro an-tioxidant ellagitannins from pomegranate juice are metabolised into bioavailable
but poor antioxidant
hydroxy-6H-dibenzopyran-6-one derivatives by the colonic microflora of healthy humans. Eur J Nutr 2004;43:205–220.
7. Sreekumar S, Sithul H, Muraleedharan P, Azeez JM, Sreeharshan S. Pomegranate
fruit as a rich source of biologically active
compounds. Biomed Res Int
2014;2014:686921.
8. Gimenez-Bastida JA, Gonzalez-Sarrias A, Larrosa M, Tomas-Barberan F, Espin JC, Garcia-Conesa MT. Ellagitannin metabo-lites, urolithin A glucuronide and its aglycone urolithin A, ameliorate TNF- α-induced inflammation and associated
molecular markers in human aortic
endothelial cells. Mol Nutr Food Res 2012;56:784–796.
9. Larrosa M, Gonzalez-Sarrias A, Yanez-Gas-con MJ, Selma MV, Azorin-Ortuno M, Toti S, et al. Anti-inflammatory properties of a pomegranate extract and its metabolite urolithin-A in a colitis rat model and the ef-fect of colon inflammation on phenolic me-tabolism. J Nutr Biochem 2010;21:717–725. 10. Qiu Z, Zhou B, Jin L, Yu H, Liu L, Liu Y, et al. In vitro antioxidant and antiproliferative effects of ellagic acid and its colonic metabolite, urolithins, on human bladder cancer T24 cells. Food Chem Toxicol 2013;59:428–437. 11. Trombold JR, Barnes JN, Critchley L, Coyle
EF. Ellagitannin consumption improves strength recovery 2–3 d after eccentric exer-cise. Med Sci Sports Exerc 2010;42:493–498. 12. Rodriguez J, Gilson H, Jamart C, Naslain D, Pierre N, Deldicque L, et al. Pomegranate and green tea extracts protect against ER stress induced by a high-fat diet in skeletal
muscle of mice. Eur J Nutr 2014;
doi:10.1007/s00394-014-0717-9. 13. Li M, Kai Y, Qiang H, Dongying J.
Biodegra-dation of gallotannins and ellagitannins. J Basic Microbiol 2006;46:68–84.
14. Li H, Choudhary SK, Milner DJ, Munir MI, Kuisk IR, Capetanaki Y. Inhibition of desmin expression blocks myoblast fusion and interferes with the myogenic regulators
MyoD and myogenin. J Cell Biol
1994;124:827–841.
15. Gingras AC, Kennedy SG, O’Leary MA, Sonenberg N, Hay N. 4E-BP1, a repressor of mRNA translation, is phosphorylated and inactivated by the Akt(PKB) signaling pathway. Genes Dev 1998;12:502–513. 16. Sabers CJ, Martin MM, Brunn GJ, Williams
JM, Dumont FJ, Wiederrecht G, et al. Isola-tion of a protein target of the FKBP12-rapamycin complex in mammalian cells. J Biol Chem 1995;270:815–822.
17. Goodman CA, Mabrey DM, Frey JW, Miu MH, Schmidt EK, Pierre P, et al. Novel in-sights into the regulation of skeletal mus-cle protein synthesis as revealed by a new nonradioactive in vivo technique. FASEB J 2011;25:1028–1039.
18. Sakuma K, Aoi W, Yamaguchi A. The in-triguing regulators of muscle mass in sarcopenia and muscular dystrophy. Front Aging Neurosci 2014;6:230.
19. Kim J, Kundu M, Viollet B, Guan KL. AMPK and mTOR regulate autophagy through direct phosphorylation of Ulk1. Nat Cell Biol 2011;13:132–141.
20. Sandri M, Sandri C, Gilbert A, Skurk C, Calabria E, Picard A, et al. Foxo transcrip-tion factors induce the atrophy-related
ubiquitin ligase atrogin-1 and cause skele-tal muscle atrophy. Cell 2004;117:399–412. 21. Brunet A, Bonni A, Zigmond MJ, Lin MZ, Juo P, Hu LS, et al. Akt promotes cell sur-vival by phosphorylating and inhibiting a Forkhead transcription factor. Cell 1999;96:857–868.
22. Bodine SC, Latres E, Baumhueter S, Lai VK, Nunez L, Clarke BA, et al. Identification of ubiquitin ligases required for skeletal
muscle atrophy. Science
2001;294:1704–1708.
23. Zhao J, Brault JJ, Schild A, Cao P, Sandri M, Schiaffino S, et al. FoxO3 coordinately
acti-vates protein degradation by the
autophagic/lysosomal and proteasomal pathways in atrophying muscle cells. Cell Metab 2007;6:472–483.
24. Mammucari C, Milan G, Romanello V, Masiero E, Rudolf R, Del Piccolo P, et al. FoxO3 controls autophagy in skeletal mus-cle in vivo. Cell Metab 2007;6:458–471. 25. White JP, Gao S, Puppa MJ, Sato S, Welle
SL, Carson JA. Testosterone regulation of Akt/mTORC1/FoxO3a signaling in skeletal
muscle. Mol Cell Endocrinol
2013;365:174–186.
26. Adams LS, Zhang Y, Seeram NP, Heber D, Chen S. Pomegranate ellagitannin-derived compounds exhibit antiproliferative and antiaromatase activity in breast cancer cells in vitro. Cancer Prev Res (Phila) 2010;3:108–113.
27. Furr BJ, Tucker H. The preclinical develop-ment of bicalutamide: pharmacodynamics
and mechanism of action. Urology
1996;47:13–25, discussion 9-32.
28. Espin JC, Larrosa M, Garcia-Conesa MT, Tomas-Barberan F. Biological significance of urolithins, the gut microbial ellagic acid-derived metabolites: the evidence so far. Evid Based Complement Alternat Med 2013;2013:270418.
29. Rodriguez J, Vernus B, Chelh I, Cassar-Malek I, Gabillard JC, Hadj Sassi A, et al. Myostatin and the skeletal muscle atrophy and hypertrophy signaling pathways. Cell Mol Life Sci 2014;71:4361–4371. 30. Ogawa M, Kariya Y, Kitakaze T, Yamaji R,
Harada N, Sakamoto T, et al. The
preven-tive effect of beta-carotene on
denervation-induced soleus muscle
atro-phy in mice. Br J Nutr
2013;109:1349–1358.
31. Dyle MC, Ebert SM, Cook DP, Kunkel SD, Fox DK, Bongers KS, et al. Systems-based discovery of tomatidine as a natural small molecule inhibitor of skeletal muscle atro-phy. J Biol Chem 2014;289:14913–14924. 32. Kunkel SD, Suneja M, Ebert SM, Bongers
KS, Fox DK, Malmberg SE, et al. mRNA expression signatures of human skeletal muscle atrophy identify a natural com-pound that increases muscle mass. Cell Metab 2011;13:627–638.
33. Basualto-Alarcon C, Jorquera G, Altamirano F, Jaimovich E, Estrada M. Testosterone sig-nals through mTOR and androgen receptor to induce muscle hypertrophy. Med Sci Sports Exerc 2013;45:1712–1720.
34. Ibebunjo C, Eash JK, Li C, Ma Q, Glass DJ. Voluntary running, skeletal muscle gene expression, and signaling inversely regu-lated by orchidectomy and testosterone re-placement. Am J Physiol Endocrinol Metab 2011;300:E327–E340.
35. Serra C, Sandor NL, Jang H, Lee D, Toraldo G, Guarneri T, et al. The effects of testos-terone deprivation and supplementation on proteasomal and autophagy activity in the skeletal muscle of the male mouse: dif-ferential effects on high-androgen re-sponder and low-androgen responder muscle groups. Endocrinology 2013;154: 4594–4606.
36. Shen M, Zhang Z, Ratnam M, Dou QP. The interplay of AMP-activated protein kinase and androgen receptor in prostate cancer cells. J Cell Physiol 2014;229:688–695. 37. Zhao W, Pan J, Wang X, Wu Y, Bauman WA,
Cardozo CP. Expression of the muscle atro-phy factor muscle atrophy F-box is suppressed by testosterone. Endocrinology 2008;149:5449–5460.
38. Zhao W, Pan J, Zhao Z, Wu Y, Bauman WA, Cardozo CP. Testosterone protects against dexamethasone-induced muscle atrophy, protein degradation and MAFbx
upregula-tion. J Steroid Biochem Mol Biol
2008;110:125–129.
39. Pires-Oliveira M, Maragno AL, Parreiras-e-Silva LT, Chiavegatti T, Gomes MD, Godinho RO. Testosterone represses ubiq-uitin ligases atrogin-1 and Murf-1 expres-sion in an androgen-sensitive rat skeletal muscle in vivo. J Appl Physiol (1985). 2010;108:266–273.
40. Chen SA, Besman MJ, Sparkes RS, Zollman S, Klisak I, Mohandas T, et al. Human aro-matase: cDNA cloning, Southern blot anal-ysis, and assignment of the gene to chromosome 15. DNA 1988;7:27–38. 41. Satoh K, Sakamoto Y, Ogata A, Nagai F,
Mikuriya H, Numazawa M, et al. Inhibition of aromatase activity by green tea extract catechins and their endocrinological ef-fects of oral administration in rats. Food Chem Toxicol 2002;40:925–933.
42. Coward RM, Rajanahally S, Kovac JR, Smith RP, Pastuszak AW, Lipshultz LI. Anabolic steroid induced hypogonadism in young men. J Urol 2013;190:2200–2205.
43. Herbst KL, Anawalt BD, Amory JK,
Matsumoto AM, Bremner WJ. The male contraceptive regimen of testosterone and levonorgestrel significantly increases lean mass in healthy young men in 4 weeks, but attenuates a decrease in fat mass in-duced by testosterone alone. J Clin Endocrinol Metab 2003;88:1167–1173. 44. O’Leary MF, Hood DA. Effect of prior
chronic contractile activity on mitochon-drial function and apoptotic protein expression in denervated muscle. J Appl Physiol (1985) 2008;105:114–120. 45. Quy PN, Kuma A, Pierre P, Mizushima N.
Proteasome-dependent activation of mam-malian target of rapamycin complex 1 (mTORC1) is essential for autophagy sup-pression and muscle remodeling following
denervation. J Biol Chem 2013; 288:1125–1134.
46. O’Leary MF, Hood DA. Denervation-induced oxidative stress and autophagy signaling in muscle. Autophagy 2009;5:230–231. 47. Beehler BC, Sleph PG, Benmassaoud L,
Grover GJ. Reduction of skeletal muscle at-rophy by a proteasome inhibitor in a rat model of denervation. Exp Biol Med (May-wood) 2006;231:335–341.
48. MacDonald EM, Andres-Mateos E, Mejias R, Simmers JL, Mi R, Park JS, et al.
Denervation atrophy is independent from Akt and mTOR activation and is not res-cued by myostatin inhibition. Dis Model Mech 2014;7:471–481.
49. Shao C, Liu M, Wu X, Ding F. Time-depen-dent expression of myostatin RNA tran-script and protein in gastrocnemius muscle of mice after sciatic nerve resec-tion. Microsurgery 2007;27:487–493. 50. Pierre N, Barbe C, Gilson H, Deldicque L,
Raymackers JM, Francaux M. Activation of ER stress by hydrogen peroxide in
C2C12 myotubes. Biochem Biophys Res Commun 2014;450:459–463.
51. Rodriguez J, Fernandez-Verdejo R, Pierre N, Priem F, Francaux M. Endurance train-ing attenuates catabolic signals induced by TNF-α in muscle of mice. Med Sci Sports Exerc 2015.
52. von Haehling S, Morley JE, Coats AJS, Anker SD. Ethical guidelines for publishing in the Journal of Cachexia, Sarcopenia and
Muscle: update 2015. J Cachexia