UNIVERSITÉ DE MONTRÉAL
RETINAL OPTICAL IMAGING OF INTRINSIC
SIGNALS
AZADEH NADERIAN
INSTITUT DE GÉNIE BIOMÉDICAL
DÉPARTEMENT DE PHARMACOLOGIE ET PHYSIOLOGIE
FACULTÉ DE MÉDECINE
UNIVERSITÉ DE MONTRÉAL
THÈSE PRÉSENTÉE EN VUE DE L’OBTENTION
DU DIPLÔME DE PHILOSOPHIÆ DOCTOR
(GÉNIE BIOMÉDICAL)
NOVEMBRE 2017
II
DEDICATION
III
ACKNOWLEDGMENTS
I would like to express my sincere gratitude to my Ph.D. advisor professor, Dr. Christian Casanova for his patience, guidance, and support. I appreciate your understanding and considerations. With your busy schedule as the director of the school, you have put the time to listen to me with patience and understanding whenever I have needed. I would also like to express my appreciation and thanks to my co-advisor professor, Dr. Frederic Lesage. Your motivation, calmness and positive personality not only helped me a lot during my research but also inspired me as a person. I have learned a lot from the positive and supportive ambiance of your laboratory in the months that I had the chance to work at Polytechnique.
My sincere thanks to Dr. Sébastien Thomas for his supervision, help, advice and prompt corrections.
I would especially like to thank Dr. Samuel Bélanger for his help and many insightful discussions and suggestions. Special thanks to Bruno Oliveira for all his help in the lab as well as his motivation, enthusiasm, and patience in trying new things. My appreciation to Genviève Cyr, for her valuable technical assistance.
I would also like to sincerely thank all my labmates of my both labs in UdeM and Polytechnique who ease the difficulties of research by their support and scientific discussions. I wish you all the best.
IV
I gratefully thank all of my friends in the student office who made the bureau my second home, especially Robyn who with her presence brought color and energy to our office. I also appreciate her language corrections for my thesis.
The most important of all in the world I thank my parents. Whatever I have in my life is because of their unconditional love and support. Your prayer for me was what sustained me thus far. And all my efforts in life is because of your love and happiness.
The greatest thanks to my dearest sister and best friend, Ghazal. You have supported me through many ups and downs during last three years. Your kind and helpful hand always brought me out of all the difficulties.
The best thing that happened to me during my study was to get to know my beloved husband, Majid during my stay in Polytechnique. Your presence, love, and support during the last year of my study gave me lots of motivation to continue.
V
Résumé
Mots-clés: rétine, imagerie intrinsèque, modèle animal, conception d’appareillage, système imagerie, électrorétinogramme, photorécepteurs, cellules bipolaires, cellules ganglionnaires.
Une méthode relativement récente qui est utilisée pour étudier l'activité neuronale de façon indirecte désigne l’imagerie optique des signaux intrinsèques. Cette méthode a d’abord été utilisée afin de visualiser l’activité corticale. L'imagerie optique intrinsèque mesure les variations de réflectance de la lumière associées à l'activité du tissu nerveux. Les études au niveau cérébral ont montré que ces changements de réflectance sont attribuables à des changements de volume et de flot sanguin, du niveau d'oxygénation de sang (oxymétrie), et de la dispersion de la lumière. Similairement, les études sur l'application de cette méthode d’imagerie au niveau de la rétine montrent la présence de signaux intrinsèques pendant l'activité rétinienne. Cependant, il apparait que les signaux intrinsèques observés dans la rétine ont leurs propres caractéristiques, étant donné la structure particulière de la rétine. L’origine anatomique de ces signaux intrinsèques est donc encore incertaine. L’imagerie optique intrinsèque rétinienne pourrait présenter un avenir prometteur pour le diagnostic de pathologies oculaires lors de tests cliniques. Toutefois, avant que cette technique puisse être utilisée en clinique, une connaissance détaillée des propriétés et de l'origine des signaux intrinsèques rétiniens est nécessaire. Le premier but de ce projet est d'étudier les réponses intrinsèques rétiniennes pour déterminer les caractéristiques ainsi que l'origine anatomique. Afin d’atteindre cet
VI
objectif un système imagerie rétinien (RFI), conçu pour l’œil humain est utilisé. Pour ce système, nous utiliserons le lapin comme modèle animal, car il a des yeux de grandeur comparable aux yeux humains. Plusieurs agents pharmacologiques ont été utilisés pour bloquer les différentes cellules de la rétine afin de déterminer l'origine du signal cellulaire intrinsèque dans lapin.
Le deuxième but de ce projet est de développer un système d'imagerie optique des signaux intrinsèques. Ce système est développé pour le modèle de rat. Un agent pharmacologique (Aspartate) est utilisé chez le rat afin de valider ce système imagerie. Nos résultats indiquent que dans la rétine du lapin les cellules bipolaires sont les principales cellules à l’origine des signaux intrinsèques rétiniens. De plus environ 20% des cellules ganglionnaires jouent un rôle dans la genèse des signaux intrinsèques. Nos résultats indiquent aussi qu’il est possible de construire un système d’imagerie efficace pour des petits animaux comme le rat. Les données obtenues avec ce nouveau système confirment que la rétine interne est à l’origine des signaux intrinsèques rétiniens.
VII
Abstract
Keywords: retina, intrinsic imaging, animal model, equipment design, imaging system,
electroretinogram, photoreceptors, bipolar cells, ganglion cells.
A relatively new method to study neural activity indirectly is optical imaging of intrinsic signals. This method was first used to visualize cortical activity. The intrinsic optical imaging measures the reflectance variations of light associated with the activity of nervous tissue. Brain studies have shown that these changes in reflectance are attributable to changes in volume, blood flow, blood oxygenation level (oximetry), and light scattering. Similarly, studies on the application of this imaging method to the retina show the presence of intrinsic signals during retinal activity. It appears that the intrinsic signals observed in the retina have their own characteristics, given the particular structure of the retina. The anatomical origins of these intrinsic signals are still uncertain. Retinal intrinsic optical imaging may provide a promising future for the diagnosis of eye diseases in clinical trials. Thus, before this technique can be used clinically, a detailed knowledge of the properties and origin of intrinsic signals are needed.
The first goal of this project is to study the retinal intrinsic responses to determine the characteristics and its anatomic origin. To achieve this aim, the retinal imaging system (RFI), designed for the human eye is used. For this system, we used the rabbit as the animal model because the size of their eyes is comparable to that of human. Several pharmacological agents have been used to block the different cells of the retina and to determine the origin of the intrinsic cellular signal in rabbits.
VIII
The second goal of this project is to develop an optical imaging system of intrinsic signals. This system was designed for the rat animal model. A pharmacological agent (Aspartate) is used to validate this imaging system on rats.
Our results indicate that in rabbit bipolar cells are the main cells responsible for the intrinsic retinal signals. Also, approximately 20% of the Ganglion cells also show that 20% play a role in the genesis of intrinsic signals. Our results also indicate that it is possible to construct an efficient imaging system for small animals such as rats. The data obtained with this new retinal imager confirm that the inner retina is at the origin of intrinsic retinal signals.
IX
Table of contents
DEDICATION ... II ACKNOWLEDGMENTS ... III RÉSUMÉ ... V ABSTRACT ... VII TABLE OF CONTENTS ... IX LIST OF TABLES ... XII LIST OF FIGURES ... ILIST OF ACRONYMS AND ABBREVIATIONS ... II
CHAPTER 1 ... 1 INTRODUCTION ... 1 1. THE RETINA ... 3 1.1 PHOTORECEPTORS ... 5 1.1.1 Rods and cones ... 6 1.2 BIPOLAR CELLS ... 8 1.3 HORIZONTAL CELLS ... 10 1.4 AMACRINE CELLS ... 10 1.5 INTERPLEXIFORM CELLS ... 11 1.6 GANGLION CELLS ... 11
2. THE NEUROTRANSMITTERS OF THE RETINA ... 14
3. PHARMACOLOGICAL DISSECTION OF RETINAL PATHWAYS ... 16
4. ANIMAL MODELS USED IN THIS STUDY ... 18
4.1 THE RETINA OF RABBIT ... 18
4.2 THE RETINA OF THE RAT ... 20
5. ELECTRORETINOGRAM (ERG) ... 22 5.1 ORIGIN OF FLASH ERG COMPONENTS ... 24 6. RETINAL IMAGING ... 27 6.1 RETINAL VASCULATURE ... 27 6.2 OPTICAL IMAGING OF INTRINSIC SIGNALS ... 29 6.2.1 The mechanism underneath the origin of intrinsic signals ... 30 6.2.2 The neurovascular coupling ... 31 6.2.3 The sources of intrinsic signal ... 32 6.2.4 The shape and time course of each signal ... 34 6.2.5 Spatial characteristic of intrinsic signals ... 35 6.2.6 The application of optical imaging of intrinsic signals ... 35
6.3 RETINAL OPTICAL IMAGING OF INTRINSIC SIGNALS ... 37
X CHAPTER 2 ... 41 ARTICLE 1: CELLULAR ORIGIN OF INTRINSIC OPTICAL SIGNALS IN THE RABBIT RETINA ... 41 ABSTRACT ... 42 1. INTRODUCTION ... 43 2. MATERIAL AND METHODS ... 45 2.1 RETINAL INTRINSIC IMAGING AND STIMULUS PARAMETERS ... 46 2.2 EXPERIMENTAL PROTOCOL ... 47 2.3 IMAGE AND DATA ANALYSIS ... 48 2.4 ELECTRORETINOGRAM (ERG) ... 48 2.5 INTRAVITREAL INJECTION ... 49 3. RESULTS ... 50 3.1 RIS BASIC CHARACTERISTICS ... 50 3.2 COMPARISON BETWEEN RIS AND ERG SIGNALS ... 51 3.3 ANATOMICAL ORIGIN OF RIS ... 52 3.3.1 Control for intravitreal injections ... 52 3.3.2 Isolation of photoreceptor’s activity ... 52 3.3.3 Injection of TTX, APB and PDA ... 53 4. DISCUSSION ... 55 4.1 ON THE RELATION BETWEEN RIS AND ERG ... 55 4.2 INTERSPECIES DIFFERENCES IN RIS ... 57 REFERENCES ... 61 FIGURES LEGENDS ... 65 SUPPLEMENTARY FIGURES ... 68 CHAPTER 3 ... 80
ARTICLE 2: RETINAL OPTICAL IMAGING USING INTRINSIC SIGNALS IN RAT’S RETINA ... 80
ABSTRACT ... 81
1. INTRODUCTION ... 81
2. RESULTS ... 84
2.1 PART 1: OPTICAL DESIGN OF THE FUNDUS OPTICAL IMAGER OF INTRINSIC SIGNALS ... 84
2.1.1 ZEMAX SIMULATION ... 85
2.1.2 OPTICAL SYSTEM ASSEMBLY ... 87
2.1.3 OPTICAL SYSTEM CHARACTERIZATION ... 88
2.2 PART 2: VALIDATION OF THE OPTICAL SYSTEM ... 89
2.2.1 EXPERIMENTAL SETUPS AND PROCEDURE ... 90
2.2.2 ANIMAL PREPARATION FOR IN-VIVO IMAGING ... 90
2.2.3 INTRAVITREAL INJECTION ... 91
2.2.4 ELECTRORETINOGRAMS (ERGS) RECORDINGS ... 92
2.2.5 IMAGING PROTOCOL ... 92
XI
2.2.7 IMAGING OF CONTROL RETINA AND ASPARTATE INJECTED RETINA WITH THE RETINAL
FUNCTIONAL IMAGER ... 94 3. DISCUSSION ... 96 REFERENCES ... 100 FIGURES ... 104 CHAPTER 4 ... 110 1. DISCUSSION ... 110 1.1 SUMMARY OF RESULTS ... 111 1.2 COMPARE & CONTRAST ... 112 1.3 TECHNICAL DIFFICULTIES ... 118 2. PROSPECTIVE ... 121 REFERENCES ... 123
XII
List of tables
List of figures
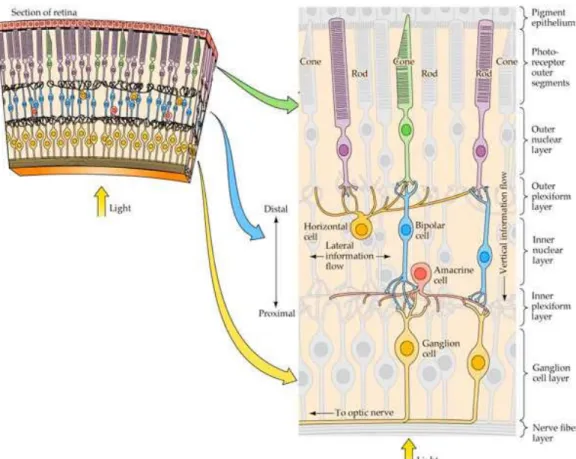
Figure 1-1: The structure of the retina. The image shows the arrangement of the retinal neuronal cells. The image is retrieved from:
http://163.178.103.176/Fisiologia/neurofisiologia/Objetivo_3/Album/pages/7_09_jp g.htm ... 4 Figure 2-1: The photoreceptors: Rods and cones: the 3 segment of the receptors (outer
segment, inner segment and synaptic segment) is indicated in Rods and Cones. http://thebrain.mcgill.ca/flash/d/d_02/d_02_m/d_02_m_vis/d_02_m_vis.html ... 5 Figure 3-1: Phototransduction. The process of phototransduction is shown in this figure in
order from 1 to 4. Image from:
http://openwetware.org/wiki/BIO254:Phototransduction ... 7 Figure 4-1: The ON and OFF pathway: The post-photoreceptor process is shown in the
picture. The image is retrieved from:
http://courses.washington.edu/psych333/handouts/coursepack/ch13Information_proc essing_in_retina. ... 9 Figure 5-1: The production of the action potential in the ganglion cells. Changes in
glutamate release from bipolars cause changes in the membrane potential of the GCs and so it produce the action potential. The image is retrieved from:
http://courses.washington.edu/psych333/handouts/coursepack/ch13-Information_processing_in_retina.pdf ... 13 Figure 6-1: The fundus image of (A) human (the image adapted from:
https://en.wikipedia.org/wiki/Fundus (eye)), (B) rabbit (the image adapted from:
http://www.medirabbit.com/EN/Eye_diseases/Clinical/Eye_diseases.htm), and (C) rat (the image dapted from: https://www.youtube.com/watch?v=l7HB50oHebk). .. 21 Figure 7-1: The ERG of the cat in response to the flash stimulus of 2 sec, modified from
(I. Perlman, 1995). ... 23 Figure 8-1: The human ERG recording in scotopic and photopic condition using short
stimuli of 10 microseconds. The a-wave and b-wave are illustrated in each condition. In photopic condition a flash of 2 db is used in the background of 30 cd/mm, and in the scotopic condition a flash of -4 db is used. ... 24 Figure 9-1: the optical absorption spectra of oxyhemoglobin in blue and
deoxyhemoglobin in red. The figure adapted from:
II
LIST OF ACRONYMS AND ABBREVIATIONS
This list presents in alphabetical order the abbreviations and acronyms used in the thesis as well as their meanings.
2-DG - 2-deoxyglucose
AMPA - α-amino-3-hydroxy-5-methyl-4-isoxazolepropionic acid
APB - 2-amino-4-phosphonobutyrate
ATP - Adenosine triphosphate
CDEA - Comité de déontologie de l'expérimentation sur les animaux
cGMP - cyclic guanosine monophosphate CW - corneal window
DBs - diffuse cone bipolar cells DTLs - Dawson, Trick and Litzkow ERG - electroretinogram
FWHM - full-width at half maximum GABA - Gamma aminobutyric acid GCs - Ganglion cells
HBR - deoxyhemoglobin HCs - Horizontal cells
iGluR - inonotropic glutamate receptors INL - inner nuclear layer
IPL - inner plexiform layer
III
LED - light-emitting diode
LGN - lateral geniculate nucleus
mGluR6 - metabotropic glutamate receptors OCT - optical coherent tomography
ONL - outer nuclear layer OPL - outer plexiform layer
PDA - cis-2,3-piperidinedicarboxylic acid PDE - phosphodiesterase
PhNR - photopic negative response RIS - Retinal intrinsic signals SEM - standard error by the mean SLO - scanning laser ophthalmoscope SNR - signal-to-noise ratio
TTX - tetrodotoxin
1
Chapter 1
Introduction
The retina is a part of the central nervous system, and thus its mechanisms can serve as a model for neuronal mechanisms and interactions throughout the nervous system. It is accessible by different imaging methods through the transparent media of the eye. Having accurate methods to study the retina is of great importance for clinical studies either towards detecting retinal diseases or follow up of treatment methods. So, in general, understanding the functions and cellular mechanism of the retina is of great importance for neuroscientists, vision scientists, and clinicians.
Different methods are used to study the structure of the retina (for example through imaging techniques such as scanning laser ophthalmoscopy (SLO) (Sharp & Manivannan, 1997; Yannuzzi et al., 2004) and optical coherence tomography (OCT) (Chen et al., 2005; Costa et al., 2006; Kiernan, Mieler, & Hariprasad, 2010)), as well as to study the function of the retina (by electroretinogram recordings (Frishman, 2006; Hood et al., 2012; McCulloch et al., 2015)). Having high-resolution imaging of retinal function is desirable. Optical imaging of intrinsic signals is a non-invasive method for assessing retinal function. Use of this imaging technique for the retina is relatively new, and it needs to be studied and characterized before being ready to be used in clinics and laboratories.
The present thesis aims to investigate and characterize retinal optical imaging of intrinsic signals via two independent studies. The first study had the aim to find the cellular origin
2
of intrinsic signals in the rabbit retina while the second study aimed to develop an optical imaging system adapted for small size eyes, namely the rat.
This thesis comprises four chapters. The first chapter will introduce the basic knowledge needed to understand and follow the study. To understand and characterize the retinal intrinsic signal accurately, revealed with optical imaging, we first need to know about the anatomy and physiology of the retina. The first part of the first chapter will cover this subject. Then in this chapter, the neurotransmitters of the retina will be presented. Knowing the neurotransmitters help us to choose more appropriately the pharmacological agents that we will use later during this study. These pharmacological agents will also be presented in this chapter. This chapter will also cover the basic knowledge about the optical imaging of the intrinsic signals, its principle, and its potential applications. Parallel to the optical imaging method I will always use ERG as a control method for measuring retinal activity during the study. Consequently, the ERG will also be presented in this chapter. The latter will end by introducing the aims of my study and the hypothesis for each aim.
The second chapter is the article written on the cellular origin of intrinsic signals in rabbit retina. It contains the methods used in the first study and the results obtained. The third chapter presents the second study, which is the development of an optical imaging system. This chapter will be presented as a methodological article. It explains in detail the method of constructing an optical imaging system adapted for the rat’s eye. It also shows the result of using this optical retinal imager on the rat’s retina. The fourth chapter contains the general discussion about the two studies of this thesis.
3
1. The Retina
Once passing the different optical parts of the eye, the light encounters the retina where it is converted into neural signals.
The retina consists of three cellular layers: The outer nuclear layer (ONL) which includes the photoreceptors, the inner nuclear layer (INL) which contains bipolar cells, horizontal cells, amacrine cells and interplexiform cells, and the ganglion cells layer. Between these nuclear layers exist two synaptic layers: the outer plexiform layer (OPL) and the inner plexiform layer (IPL). Figure 1-1 shows the structure of the retina and the arrangement of the retinal neuronal cells. Each neuronal cell type is discussed in more details in the following section.
The human retina contains an avascular area in its central zone, called macula in which the fovea can be found in the center of this area. The fovea is highly concentrated in cone photoreceptors and is responsible for human’s visual acuity and detailed vision (Yamada, 1969). In some other mammalian retinas, there is also a similar specialized region such as the area centralis in cats and visual streak, which is a long horizontal strip area, in rabbits (J. H. Prince, 1964; Yu & Cringle, 2004).
4
Figure 1-1: The structure of the retina. The image shows the arrangement of the retinal
neuronal cells. The image is retrieved from:
5
1.1 Photoreceptors
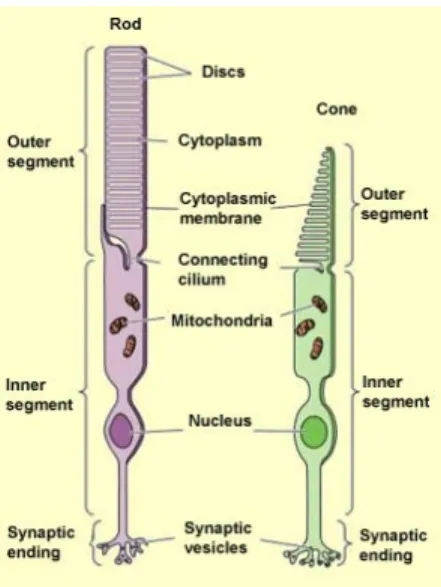
There are two types of photoreceptors: rods and cones. Traditionally, the shape of their outer segment differentiated each photoreceptor, but this criterion is not always reliable. The photoreceptors have various morphologies in different species. But, they are all composed of three separate segments. An outer segment which contains the visual pigments, an inner segment which contains the cell body, and a terminal which contains the synaptic ends and by which the photoreceptors connect to the bipolar cells and horizontal cells in the outer plexiform layer as shown in the figure 2-1.
Figure 2-1: The photoreceptors: Rods and cones: the 3 segment of the receptors (outer segment, inner segment and synaptic segment) is indicated in Rods and Cones. http://thebrain.mcgill.ca/flash/d/d_02/d_02_m/d_02_m_vis/d_02_m_vis.html
6
1.1.1 Rods and cones
Cones and rods operate at two different intensity levels. The cones are working under most conditions, or more precisely under any level of illumination where we can see distinct colors. Cones are responding fast, property, which becomes necessary where fast reactions are needed to survive. Also, they are sensitive to small changes in illumination (about 0.5 %) and can detect a contrast (Lamb, 2003). Cones need hundreds of photon hit per cone to be stimulated whereas rods are so sensitive that they can be stimulated by one or just a few photon. But they will be saturated in intense illumination, and it will take time for rods to recover after exposure to extremely intense illumination (Lamb, 2003). Unlike rods, which contain a single photopigment, cones have three different photopigments that are present in the outer segment of the photoreceptors and have a different sensitivity to light of different wavelengths. There are three types of cones, responding to the blue (420nm), green (531nm) and red (588nm) regions of the spectrum (Purves D, 2001).
Phototransduction is the first essential step in vision. This process, which is done by photoreceptors, converts light into a neuronal signal. The activation of the photosensitive pigment activates the transducins which, through the activation of phosphodiesterases, hydrolyze the cGMP molecules, close the sodium channels, and hyperpolarize the photoreceptors. Figure 3-1 demonstrates the process of phototransduction in a rod photoreceptor (Kolb, 1995c; Lamb, 2003). The activation of a single rhodopsin molecule by a single photon is sufficient to cause a significant change in the membrane conductance due to amplifications present during the transduction cascade. A single
7
activated rhodopsin can cause the hydrolysis of more than 100,000 molecules of cGMP per second (Fu, 1995; Lamb, 2003).
Figure 3-1: Phototransduction. The process of phototransduction is shown in this figure in order from 1 to 4. Image from: http://openwetware.org/wiki/BIO254:Phototransduction In the dark, a steady current of mostly Na+ (about 80%, also includes an approximately 15 % of Ca+ and 5% of Mg+), called ‘’dark current’’, depolarizes the photoreceptors (Kolb, 1995c). The depolarized photoreceptors release the neurotransmitter, glutamate, to the second order neurons (bipolar cells and horizontal cells). In bright conditions, photoreceptors are hyperpolarized and therefore inhibit the release of glutamate.
After reaching photoreceptors in the outer plexiform layer, the visual signal splits into two pathways via the bipolar cells: ON, which detects objects lighter than the background and OFF, which detects objects darker than the background. These two pathways are shown in figure 4-1. The function of the bipolar ON and OFF are discussed in more detail in the following section.
8
1.2 Bipolar cells
In mammals, there are different types of bipolar cells (9 to 11 have been distinguished), which among them there are cells that connect to cones and others that connect to rods mariani
(Kolb, 1970; Mariani, 1984). The dendritic arbor of rod-related bipolars are usually larger than that of the cone-related bipolars since a single rod-bipolar may connect to as many as 30 to 50 rod terminals and a single cone-bipolar may connect to one or more (between five to seven) cone terminals (Dowling & Boycott, 1966; R. Nelson & Connaughton, 1995).
In the primate retina, different types of bipolar cells are present. The diffuse cone bipolar cells (DBs) receive the information from multiple cones and converge the information. The degree of converges ranges from 5 to 7 cones in the central retina to 14 to 20 in the peripheral retina (Mariani, 1981). Another type of bipolar cells, which are known as midget bipolar cells, is connected only to one cone. This kind of bipolar cell is found mostly in the central part of the retina (fovea). There are only cones present in this area, and a single cone in the fovea connects to both on and off bipolar cells (Dowling & Boycott, 1966). Another type of the bipolar cell known in primates is a blue-cone-specific type, which connects only to blue sensitive cones (Kolb, 1970; R. Nelson & Connaughton, 1995).
The bipolar cells respond in two different manners to the presence of light, depending on the type of glutamate receptors that they have. They are bipolar cells, similar to photoreceptors, which hyperpolarize in the light. These are OFF-center cells and are the
9
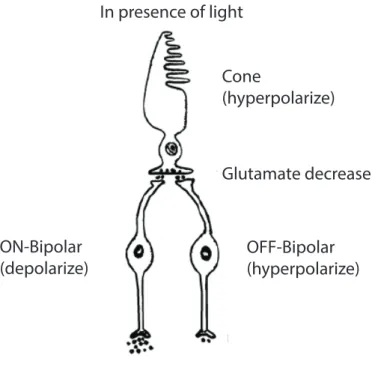
start of the off-center channel in the retina and then the visual pathways. These cells are driven via ionotropic (iGluR) AMPA-Kainate glutamate in their synapses with photoreceptors. The other group of the bipolar cell has metabotropic glutamate receptors (mGluR6). These cells depolarize in light, contrary to the photoreceptors, and are on the basis of the ON-center channel in the visual pathway (R. Nelson & Connaughton, 1995). Glutamate decrease OFF-Bipolar (hyperpolarize) ON-Bipolar (depolarize) Cone (hyperpolarize) In presence of light
Figure 4-1: The ON and OFF pathway: The post-photoreceptor process is shown in the picture. The image is retrieved from:
http://courses.washington.edu/psych333/handouts/coursepack/ch13Information_processin g_in_retina.
10
1.3 Horizontal cells
There are two basic types of horizontal cells known in mammalians: the A-type, which is an axonless cell, and the B-type, which is a cell containing an axon. In the presence of light, they hyperpolarize like photoreceptors, causing a feedback inhibitory signal to occur. This feedback signal provides a sum of information from a wide spatial area of the outer plexiform layer. Horizontal cells (HCs) receive their input from many photoreceptors cells, cones, and rods. They transmit a feedback signal, which alters the release of neurotransmitters from photoreceptors. This feedback organizes the center-surround receptive field of bipolar cells (Ido Perlman, Kolb, & Nelson, 2003). The horizontal cells have AMPA receptors. When in darkness, there is a continuous release of glutamate, which ultimately depolarizes these cells and renders them into an active state. In light conditions, the AMPA receptors deactivate, and the HCs hyperpolarize (Ido Perlman et al., 2003).
1.4 Amacrine cells
This name was given by Cajal to signify that these cells have no axon. They are the most diverse of all the retinal cells. In mammals, there are 20 to 30 different types of amacrine cells (Masland, 2012). The two principal types of amacrine cell are diffuse and stratified. The diffuse cells process through the whole thickness of the inner plexiform layer, whereas the stratified amacrine cells process in one or few strata of the inner plexiform layer. There were also other classifications done after Cajal, based on the dendritic spread of the cells in one or several levels in the inner plexiform layer such as mono-, bi-, and
11
multistratified amacrine cells. Some amacrine cells are named based on the shape of their dendrite tree such as starburst, while others are named based on their neuroactive substance such as dopaminergic amacrine cells. Some cells are also appointed by non-descriptive titles such as A1, AII, and A17.
Amacrine cells are known to have also diversity in their functional role. It is thus difficult to name a general role for all the amacrine cells since each of the cells can have a different transmission of information through the retina.
One of the roles of amacrine cells is that they make a feedback connection to the bipolar cells in IPL. Thus, another center-surround mechanism is occurring in the IPL with the role of amacrine cells being somehow similar to that of horizontal cells in OPL. Most of the amacrine cells in mammals have inhibitory neurotransmitters GABA or Glycine (Kolb, 1995a, 1995d; MacNeil & Masland, 1998).
1.5 Interplexiform cells
Interplexiform cells are believed to extend processes into both inner and outer plexiform layers of the retina. They also appear to carry information from inner to outer plexiform layers (Gallego, 1971). These cells were initially considered amacrine cells, however later they were found unique cells given their differences.
1.6 Ganglion cells
Ganglion cells are post-synaptic to bipolar cells and amacrine cells. Similar to the amacrine cells, the ganglion cells can also be classified into two major groups based on
12
the morphology of their dendrites: stratified or diffuse and can be further sub-divided into small- and large-field, mono-, bi, and multistratified (Grunert, 2003; R. Nelson, 1995). The ganglion cells can be divided into two major functional groups namely ON and OFF, which transfer the information about the light increment and decrement, as it is the case for bipolar cells. They also exhibit antagonistic surrounds. The ON ganglion cells and OFF ganglion cells are determined by the bipolar cells that contact with them (Kolb, 1995a).
The ON and OFF class of ganglion cells can be each divided into two main morphological type. In primates, those are the parvo (P) and magno (M) classes. The parvo cells (P-cells) are midget ganglion cells, and they project to the parvocellular layer of the lateral geniculate nucleus (LGN). They are known to transfer the visual information about form and color. The magno cells (M-cells) are parasol ganglion cells and project to the magnocellular layer of the LGN. They transmit visual information about motion and spatial relationship (Botir T. Sagdullaev, 2008).
In the central retina, the midget GCs are the major type of ganglion cells (about 70%). In the central retina which has the high resolution, a cone connects to two separate midget ganglion cells via an ON-bipolar cell and an OFF-bipolar cell (Boycott & Wassle, 1974; Kolb, Nelson, & Mariani, 1981).
About 10 % of the retinal ganglion cells are parasols and are receiving inputs from many bipolar cells (Dacey, 1993).
Ganglion cells produce action potentials and are the only cells in the retina that are doing so (apart from a few amacrine cells). However, they produce action potentials only when they receive sufficient glutamate from the bipolar cells. Changes in glutamate release
13
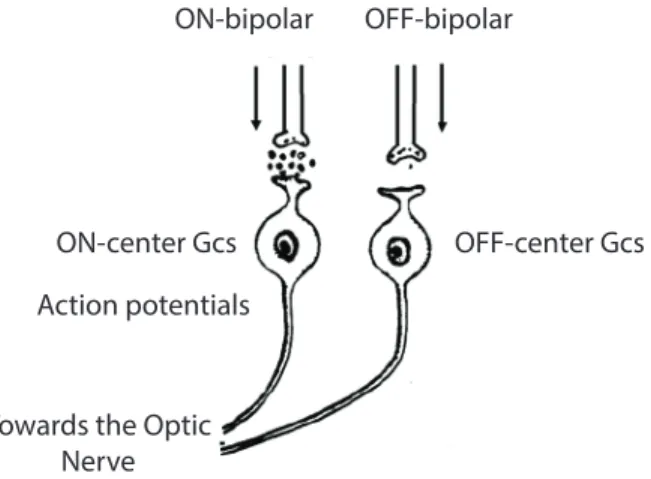
from bipolar cells cause changes in the membrane potential of the GCs and produce an action potential only when this change is enough to depolarize the ganglion cells to threshold (Dacey, 1993; Kolb, 1995a). The action potential is then transmitted to the brain by the axons of the optic nerve as is shown in figure 5-1.
ON-bipolar OFF-bipolar
ON-center Gcs OFF-center Gcs Action potentials
Towards the Optic Nerve
Figure 5-1: The production of the action potential in the ganglion cells. Changes in glutamate release from bipolars cause changes in the membrane potential of the GCs and so it produce the action potential. The image is retrieved from:
http://courses.washington.edu/psych333/handouts/coursepack/ch13-Information_processing_in_retina.pdf
14
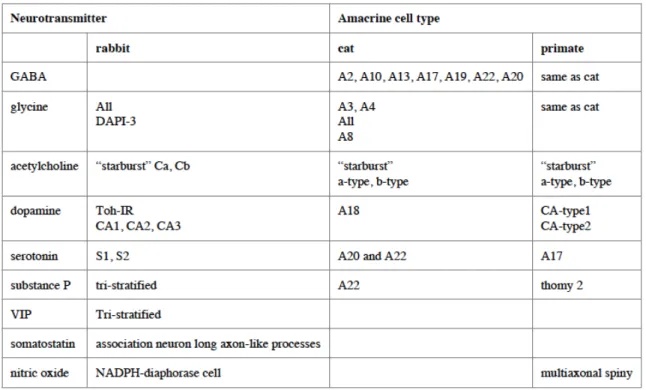
2. The neurotransmitters of the retina
The neurochemistry of the retina is complex and reflects the diversity of its cell constituents. The various neurotransmitters found in the mammalian retina are listed in Table 1 (Kolb, 1995b). As categorized earlier, the visual information is transferred to the brain through three major cells in the vertical pathway of the retina: photoreceptors, bipolar cells, and ganglion cells. The visual signals of the vertical pathway can then be altered by the cells in horizontal pathways at two levels: the outer plexiform layer via horizontal cells and the inner plexiform layer via amacrine and inner plexiform cells. All of these cells use different neurotransmitters (excitatory and inhibitory) to transfer visual information.
The major neurotransmitter of neurons in the vertical pathway is the excitatory amino acid glutamate (Connaughton, 1995; Thoreson & Witkovsky, 1999). The photoreceptors (rods and cones) release glutamate to transmit the signal to the second order neurons (bipolar cells and horizontal cells). In the second order neurons, this signal passes through two different types of sensory channels. One type of post synaptic receptor is the metabotropic glutamate channel (mGluR6) in ON- bipolar cells, and the other type is ionotropic in the OFF-bipolar cells via at least two types of AMPA receptors and Na ions (Connaughton, 1995; Thoreson & Witkovsky, 1999).
Glutamate is also known to be the neurotransmitter of the bipolar cells to transfer the visual signal to the third order neurons (Ganglion cells and amacrine cells) in the inner plexiform layer.
15
The two major inhibitory neurotransmitters in the retina are Gamma aminobutyric acid (GABA) and Glycine. Bipolar cells have receptors for GABA (A, B, and C type), dopamine (D1) and Glycine in the IPL. GABA is associated with many large field amacrine cells, and Glycine is associated in most of the small-field types of amacrine cells (Kolb, 1995b). There are also other neurotransmitter substances in the mammalian retina as shown in table 1.
16
3. Pharmacological dissection of retinal pathways
In our study, we will use different pharmacological agents to block the activity of various retinal cells and to explore the role of that particular cell type on the intrinsic signal captured in optical retinal imaging. So, in this section, I will present the pharmacological agents that will be used later in the study.
Since it is known that the neurotransmitter of the photoreceptors is L-Glutamate, using the agonists or antagonists of the L-glutamate can block the synaptic transmission from the photoreceptors and isolate the photoreceptors. Aspartate is an excitatory amino acid like glutamate, that when present in excess, can be toxic to retinal neurons. Aspartate can block the uptake of glutamate, thus saturate the synapses (Bloomfield & Dowling, 1985; Mosinger & Altschuler, 1985). It can be used to isolate the photoreceptors from other retinal cells.
2-amino-4-phosphonobutyrate (APB) is a glutamatergic receptor agonist. This agonist is shown to selectively block the transmission from photoreceptors to depolarizing bipolar cells (ON bipolars) while not affecting any other retinal neurons (Knapp & Schiller, 1984; Massey, Redburn, & Crawford, 1983; Slaughter & Miller, 1981).
To prevent the activity of the OFF pathway a glutamatergic receptor antagonist called PDA (cis-2,3-piperidinedicarboxylic acid) is used (Hare & Ton, 2002). Application of it blocks the transmission from photoreceptors to OFF bipolar cells and horizontal cells. In IPL it also blocks the transmission of both ON and OFF bipolar cells to amacrine cells
17
and ganglion cells (Massey & Miller, 1988). So the application of PDA results in the isolation of photoreceptors and ON bipolar cells.
Retinal ganglion cells generate action potentials in response to light stimuli. To block the voltage-gated sodium channel a highly specific blocker can be used called tetrodotoxin (TTX) (Narahashi, Moore, & Scott, 1964).
18
4. Animal models used in this study
Choosing the animal species for retinal studies depends on several factors including similarity of the ocular structures to those of humans, availability, cost, simplicity for experimentation, and prior knowledge about retinal structure and function (A.Tsonics, 2008). Rabbits and rats are two animal models used in the present study.
In our first study, we used the rabbit as the animal model. Rabbits have big eyes, similar in size to the human eye and can easily be used for ophthalmic research. Although the rabbit eye has a poorly developed retinal vascular system, the structure of the retina is similar to that of other mammals and primates (A.Tsonics, 2008; Hughes, 1971).
For the second study, we used the rat as our animal model. Rats have a well-developed retinal vascular system, as with humans, with arteries and veins emerging radially from the optic disc. The retinal structure is also similar to humans, composed of three layers of nuclei, and two synaptic layers (A.Tsonics, 2008; Hughes, 1979).
In the following section, I will present the retinal structure of these two animal models in more details.
4.1 The retina of rabbit
There is a lot of resemblance between the retinal elements of the rabbit and that of a rat or human. The rabbit retina also contains three nuclear layers: outer nuclear layer, inner nuclear layer and ganglion cells and two plexiform layers (inner and outer). The primary difference of the rabbit retina is the visual streak in the rabbit retina (Hughes, 1971).
19
The visual streak is the horizontal region parallel to the blood vessels and perpendicular to the fibers. The origin of the term visual streak is apparent from the band of high ganglion cell count running under the retinal blood vessels for most of the length of the retina. Although there is a change of the density of the ganglion cells along the length of the visual streak itself, the decline in density is most immediately noticeable in comparing the streak to the retina above or below of the streak (Caldwell & Daw, 1978; Hughes, 1971).
The number of the receptors also reveals the existence of a high density of photoreceptors in the area of visual streak. The slight excess of inner layer nuclei (bipolar cells, horizontal cells, and amacrine cells) over photoreceptors in this area indicates a lesser degree of convergence in the connection of the photoreceptors to the post-photoreceptors cells (Caldwell & Daw, 1978; Hughes, 1971). In the inner retina, the count ratio of the inner nuclear layer to the ganglion cells changes from a value of five at the streak to one of about 95 in the peripheral retina. All these cell connections and ratios reflect a different organization at the visual streak (J. H. Prince, 1964).
Another difference of the rabbit retina to the human retina is its vasculature. The retinal vasculature supplied by the central retinal artery and drained by several veins confines itself to a pair of wing shape areas that extend from the optic nerve head both medially and laterally (De Schaepdrijver, Simoens, Lauwers, & De Geest, 1989; Sugiyama, Bacon, Morrison, & Van Buskirk, 1992).
20
4.2 The retina of the rat
The retina of the rat also consists of three nuclear layers. (1) Outer nuclear layer, which contains rod and cone photoreceptors. (2) Inner nuclear layer, which contains horizontal cells, bipolar cells, and amacrine cells. (3) Ganglion cells, and two plexiform layers: outer plexiform layer and inner plexiform layer (LeVere, 1978).
Analogous to the human retina, there is a vertical and horizontal organization within these retinal layers. The vertical organization involves the photoreceptors, which synapse with bipolar cells, and in turn synapse with ganglion cells. In the rat retina, there are two types of bipolar cells: I, and II. The Type I bipolar cells synapse with rod-type receptors and the Type II bipolar cells synapse with cone-type receptors (Leure-Dupree, 1974). There are four general types of ganglion cells observed in the rat retina, within the inner nuclear layer and the ganglion cell layer.
The horizontal organization of the rat retina is at two levels and involves the horizontal cells at the outer plexiform layer and the amacrine cells at the inner plexiform layer (Leure-Dupree, 1974). The horizontal cells provide a linkage between individual receptor units and the amacrine cells provide a similar function concerning bipolar cells and ganglion cells (Leure-Dupree, 1974; LeVere, 1978).
In the rat retina, the optic disk in which the optic nerve is formed is approximately 6.5 % of the diameter of the retina, and the blood vessels radiate equally from the optic disk. A fundus image of human, rabbit, and rat is shown in the figure 6-1.
21
(A) (B) (C)
Figure 6-1: The fundus image of (A) human (the image adapted from:
https://en.wikipedia.org/wiki/Fundus (eye)), (B) rabbit (the image adapted from:
http://www.medirabbit.com/EN/Eye_diseases/Clinical/Eye_diseases.htm), and (C) rat (the image dapted from: https://www.youtube.com/watch?v=l7HB50oHebk).
22
5. Electroretinogram (ERG)
The electroretinogram (ERG) is a technique used to study the function of retinal cells in a clinic and laboratory setting. In our study, we have used ERG as a standard method to verify the activity of the retina in control retinas as well as in pharmacological injected retinas. So in this section, I will present the ERG waves and their cellular origins so that the result that will be present later become clearer.
Different types of ERGs test the function of the retina using the different stimuli such as full-field ERG, multifocal ERG or pattern ERG (Heckenlively & Arden, 2006), revealing the role of various cells and neurons in the retina.
The first published human ERG goes back to 1924 by Kahn and Löwentein, but it was not until almost a decade later that the improved techniques led to investigations about the components of the ERG by Granit (DeRouck, 2006). The synchronized activity of retinal cells, together with their structured organization creates currents large enough to be recorded from a distance at the cornea. One would expect that such currents reveal the activity of all retinal cells, but it is thought that the radial oriented cells such as photoreceptors, bipolar cells, and glial cells contribute predominantly to the ERG than the cells with a horizontal orientation such as horizontal cells and amacrine cells (Frishman, 2006).
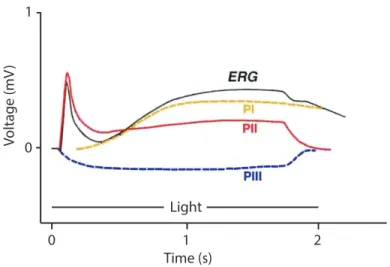
Granit explained the appearance of different components in ERG as the results of three processes (or potentials): PI, PII, and PIII named by order of disappearance under anesthesia, these waves are shown in the figure 7-1. Granit indicated that the fast developing component PIII forms the a-wave. He also reported that the PII originate in
23
the second order neurons and probably by bipolar cells (DeRouck, 2006; I. Perlman, 1995). The cellular and neuronal origins of these potentials are explained further in this chapter. 0 1 0 1 2 Time (s) Voltage (mV ) Light
Figure 7-1: The ERG of the cat in response to the flash stimulus of 2 sec, modified from (I. Perlman, 1995).
The magnitude of the electrical signals in the ERG is influenced by stimulus condition and recording condition. In this regard, the ISCEV standards are internationally used to have comparable ERG recordings (Hood et al., 2012; McCulloch et al., 2015).
To register the electrical signal of the retina three electrodes are usually used: 1) The active electrode, that makes contact with the eye, and it exists in different forms such as contact lens with an integrated silver or gold disc electrodes or the microfiber electrodes, DTLs. 2) The reference electrode and 3) The ground electrode.
Different approaches such as intraretinal depth recording, site-specific lesion, pathology or targeted mutation and pharmacological dissection have been used over the years to determine the neuronal origin and cellular mechanism generating the ERG. In recent years, as more knowledge has been obtained about the retinal neurotransmitters and
24
microcircuitry, better pharmacological agents can be used to isolate different cell types and study their specific roles using ERG components.
5.1 Origin of flash ERG components
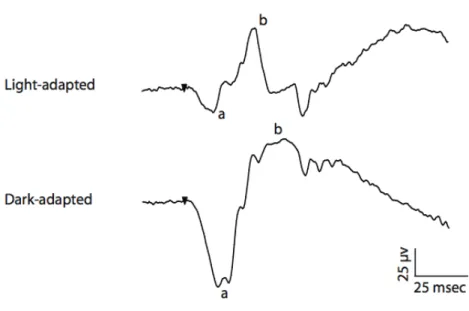
The ERG response to a flash of light includes positive and negative components originating from different stages of retinal processing. The ERG can be used to study the activity of cones and rods in different light conditions. In well-lit condition (photopic condition), to show cone dominated activities. In dark-adapted retina (in scotopic condition), to indicate rod-dominated activities. In low lighting (mesopic condition), which is a combination of photopic and scotopic condition to demonstrate the activities of a mixture of rods and cones. Figure 8-1 shows an example of the human ERG in photopic and scotopic conditions.
Figure 8-1: The human ERG recording in scotopic and photopic condition using short stimuli of 10 microseconds. The a-wave and b-wave are illustrated in each condition. In
25
photopic condition a flash of 2 db is used in the background of 30 cd/mm, and in the scotopic condition a flash of -4 db is used.
As it is shown in figure 8-1, the components of the photopic ERG are named as a- wave, b-wave. In the presence of longer stimuli another wave also appears, the d-wave (Sieving, 2006).
The a-wave is the leading part of the Granit’s PIII. The studies using microelectrodes and also pharmacological dissection showed that the photoreceptors are at the origin of the a-waves in ERG (I. Perlman, 1995).
The b-wave is the largest component of the diffuse flash ERG, initially identified as the PII by Granit (Falk & Shiells, 2006; Frishman, 2006). Pharmacological studies showed that the b-wave is diminished by agents that interfere with the synaptic transmission from the photoreceptor to the second order neurons (Sillman, Ito, & Tomita, 1969). Also, the b-wave was observed to be intact in the ERG of patients or animal models experiencing degeneration of ganglion cells (Noell, 1954). Granit has suggested that the b-wave is caused by membrane depolarization (DeRouck, 2006) and this idea was supported by other studies (Falk & Shiells, 2006; Frishman, 2006). In the retina, the cell postsynaptic to the photoreceptors that are radially oriented and also depolarizes in the presence of a flash of light is the ON-bipolar cell. Although there is a contribution of the Müller cells in the b-wave, the pharmacological dissections by blocking ON bipolar cells indicate that the b-wave shows to a large degree the currents of the ON-bipolar cells (Knapp & Schiller, 1984; Massey et al., 1983).
The d-wave, which is observable during the long stimuli and at the time the stimulus turns OFF, reflects the transient depolarization of the hyperpolarizing cone bipolar cells
26
(the OFF-bipolar cells). The pharmacological studies that block the OFF pathway show the disappearance of the d-wave in the ERG (Hare & Ton, 2002; Horiguchi, Suzuki, Kondo, Tanikawa, & Miyake, 1998).
In the photopic ERG, there is also another component, which appears as a negative going wave after the b-wave and also after the d-wave for the long flashes, which is called, the photopic negative response (PhNR) (Frishman, 2006). The pharmacological studies that block the spiking activity of retinal ganglion cells show the disappearance of this negative wave and therefore prove that the activity of ganglion cells is at the origin of PhNR (Frishman, 2006; Hanazono, Tsunoda, Kazato, Tsubota, & Tanifuji, 2008; Hare & Ton, 2002).
27
6. Retinal imaging
Retinal imaging can provide valuable data towards understanding how the eye and the visual system function. It also plays a significant role in the diagnosis of various medical conditions. Nowadays, there are different methods of ophthalmic and retinal imaging that are routinely used in clinics or laboratories such as optical coherent tomography (OCT), fluorescein angiography using either the fundus camera or the scanning laser ophthalmoscope (SLO).
Using the optical imaging of a retinal intrinsic signal is a relatively new method, which has a significant potential as a non-invasive method for assessing retinal functions in the human and in animals for clinics as well as in laboratories. The optical imaging of intrinsic signal is developed in brain imaging, and the precise and detailed description of it is highlighted in the following section.
6.1 Retinal vasculature
We will see in the next section about the optical imaging of intrinsic signal that there is a vascular component considered as a source of the intrinsic signals. Before discussing optical imaging, some knowledge about the vasculature of the retina is required.
The retina is one of the most metabolically active tissue, consuming O2 more rapidly than any other tissues, including the brain (Ames, 1992). It can vary according to the animal model, but generally, there are two separate vascular systems that bring oxygen and essential nutrients to the retina: retinal circulation and choroidal circulation. These two
28
networks of blood vessels have distinct physical and functional characteristics (Delaey & Van De Voorde, 2000; Wangsa-Wirawan & Linsenmeier, 2003).
The retinal circulation provides the oxygen of the inner retina and the choroidal circulation to the outer retina. Retinal circulation is characterized by low blood flow and high level of oxygen extraction (the artery-vein pO2 difference is about 40%). In contrast, the choroidal circulation has very high blood flow but has a small capacity for extraction of oxygen (the artery-vein pO2 difference is about 3%) (Alm & Bill, 1973; Tornquist & Alm, 1979). The choroidal circulation is controlled primarily by a sympathetic innervation and is not autoregulated. The retinal circulation, meanwhile, has no independent innervation. Thus, the arterial tone of the retina is influenced only by local factors such as changes in perfusion pressure, pO2, pCO2 and pH (Delaey & Van De Voorde, 2000).
Another feature in the retinal circulation is the self-regulatory capacity that provides constant blood flow despite perfusion pressure changes (Dumskyj, Eriksen, Dore, & Kohner, 1996). This self-regulation is produced by metabolic mechanisms. Self-regulation can be described as the adaptation of the blood flow to the metabolic demands of the cells of the retina (Delaey & Van De Voorde, 2000; Dumskyj et al., 1996).
Studies in hypoxemia show that the retinal circulatory can increase blood flow by more than a factor of three during hypoxemia. In the outer retina, hypoxemia leads to a steep decrease in choroidal PO2. It occurs because the choroidal blood flow does not increase in hypoxemia (Wangsa-Wirawan & Linsenmeier, 2003).
29
6.2 Optical imaging of intrinsic signals
Optical imaging of an intrinsic signal is one of the newest techniques for retinal imaging as it was first used for the imaging of cortical activity. The optical imaging of intrinsic signals was first developed by Grinvald et al. for mapping the cortical activity (Grinvald, Lieke, Frostig, Gilbert, & Wiesel, 1986). This technique measures the activity of the neurons indirectly, through activity-dependent changes in the optical property of tissues. By illumination of the exposed tissue (cortex, or retina) to a monochromatic light, optical imaging of the intrinsic signal detects the changes in light reflectance from the metabolically active tissue. The light reflection changes during neuronal activation due to changes in oxygen delivery and consumption in the active tissue as well as changes in the scattering property of the tissue. Although the changes of the optical properties of the brain tissue during neuronal activation has been known for many years (Cohen, 1973), it took about a decade until these features were used for imaging brain activity (Grinvald et al., 1986). Before the advent of optical imaging, the cortical function was studied mainly with electrophysiological techniques by using single or multi-units extracellular electrodes and through 2-deoxyglucose (2-DG) labeling (Zepeda, Arias, & Sengpiel, 2004). These techniques have limitations as being invasive and limited in space. For example, in the case of inserting electrodes in electrophysiology, we are spatially limited to the zone registered by the electrodes. Another example is in the 2-DG labeling that we are confined to the time that we have the glucose molecule in the imaging area. Intrinsic imaging does not use extrinsic substances like dyes, electrodes or radioactively labeled substances, which could damage the brain. Therefore this technique of imaging can
30
repeatedly be used on the same tissue. Optical imaging of intrinsic signals offers a high spatial resolution of the functional organization at the cortical level (Frostig, Lieke, Ts'o, & Grinvald, 1990). Optical imaging by the intrinsic signal can fill the gap between the single cell electrophysiology testing and the anatomical and histological methods of imaging.
Optical imaging can be used in different ways to visualize the tissue, to detect diseases at an early stage when they are still treatable. The advantage of being non-invasive makes this kind of optical imaging easy to use with a wide variety of experimental paradigms and stimulus configurations.
6.2.1 The mechanism underneath the origin of intrinsic signals
To use optical imaging as a functional method of imaging, it is necessary to understand the mechanisms underlying the intrinsic signals and their relationship to the activation of the neurons. As mentioned earlier, the source of the intrinsic signals is composed of several activation processes correlated with the neuronal firing. These processes cause the change in optical property of the tissue, so they cause a change in light reflectance comparing to the not active state. At least three physiological parameters affect light reflection during neuronal activity: 1) Change in blood volume 2) The oximetry component (change in oxy/ deoxy-hemoglobin ratio) and 3) Light scattering (Frostig et al., 1990; Malonek et al., 1997; Malonek & Grinvald, 1996). The first two factors rely on the increase in metabolic demand of the active tissue. Modern imaging techniques have demonstrated that there is a strong coupling between neuronal activity, local metabolic activity and blood flow (Vanzetta & Grinvald, 2008). The third factor determines the
31
surface reflectance changes due to ionic and/ or water movement due to membrane conformation changes during neuronal activation (D. Ts'o et al., 2009; Zepeda et al., 2004).
6.2.2 The neurovascular coupling
To sustain neuronal function the brain has evolved neurovascular mechanisms to provide the energy needed following neuronal activation. This mechanism causes changes in blood flow and volume in the regions where the neurons are active. This relationship between vascular changes and neuronal activity is known as neurovascular coupling (Vanzetta & Grinvald, 2008).
The neuronal activity uses energy and thus causes the hydrolysis of ATP. ATP is provided by the metabolism of glucose, which requires oxygen. The first studies to understand the mechanism of neurovascular coupling considered the primary source of oxygen as the oxy-hemoglobin molecules in the blood carried by capillaries to the active tissue. Therefore, during neuronal activation, there is a high demand for oxygen. In response to that demand, there is a flux of oxygen from the capillaries to the active tissue, which causes a highly localized increase in deoxy-hemoglobin concentration very early after the neuronal activity. This local rise in deoxy-hemoglobin leads to an increase in local blood flow and volume to bring more oxygen to the tissue, which is depleted from oxy-hemoglobin. This increase in oxyhemoglobin is usually less co-localized with the area of initial oxygen consumption (Vanzetta & Grinvald, 2008; Zepeda et al., 2004). Besides the classical hypothesis that suggests a close relationship between neuronal activity and local hemodynamic responses (Vanzetta & Grinvald, 2008; Zepeda et al.,
32
2004), more recent studies suggest that the origin of the changes in blood flow and hemodynamic is not, at least initially, only dependent on local metabolic need due to neuronal activity (Hillman, 2014). This new hypothesis suggests that the neurovascular coupling is not just a supply to the demand during neuronal metabolism (Lindauer et al., 2010). A supporting statement for this theory is that the changes of blood flow generate excess in local oxygen, which is much more than the demand; therefore it suggests an indirect relationship between oxygen supply and demand. The other supporting statement is the time delay of the increased blood flow peak (about 3-5 seconds after stimulus onset) compared to neuronal activity. This time delay also confirms that the neurons do not rely on functional hyperemia for their initial needs in oxygen and glucose (Lindauer et al., 2010).
6.2.3 The sources of intrinsic signal
One of the sources of the intrinsic signal as mentioned earlier is the oximetry component (change in oxy/ deoxyhemoglobin ratio). Light absorption and reflection are different in oxygenated and deoxygenated hemoglobin. So the change of the oxygen level in hemoglobin during neuronal activity can be monitored considering this characteristic. In the figure 9-1, the optical absorption of hemoglobin is shown.
33
Figure 9-1: the optical absorption spectra of oxyhemoglobin in blue and
deoxyhemoglobin in red. The figure adapted from: http://omlc.org/spectra/hemoglobin/.
As it is shown in figure 9-1, the absorption spectrum of hemoglobin has useful characteristics for functional imaging. There is a difference in absorption of light between oxygenated hemoglobin and deoxygenated hemoglobin in near-infrared wavelengths (between 600 nm and 800 nm). In this range of the spectrum, the deoxy-hemoglobin absorbs more and reflects less of the incident light. On the contrary, the oxy-hemoglobin absorbs less light. So this range of the spectrum is used for detection of oximetry change. In the green wavelength (around 570 nm), the absorption of the oxy/deoxyhemoglobin is the same (termed isosbestic wavelength) and is therefore useful for detection of blood volume change. Frostig et al. have proved the dominance of blood volume change for the signals captured in 570 nm by injecting a fluorescent dye into the bloodstream of an animal, and compared the changes in the fluorescence signal excited at the hemoglobin isosbestic wavelength to the reflection signal in this wavelength range (Frostig et al.,
34
1990). Their experiment demonstrated that the blood volume changes following neuronal activation could yield a high-resolution functional map.
The light scattering component of the intrinsic signal comes from the scattering properties of the tissue. The presence of this signal following neuronal activity is due to the ion and water movement, expansion and contraction of the extracellular spaces, capillary expansion, or neurotransmitter release that together cause changes to the scattering properties of the tissue (Cohen, 1973). The light scattering signal can be obtained at any wavelength, although it is more pronounced in the near infrared range where the light penetration in the tissue is the greatest. So, for the wavelengths more than 630 nm, scattering becomes one of the significant sources of the intrinsic signal, and in the near-infrared region above 800 nm, it dominates the other sources of the intrinsic signals (Frostig et al., 1990).
6.2.4 The shape and time course of each signal
In summary, each mechanism at the origin of intrinsic signals have a distinct time course and can be isolated using an appropriate illumination wavelength. Light scattering is the first component that happens in the time since it is related to the activities associated with the changes in membrane potential (Stepnoski et al., 1991). The increase in light scattering reaches its maximum in 2-3 s of stimulus onset. The deoxy-hemoglobin component (the use of oxygen by the active tissue) is the next element, which peaks within 4-6 s after the stimulus onset. Oxyhemoglobin provided by an increase in blood volume rises even more slowly (Frostig et al., 1990; Zepeda et al., 2004).
35
Different sources of the intrinsic signal also create different shapes for the signal. At near infrared-light (600-800 nm), as explained earlier, the oxyhemoglobin is dominant, and the shape of the signal is biphasic. Following the activation, there is a decrease in reflection and an initial dip due to the high absorption of deoxyhemoglobin. It is followed by an increase in the reflection due to the increase in blood flow and a significant amount of oxygenated hemoglobin.
6.2.5 Spatial characteristic of intrinsic signals
The intrinsic signal can be used for functional mapping of the cortex using different wavelengths. Although using different wavelength for imaging gives us different spatial resolution (Frostig et al., 1990; Malonek et al., 1997). The higher spatial resolution is obtained with a wavelength of 600-630 nm, which is the first vascular response, considering the initial phase (usually the negative phase) of the intrinsic response (Malonek & Grinvald, 1996). The secondary vascular response (such as the increase in blood flow and blood volume) offers a lower spatial resolution comparing to the HbR component. Scattering reflects changes at the cell level, so it is more localized to the cell origin of the activation than the hemoglobin molecules. However, this signal has a relatively small amplitude compared to the other components of the intrinsic signals.
6.2.6 The application of optical imaging of intrinsic signals
The first application of the optical imaging of intrinsic signals was to understand the functional architecture of the visual cortex (of rat and monkey) (Frostig et al., 1990;
36
Grinvald et al., 1986; D. Y. Ts'o, Frostig, Lieke, & Grinvald, 1990). Now, this method of imaging has an important role in studying the functional activity of other areas of the brain such as the motor, somatosensory, auditory cortices and the olfactory bulb. Also, this method of imaging is used to investigate the functional cortical development under normal and pathological conditions (Grinvald, Frostig, Siegel, & Bartfeld, 1991; Martin, Martindale, Berwick, & Mayhew, 2006; Roe, 2007).
Optical imaging of intrinsic signals using infrared light is also used to study the neuronal function of the retina (Hanazono et al., 2007; J. Schallek, Li, et al., 2009; Tsunoda et al., 2009).
The optical imaging of intrinsic signals as a technique provides functional information within cortical areas and retina. The other advantages of this technology are its relatively high spatial resolution, its affordability, and its flexibility, including the ease of incorporation into a wide variety of experimental paradigms and stimulus configurations.
37
6.3 Retinal optical imaging of intrinsic signals
Several groups have studied the origins and characteristics of retinal intrinsic signals (RIS) in both in-vivo (Hanazono et al., 2008; Hanazono et al., 2007; Inomata et al., 2008; Mihashi et al., 2011; J. B. Schallek, McLellan, Viswanathan, & Ts'o, 2012; J. Schallek, Li, et al., 2009; J. Schallek & Ts'o, 2011; D. Ts'o et al., 2009; Tsunoda, Oguchi, Hanazono, & Tanifuji, 2004) and in-vitro experiments (Y. C. Li et al., 2010). Two collective conclusions can be drawn from these studies. First, there is a high spatial correspondence between the localization of intrinsic signals and stimulation loci, suggesting that they reflect the activity of retinal neurons. Second, RIS is constituted of distinct temporal components that are cell-type and topographically precise. For example in non-human primates (Tsunoda et al., 2009), RIS result from the combination of both fast and slow kinetics components. Further, the RIS time course, shape, and origin vary according to the portion of the retina that is stimulated. Studies have suggested that the photoreceptors are responsible for the fast component and that the slow component arises from the inner retina, mostly from ganglion cells (Y. C. Li et al., 2010; Tsunoda et al., 2009).
In the cat, by examining RIS in response to stimuli of different spatial frequencies, it was demonstrated that RIS reflect not only the activity of the photoreceptors but also the activity of the inner part of the retina (Hirohara et al., 2013). However, in the same animal species, Schallek et al. (J. Schallek, Kardon, et al., 2009) investigated the cellular origin of RIS through the use of pharmacological agents and, contrary to what was
38
reported in other species (Hanazono et al., 2007; Tsunoda et al., 2009; Zhang et al., 2012) they concluded that photoreceptors were the only cells responsible for RIS.
Notwithstanding the numerous studies on RIS, there is yet no consensus regarding the anatomical origins of these signals.
39
7. Aims of the study
In this study, we followed two distinct aims in retinal optical imaging of intrinsic signals: The first objective is to characterize the intrinsic optical signals in the retina of rabbit and to understand the anatomical origin of these intrinsic signals. I hypothesize that the intrinsic signals are dynamic and depend on the stimulation condition. Also, I have the hypothesis that the anatomical origin of retinal intrinsic signals is in the outer retina as Schalleck et al. found in the cat (J. Schallek, Kardon, et al., 2009). To achieve this aim, we use a retinal functional imager with illumination light in near-infrared light. The rabbit will be utilized as the animal model since it has big eyes comparable to the size of the human’s eyes, and so we can use the camera designed for human, for the rabbit’s eyes. Specific pharmacological agents will be used to block the activity of each cell type in the retina of the rabbit to reveal their contribution to the intrinsic signal and so to find out the anatomical origin of the retinal intrinsic signals in the rabbit. The complete method, as well as the results obtained, are presented in detail in the first article presented in the next chapter.
Our focus in the second part of the study is on the development of a retinal functional imager adapted for animals with small eyes; we chose rat for this objective. In this regard, we have the aim to simulate the optical pathway of the optical imager and verify different part of it. Once the proper optical elements are chosen, we have the aim to provide the selected items to build the functional imager. We have the idea that this optical imager system using near-infrared light can capture the intrinsic signals from the rat retina and so
40
can be used further for the functional studies of the rat’s retina. The details of the optical design and the results of imaging with this system are presented in the second article in chapter 3.