SEA ICE MONITORING SERVICES AT DECEPTION BAY, SALLUIT
AND KANGIQSUJUAQ
KRG - Contract #: 2330
Progress report 2018-2019
Report submitted to Kativik Regional Government Attn: Véronique Gilbert, Assistant Director
Renewable Resources, Environment, Lands and Parks Department
Kuujjuaq (Quebec) and
Raglan Mine, a Glencore Company Attn: Charles Levac, Manager Environment
Rouyn-Noranda (Quebec)
Prepared by
Yves Gauthier, Jimmy Poulin, Jasmin Gill-Fortin, Sophie-Dufour-Beauséjour and Monique Bernier
Institut national de la recherche scientifique Centre Eau Terre Environnement
490, rue de la Couronne Québec (Québec) G1K 9A9
Research Report # R1892
For more information, please contact:
Yves Gauthier (Yves.Gauthier@ete.inrs.ca) at 418‐654‐3753
TABLE OF CONTENT
1. Project background and objectives ... 7
2. Project activities and deliverables ... 8
3. Project publications... 8
4. Schedule of work ... 9
5. Summary of achievements and results ... 10
5.1. Maintenance of the instruments (cameras, sonars) until 2020 ... 10
5.2. Continuation of the field measurements ... 12
5.3. Installation of a Weather Station in Deception Bay ... 14
5.4. Data analysis ... 15
5.5. Involvement of local resources ... 23
5.6. Installation of new real-time cameras ... 23
5.7. Development of a website ... 25
5.8. Development of an information tool ... 26
LIST OF FIGURES
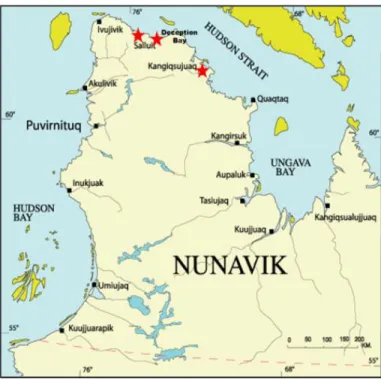
Figure 1: Location of the study area. ... 7
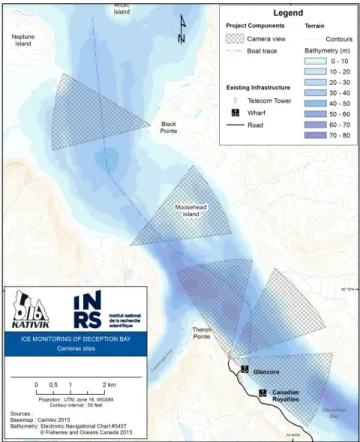
Figure 2: Location of cameras (with field of view as of September 2019) ... 10
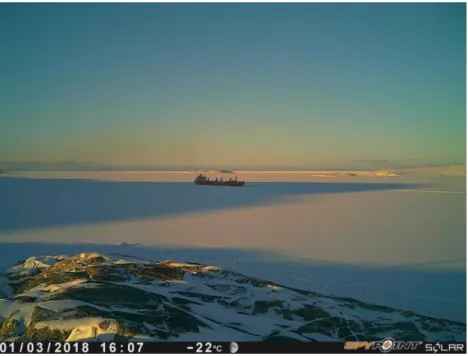
Figure 3: A photo from the site facing Moosehead Island ... 11
Figure 4: Location of SWIP and IPS deployments ... 11
Figure 5: Ice drilling in Kangiqsujuaq ... 12
Figure 6: Location of the 2019 snow and ice thicknesses measurements in Deception Bay ... 13
Figure 7: Location of the 2019 snow and ice thicknesses measurements in Kangiqsujuaq ... 13
Figure 8 : Weather station installed in Deception Bay (Bombardier beach) ... 14
Figure 9: Freeze-up sequence in Deception Bay in 2017 ... 16
Figure 10: Breakup sequence in Deception Bay in 2018 ... 17
Figure 11 : Freeze-up sequence in Deception Bay in 2018 ... 18
Figure 12: Breakup sequence in Deception Bay in 2019 ... 19
Figure 13: Year to year variation of the ice cycle ... 20
Figure 14: Year to year variation of the snow/ice thickness in late April/early May ... 22
Figure 15: Relationship between the freeze-up date and the ice thickness measured in April/May ... 22
Figure 16: Deployment of real-time cameras for trail monitoring ... 24
Figure 17 : CAIMAN Portal – Cameras near Deception Bay ... 25 Figure 18 : View from the Deception real-time camera on September 7, 2019, with corresponding weather
LIST OF TABLES
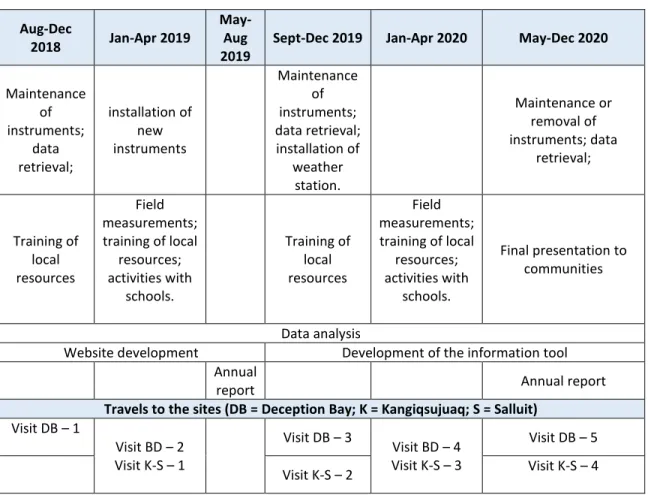
Table 1 : Planned schedule of work ... 9
Table 2 : List of the weather station components ... 14
Table 3: Summary of the 2017-2018 ice cover season in Deception Bay ... 15
Table 4: Summary of the 2018-2019 ice cover season in Deception Bay ... 18
Table 5 : List of local collaborators ... 23
1.
Project background and objectives
The project “ICE MONITORING IN DECEPTION BAY” was initiated in 2015 through a technical and administrative agreement between the Kativik Regional Government (KRG) and Raglan Mine, a Glencore company. INRS (under the leadership of Professor Monique Bernier) acted as a consultant to KRG and as a partner to the project. The work was also funded over 2015-2018 by Polar Knowledge Canada (Safe Passage Project). “SEA ICE MONITORING SERVICES AT DECEPTION BAY, SALLUIT AND KANGIQSUJUAQ” is a two year extension of the project under a technical and administrative agreement between the Kativik Regional Government (KRG) and Raglan Mine, with INRS being contracted as a consultant by KRG.
The general objectives are:
To improve our understanding of the diverse conditions of coastal ice with direct observations of snow, ice, oceanographic and meteorological parameters in real time, and indirect observations (satellite images, photographs, and traditional knowledge).
To better understand the impact of icebreakers on the local ecosystem and the activities of northern communities by comparing ice formation and its structural features in Deception Bay with ice conditions in two other fjords without winter navigation (Figure 1).
To maximize the impact of research for communities.
2.
Project activities and deliverables
The planned activities are: Maintenance of the instruments (cameras, sonars) until 2020
Continuation of the field measurements
Installation of a Weather Station in Deception Bay
Data analysis
Involvement of local resources
Installation of new real-time cameras
Development of a website
Development of an information tool The expected deliverables are:
1. Real-time weather station in Deception Bay; 2. Real-time cameras in Salluit and Kangiqsujuaq;
3. Operational sonars and cameras in Deception Bay until the summer of 2020;
4. Deception Bay sonars and autonomous cameras removed in the summer of 2020 (if the project ends);
5. Freezing and melting dates and sequences and ice thickness measurements for the three sites up to the summer of 2020;
6. Local resources trained; 7. Operational website;
8. Information tool on ice conditions;
9. Annual report on the status of the project and the main results.
3.
Project publications
Since the beginning of the project, two main reports were produced:
Gauthier, Yves; Poulin, Jimmy; Bernier, Monique (2016). Ice monitoring of Deception Bay: Deliverable no.1 to no. 4 Rapport de recherche (R1679). INRS, Centre Eau Terre Environnement, Québec.
Gauthier,Yves; Dufour-Beauséjour,Sophie; Poulin,Jimmy; Bernier,Monique (2018). Ice
Monitoring in Deception Bay : Progress report 2016-2018 Rapport de recherche (R1792). INRS, Centre Eau Terre Environnement, Québec.
The present report is the annual report covering the activities conducted between July 2018 and
September 2019 (First year of the extension contract). The full spectrum of data and analysis is
Two papers related to the project have been submitted in 2019:
Dufour-Beauséjour, S., Wendleder, A., Gauthier, Y., Bernier, M., Poulin, J., Gilbert, V., Tuniq, J., Rouleau, A., and Roth, A.: Seasonal timeline for snow-covered sea ice processes in Nunavik's
Deception Bay from TerraSAR-X and time-lapse photography, The Cryosphere Discuss.,
https://doi.org/10.5194/tc-2019-199, in review, 2019.
Dufour-Beauséjour, S., and Plante Lévesque, V.: Our Practice of Outreach during the Ice
Monitoring Project in Nunavik: An Eary-Career Researcher Perspective, manuscript submitted
for publication, 2019.
Another paper is in preparation to compare the ice characteristics over the three bays (Deception Bay, Wakeham Bay and Salluit Fjord).
4.
Schedule of work
Table 1 : Planned schedule of work
Aug-Dec
2018 Jan-Apr 2019
May-Aug 2019
Sept-Dec 2019 Jan-Apr 2020 May-Dec 2020
Maintenance of instruments; data retrieval; installation of new instruments Maintenance of instruments; data retrieval; installation of weather station. Maintenance or removal of instruments; data retrieval; Training of local resources Field measurements; training of local resources; activities with schools. Training of local resources Field measurements; training of local resources; activities with schools. Final presentation to communities Data analysis
Website development Development of the information tool
Annual
report Annual report
Travels to the sites (DB = Deception Bay; K = Kangiqsujuaq; S = Salluit)
Visit DB – 1 Visit BD – 2 Visit K-S – 1 Visit DB – 3 Visit BD – 4 Visit K-S – 3 Visit DB – 5 Visit K-S – 2 Visit K-S – 4
5.
Summary of achievements and results
5.1. Maintenance of the instruments (cameras, sonars) until 2020
A maintenance visit was conducted by INRS, KRG and local Inuit collaborators on September 24-28, 2018.
Key points:
- At the Black-Point site (Figure 2), the Reconyx camera did not function during the 2017-2018 winter. It was restarted in May 2017-2018 and acquired photos afterward. The Harbotronic camera did not record photos from January 8 to March 26. The camera was replaced by a different model (Spypoint Solar).
- At the Moosehead Island site (Figure 2), the Reconyx camera functioned properly but the Browning model did not record any photo. The memory card was replaced and the camera started to work again. The Spypoint Solar model functioned properly since its temporary installation in January 2018 (Figure 3). This is why it was moved to Black Point in September. Between all cameras on those sites, 6667 photos were retrieved for the period between September 2017 and September 2018 and added to the CAIMAN website at www.ete.inrs.ca.
- The camera at the Glencore facility site functioned properly and transmits photos in real-time (archived automatically on the CAIMAN website).
Figure 3: A photo from the site facing Moosehead Island
- The SWIP sonar was retrieved by divers, data was downloaded and batteries were replaced. The instrument was put back on the ocean floor (Figure 4).
- The IPS sonar was retrieved by automatic release, data was downloaded and batteries were replaced. The instrument was put back under water with a new anchor and release system (Figure 4).
A second maintenance visit was conducted by INRS, KRG and local Inuit collaborators on September 17-21, 2019.
Key points:
- At the Black-Point site (Figure 2), the Reconyx camera functioned properly all year long. 5229 pictures were acquired since last download in May 2019. The SpyPoint camera didn’t worked properly. From September 2018 to May 2019, only 133 pictures have been acquired. After our maintenance done in May, no new pictures were acquired. The SpyPoint camera has been removed from the site.
- At the Moosehead Island site (Figure 2), the Reconyx camera functioned properly and 1741 pictures were acquired from May to September. At this site, the camera is set to 1 picture per hour. At Black Point, the camera is set to 3 pictures per hour (to detect movement). In May, the browning camera was removed from that site because it no longer worked.
- The camera at the Glencore facility site functioned properly and transmits photos in real-time (archived automatically on the CAIMAN website).
- The SWIP sonar was retrieved by divers, data was downloaded and batteries were replaced. The instrument was put back on the ocean floor the same day (Figure 4). - The IPS sonar was retrieved by automatic release, data was downloaded and batteries
were replaced. The instrument was put back under water with a new anchor and release system (Figure 4).
5.2. Continuation of the field measurements
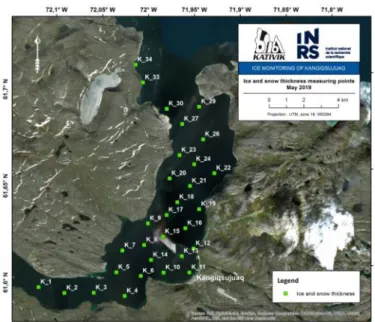
A field campaign was conducted on May 8-15, 2019 by INRS, KRG and local Inuit collaborators, in Deception Bay and Kangiqsujuaq. As planned in the contract, only ice drilling was performed (Figure 5). Ice and snow thickness measurements were done over 30 to 35 points on each bay (Figure 6; Figure 7). Measurements in Salluit were supposed to be performed by Inuit collaborators but it could not be done.
Figure 6: Location of the 2019 snow and ice thicknesses measurements in Deception Bay
Figure 7: Location of the 2019 snow and ice thicknesses measurements in Kangiqsujuaq
On Deception Bay, the mean snow thickness was 19 cm (STD 16 cm) while the mean ice thickness was 131 cm (STD 15 cm). On Wakeham Bay, the mean snow thickness was only 8 cm (STD 5 cm) while the mean ice thickness was 118 cm (STD 6 cm).
5.3. Installation of a Weather Station in Deception Bay
A weather station powered by solar energy was installed in Deception Bay on September 19-23, 2019 by INRS and KRG. It is located at KM6 on the road leaving the port installations (Figure 8). The site was selected with local Inuit collaborators.
Figure 8 : Weather station installed in Deception Bay (Bombardier beach)
Erreur ! Référence non valide pour un signet. details the components of the weather station. The
rain gauge was provided through funding from CIRNAC). The GOES antenna and data transfer is provided by the Quebec ministry of Environment. Data will be available on the CAIMAN portal.
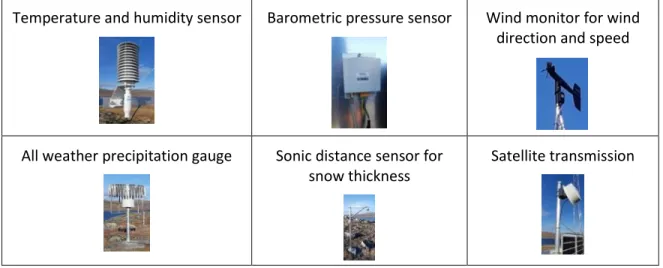
Table 2 : List of the weather station components
Temperature and humidity sensor Barometric pressure sensor Wind monitor for wind direction and speed
All weather precipitation gauge Sonic distance sensor for snow thickness
5.4. Data analysis
Analysis of time-lapse photos for freeze-up and breakup processes
The dates presented here are determined through interpretation of the photos from the Panasonic camera near the port facilities. It is not always clear when ice is moving or not and when water leads are frozen or not. Therefore, there may be some uncertainties when determining the exact freeze-up and breakup dates and interpretation may differ slightly from one interpreter to the other. It nonetheless gives a good qualitative portrait of the ice cycles in Deception Bay.
Table 3 summarizes the key moments of freeze-up and breakup for the 2017-2018 ice season in Deception Bay. The duration of the ice season was 214 days in the middle of the bay.
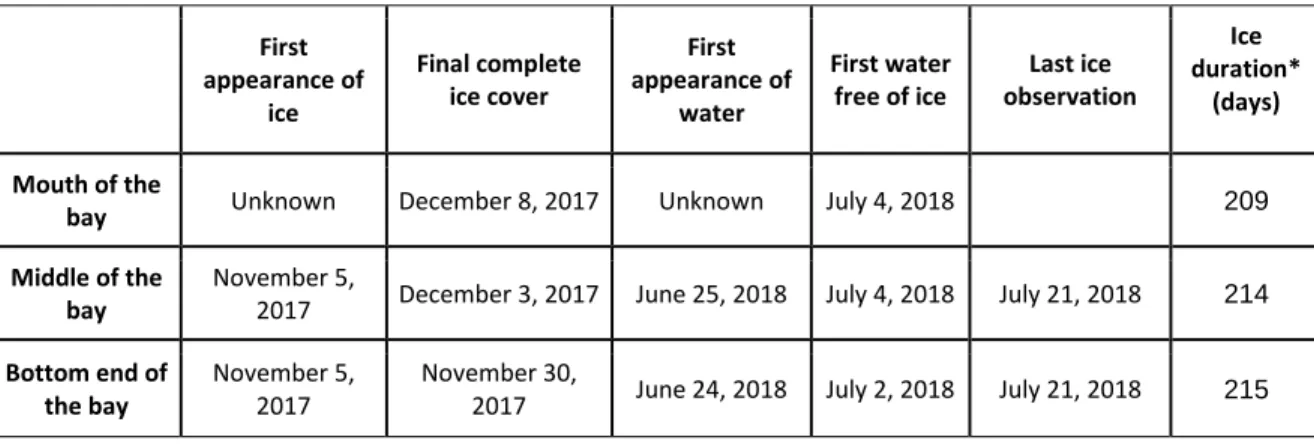
Table 3: Summary of the 2017-2018 ice cover season in Deception Bay
First appearance of ice Final complete ice cover First appearance of water First water free of ice Last ice observation Ice duration* (days) Mouth of the
bay Unknown December 8, 2017 Unknown July 4, 2018 209
Middle of the bay
November 5,
2017 December 3, 2017 June 25, 2018 July 4, 2018 July 21, 2018 214
Bottom end of the bay
November 5, 2017
November 30,
2017 June 24, 2018 July 2, 2018 July 21, 2018 215
*Ice duration is the number of days between the final complete ice cover and the first day of water free of ice.
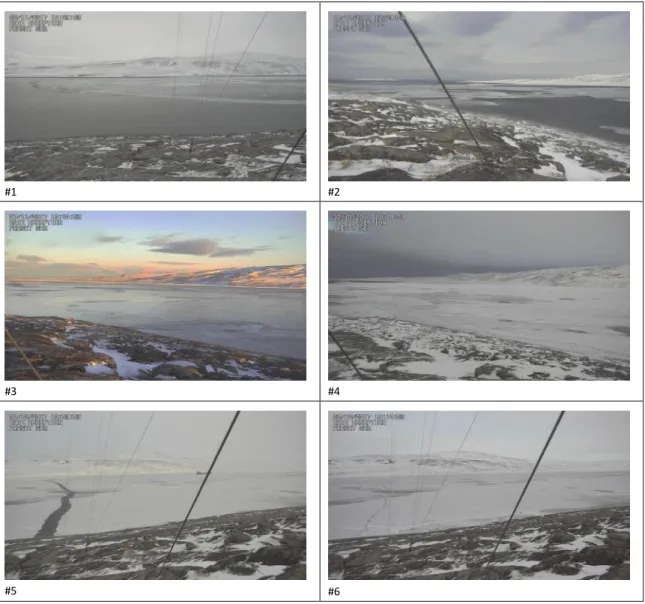
As further illustrated in Figure 9, ice was first observed in the bay on November 5 (#1). Between November 14 and 24, ice came and went away several times (#2). It reappeared on November 27, as the entire bay was covered with a thin layer of nilas in the morning (#3). For a few days it simply grew and then received some snow (#4). The passage of a ship created a crack in the fragile ice cover (#5) but it simply refroze for good on the next day (#6).
For the breakup sequence (Figure 10), snowmelt was well underway in mid-June (#1). Ships arrived on June 17 and a few days later, it became apparent that the ice cover was disintegrating around the ships’ paths (#2). The open water lead increased furthermore after the ships departure (#3). Then the ice cover started to break in several other places (#4). On June 30, the ice cover started to break free and move around in the bottom of the bay (#5). This area was clear of ice on July 2 and the rest of the bay cleared out on July 4 (#6).
#1 #2
#3 #4
#5 #6
#1 #2
#3 #4
#5 #6
Figure 10: Breakup sequence in Deception Bay in 2018
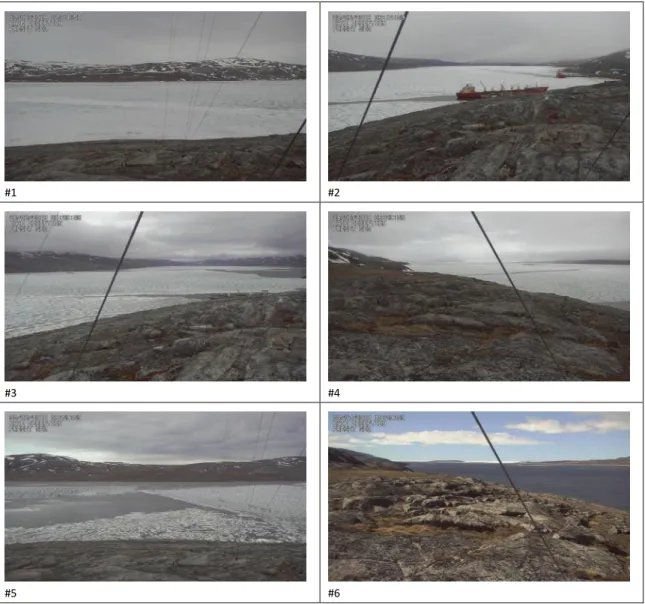
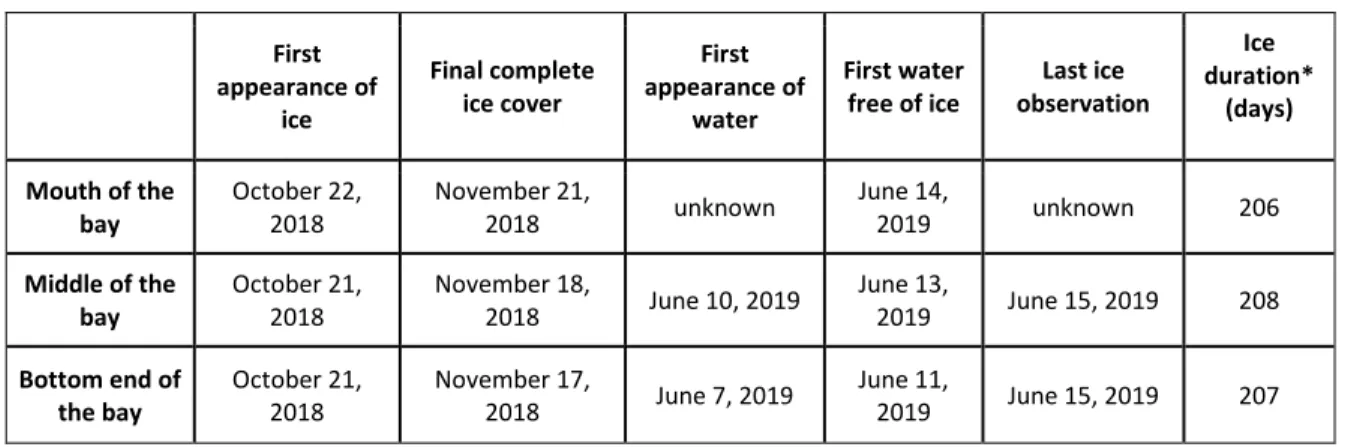
Table 4 summarizes the key moments of freeze-up and breakup for the 2018-2019 ice season in Deception Bay. The duration of the ice season was between 207 days in the middle of the bay. As further illustrated in Figure 11, the first appearance of ice in the bay came around October 21, 2019 (#1). But grease ice and nilas started to appear in the southern part of the bay only on November 11 (#2). Unstable ice patches extended to Moosehead Island on November 13 (#3) and consolidated until complete freeze-up on November 18 (#4) and towards the mouth of the bay on November 19 (#5, #6).
Table 4: Summary of the 2018-2019 ice cover season in Deception Bay First appearance of ice Final complete ice cover First appearance of water First water free of ice Last ice observation Ice duration* (days) Mouth of the bay October 22, 2018 November 21, 2018 unknown June 14, 2019 unknown 206 Middle of the bay October 21, 2018 November 18, 2018 June 10, 2019 June 13, 2019 June 15, 2019 208 Bottom end of the bay October 21, 2018 November 17, 2018 June 7, 2019 June 11, 2019 June 15, 2019 207
*Ice duration is the number of days between the final complete ice cover and the first day of water free of ice.
#1 #2
#3 #4
#5 #6
For breakup (Figure 12), snow on the ice started to melt in May and has almost disappeared at the end of the month (#1). A ship came into the bay on June 1 (#2). This didn’t seem to influence breakup as the situation was unchanged on June 6 (#3). It is only on June 7 that open water leads started to appear in the bottom end of the bay (#4). It gradually progressed toward Moosehead Island during the following days (#5). The area visible from the camera above the Raglan facilities was clear of ice on June 12-13 (#6).
#1 #2
#3 #4
#5 #6
Figure 13 shows the variation of the ice cycle in Deception Bay since 2015. The comparison is made on the observations in the middle of the bay, mainly between the port and Moosehead Island. However, the freeze-up progression can take between 1 to 3 days from the bottom end of the bay to Moosehead Island. It may take a few days more to reach Black Point, where cameras haven’t been functioning for the period of interest.
The mean duration of the ice season was 209 days. However, there is a 34 days difference between the shortest (2016-2017) and the longest (2015-2016) ice season. The mean freeze-up date (complete ice cover) is November 24 but was as early as November 12 and as late as December 4. The mean breakup date (ice free) is June 21 but was as early as June 14 and as late as July 4. No specific pattern or trend could be observed.
days for these ice features to cover the bay and to stabilize and a few days more for open leads to freeze.
Usual freeze-up sequence observed in the area between Moosehead Island and the bottom end of the bay:
- 2016, 2017, 2018: Appearance of shuga and patches of nilas followed by stabilization and complete freeze-up;
- 2015 was an exception: Landfast-ice starting along the north-eastern shore that grew thermally to cover the entire area.
Snowmelt starts in May, followed by the appearance of melt ponds, giving a patchy look to the bay. Open water appears in June and normally starts with the breakup of the Deception River, or sometimes, along the ships tracks. The process from first open water in the bay to complete breakup at Moosehead Island takes from 5 to 10 days.
Usual breakup sequence observed in the area between Moosehead Island and the bottom end of the bay:
- 2016, 2017: Snowmelt and appearance of melt ponds, open water at the outlet of Deception River progressing gradually towards Moosehead Island;
- 2018: Snowmelt and appearance of melt ponds, open water at the outlet of Deception River and along ship tracks, appearance of large cracks perpendicular to shore (not related to ship tracks), open water along east shore, breakup of the ice in large pieces;
- 2019: Snowmelt and appearance of melt ponds, open water at the outlet of Deception River and along ship tracks, open water in the southern part of the bay, progressing towards Moosehead Island.
Snow/ice thicknesss
Figure 14 compares the mean snow/ice thicknesses measured every year during the late April/early May field campaign (near maximum ice thickness). Since the 2015-2016 winter, the mean ice thickness at that time of year is 130 cm for Salluit, 129 cm for Deception Bay and 110 cm for Kangiqsujuaq. The mean snow on ice thickness is respectively 12, 15, and 19 cm. Note that Salluit could not be visited every year. Again, no trend or pattern is visible.
Figure 14: Year to year variation of the snow/ice thickness in late April/early May
In Deception Bay, we compared the ice thickness measured in April/May to the freeze-up date (Figure 15). As could be expected, there is a slight tendency for thicker ice covers when freeze-up is earlier.
Satellite images
All available free satellite images over Salluit, Deception Bay, and KAngiqsujuaq for the 2018-2019 season were obtained and added to the CAIMAN portal. Further analysis will be performed in the second year of the contract.
5.5. Involvement of local resources
Table 5 presents the Inuit collaborators involved from July 2018 to September 2019. They have been essential in the achievement of the project, for their knowledge of the land and of the land user’s needs, and for their resourcefulness.
Table 5 : List of local collaborators
September 2018 May 2019 September 2019
Pierre Lebreux Pierre Lebreux Pierre Lebreux
Juupi Tuniq Juupi Tuniq Juupi Tuniq
Davidee Mesher-Nulukie Putulik Paul Papigatuk Davidee Mesher-Nulukie
Peter Arngak Marcusie Jaaka Peter Arngak
Elijah Ningiuruvik Sandy Jaaka Peter Mitiq Kiatainaq
Naalak Misfud Joannasie Jaaka Jaimie Jaaka Pallaya Kaitaq Peter Qisiiq Sr.
Several collaborators have contributed more than one time, becoming more knowledgeable about the different systems and procedures.
5.6. Installation of new real-time cameras
Four new real-time cameras were installed in the vicinity (20-30 km) of Deception Bay and of Kangiqsujuaq in May 2019 by INRS, KRG and local Inuit collaborators. Locations for the cameras were selected by the Salluit and Kangiqsujuaq communities, to monitor problematic or critical trails on land or on ice (Figure 16). In each sector, one camera was funded by Raglan Mine while the other is funded by CIRNAC1. Photos are transmitted hourly by satellite and can be viewed
immediately on the CAIMAN website (www.caiman.ete.inrs.ca). Their purpose is to provide to the communities, real-time information on the conditions of the trails (snow or ice) for safer travel. An emergency button has been added to the system. If actioned, a picture of the person in trouble is taken and sent to the authorities in Salluit or Kangiqsujuaq. The inland sites are accessible by snowmobile only. The coastal sites are accessible by boat also. The installation is temporary (no bolting) and can be moved. Table 6 details the components of the system. A maintenance visit is planned for May 2020. The CIRNAC project also plans for small weather stations to be installed on top of the cameras and to transmit weather info with the photos.
Table 6 : List of components for the trail monitoring camera system
Camera Satellite antenna Emergency button
Warning light Batteries case
5.7. Development of a website
The purpose of the website is to make all information collected during the project, available to the local communities and to any person interested by ice and climate change in Nunavik. The cameras in Deception Bay and Kangiqsujuaq are integrated into the CAIMAN Network, which now includes 30 time-lapse or real-time cameras distributed over seven Nunavik communities and Deception Bay. The Network was gradually implemented since 2009 to support ice and climate change studies for the Quebec’s ministry of transports. The photo database is now comprised of 8 sites and more than 410 000 photos (105 000 from DB), which can be viewed through the CAIMAN Portal (www.caiman.ete.inrs.ca). This Portal is therefore the platform chosen to disseminate the Deception Bay ice monitoring information.
Presently, photos from three real-time cameras and four time-lapse cameras in Deception Bay are posted on the website (Figure 17), as well as 2 real-time cameras in Kangiqsujuaq. For each photo, past or present, weather conditions prevailing at the time of acquisition are presented (Figure 18). As soon as the data transfer from the new weather station in Deception Bay is operational, weather information for the Deception Bay cameras will come from this station.
Figure 18 : View from the Deception real-time camera on September 7, 2019, with corresponding weather data from the Salluit weather station.
The other data collected during the ice monitoring project will also be posted on the CAIMAN website, under a dedicated dashboard. This information tool is documented in the next section. It should be noted that the website has a “full site” version for fast internet access, as well as a “lite” version, to adjust to internet speed in Nunavik. This “lite” version is also designed for mobile devices.
5.8. Development of an information tool
The objective of this tool is to regroup all relevant information for real-time decision support relative to safe travel on the ice. It is primarily intended for people travelling in the area of Salluit-Deception Bay-Kangiqsujuaq. The tool, under development, is part of the CAIMAN Portal. It should integrate observations and measurements in real-time or near real-time, recent field data and historical information.
- Observations and measurements in real time
It includes photos from real-time cameras and data from weather stations, as well as most recent satellite images over the area, providing a view of the spatial distribution of snow and ice and of the actual weather conditions.
- Recent field data
It includes most recent snow/ice thickness measurements, providing some partial information on the characteristics of the ice or snow cover. It may also include comments from land users about the state of the trails.
- Historical information
It includes statistics about historical freeze-up and break-up dates and historical snow/ice thicknesses, providing temporal context.
Figure 19 shows a prototype of the dashboard. It is designed so that it can be viewed easily on mobile devices, as people travelling will potentially use their smartphone or tablet to access the site.
Figure 19 : Prototype of the Dashboard main page
The functions “Trail Conditions”, “Passage of the boat” and “Ice seasonal cycle” are not yet available and will be added in the coming months. The first will come from observations made by users of the trails, the second would rely on information provided by Fednav or Raglan Mine and the third will come from the historical analysis of the photos.
6.
Conclusion
The project is going on as planned. All new installations have been completed (Deliverable #1 and #2) and annual maintenance has been performed as scheduled (Deliverable #3). This has been made possible through an outstanding collaboration between Raglan Mine (a Glencore Company), KRG, INRS and the local collaborators from Salluit and Kangiqsujuaq (Deliverable #6). Field measurements and data analysis (Deliverable #5) will be completed during the second year of the project, with new data being acquired for a fifth winter. A strong effort will be dedicated to the processing of the complex sonar data.
The website (Deliverable #7) is operational and gives access to an impressive collection of photos and data. The information dashboard (Deliverable #8) will give an interesting added-value to the site. The prototype will be completed shortly and will be submitted to the land users so that it can