Sketch-‐Based Interfaces for Modeling and Users’ needs: redefining
connections.
Studies in Architecture and Product Design.
Elsen, C.1; Demaret, J-‐N.2; Yang, M-‐C.3; Leclercq, P.4
1BAEF Fellow (Belgium) 2F.R.S.-‐FNRS (Belgium)
1; 2&4LUCID-‐ULg, University of Liège (Belgium)
1&3Department of Mechanical Engineering and Engineering Systems Division,
Massachusetts Institute of Technology.
Elsen Catherine
LUCID-‐ULg, Chemin des Chevreuils 1, Bat. B52/3 4000 Liège
BELGIUM
+32.(0)4366.95.15
Short Title: “SBIM and Users’ needs: redefining connections”. Manuscript pages: 36 Tables: 2 Figures: 24
Sketch-Based Interfaces for Modeling and Users’ needs: redefining connections. Studies in Architecture and Product Design.
Abstract
The goal of this paper is to reexamine assumptions about Sketch-‐Based Interfaces for Modeling in the context of designers’ needs and practices.
Research questions examine (i) the type of sketch support and (ii) the timing of support. Both concepts try to determine when, what, why and how to augment design processes in a way that is useful to designers.
Two experiments (one in architecture and one in product design) based on ergonomics theory are conducted and intend to question some of these assumptions. The “Port Zeeland” experiment examines how twenty novices perceive and copy a blurred architectural sketch, which provides clues for a sketch interpretation system. “Tragere” experiment studies how 12 professional product designers, some of whom are “idea-‐generators” and others “idea-‐pursuers”, perceive, recognize and handle a design sketch.
The results take a designer’s point of view in assessing the timing and value of sketch assistance in product design. The quantitative data analysis provides rich clues about when, why and how product sketches should be supported. The paper explores the strategies developed by designers to perceive and recognize graphical content, and discusses the generation of 3D volumes, the univocity state between sketches and 3D models, and the treatment of features in freehand sketches.
The paper concludes with observations on the timing and value of support, as first integrated in NEMo, a tool for early stage architectural design, and then in PEPS3, an
early stage framework for product design.
Keywords
SBIM, Users’ Needs, Design Processes, Architecture, Product Design.
1. Introduction
Two practice-‐based observations traditionally structure research on early-‐stage design tools. The first is that freehand sketches remain the most natural and efficient way to launch new ideas (think of the back-‐of-‐the-‐napkin sketch), but are less and less suited for reaching time-‐to-‐market goals that increasingly drive the design and development process. The second observation is that CAD tools, as powerful as they are for the later stages of design, are still poorly adapted to preserving the ambiguity inherent in the preliminary phases of the design processes.
For the last thirty years, as summarized in section 2 of this paper, researchers in engineering and product design, computer graphics, psychology and user experience (UX) have generated in-‐depth theories, prototype tools, and methods to address these issues.
In the domain of sketching seen as design tool, a large community of researchers active in Sketch Based Interface for Modeling (SBIM), Computer Graphics and Non-‐ Photorealistic Rendering have investigated ways to overcome the limitations of CAD software as a preliminary design support tool by merging computational efficiency with freehand sketching capabilities. In doing so, tool developers have made assumptions about sketching behavior, such as the timing of strokes’ beautification, or the value of automatic generation of 3D models’ generation. These assumptions, even if they are often intuitively accurate, are not always grounded by analysis of designers’ observed processes and needs.
In contrast, communities of psychologists, ergonomists and UX theorists have proposed models, design methods and guidelines that are based on observations of the real behaviors of designers, but these have only slowly gained adoption in everyday work practice, in part because such models may sometimes be too general or too difficult to realize from the point of view of software development.
If communities of psychologists, design theorists and software engineers individually face challenges gaining adoption of their respective approaches, why not consider a strategy that integrates these multiple points of view? This paper brings together civil and architectural engineers, software engineers, mechanical engineers, and cognitive ergonomists to formulate an approach that considers:
methods and models drawn from cognitive psychology to address user needs specifically in early stage design;
computational approaches to augment early stage tools for design;
different modes of graphical Man-‐Machine Interactions as an alternative to traditional input devices;
This work addresses specific research questions (below) concerning strategies designers adopt to capture and create representations, the features that tools should include to support the interpretation of these representations, and the ways that the interpretation of a representation can be adapted to specific fields of design.
The goal is not to suggest a universal model or method that connects computer graphics, design engineering or psychology researchers. In fact, interactions between these areas are complex and context-‐driven and attempting to solve them globally would lead to an abstract and unproductive meta-‐model. Instead, the aim is to understand designers’ practices and how to better formulate SBIM tools with clear and specific recommendations for architecture and industrial design.
This paper centers around two key aspects of the use of design tools: (i) the type of computational assistance that is provided to designers as they engage in design activity, and (ii) the timing of that assistance. These notions are phrased as research questions:
-‐ Are certain “types” of interpretation better adapted to the design fields we are examining? How should interpretation be adapted to different design fields?
Sketches may be interpreted in a myriad of ways by software. Architectural design, as we will see in next section, typically uses 2D and symbolic representations, and are generally handled using a semantic approach for interpretation. Should interpretation systems consider other strategies, such as exploiting the timing of strokes (chronological approach) or the areas of sketches (zoning approach)? And are such approaches appropriate for fields such as industrial design, where less prototypes tools have been developed?
-‐ What elements of a representation should be considered effective as input data for SBIM tools for preliminary design?
Design representations can be highly ambiguous and difficult to interpret. To limit the combinatorial explosion of possible interpretations, software engineers have developed systems that quickly focus on specific types of input data, such as beautified strokes. Are the types of input data used in current systems in fact the best ones to focus on? What are some of the strategies adopted by designers during the act of perception and recognition? How can these strategies (and their linked input data) be effectively used by software engineers?
-‐ What is the appropriate timing of sketch computational assistance in design tools?
Developers make assumptions about the timing of strokes’ treatments, such as beautification, the real-‐time and automatic generation of 3D models, or about the general univocity existing between sketches and 3D models. Are these assumptions correct and do they reflect realistic designer behavior?
This paper presents two different experiments to address the research questions, one focused on architecture and the other on product design. The first experiment explores various sketching layout strategies that designers use. This involves an experiment in which 20 subjects reconstruct a 2D architectural drawing. The analysis of human perception and interpretation processes reveals clues for further computational interpretation. The results are suggestions for how a sketch interpretation system can seamlessly capture the information necessary to provide appropriate, perfectly timed assistance for preliminary architectural design.
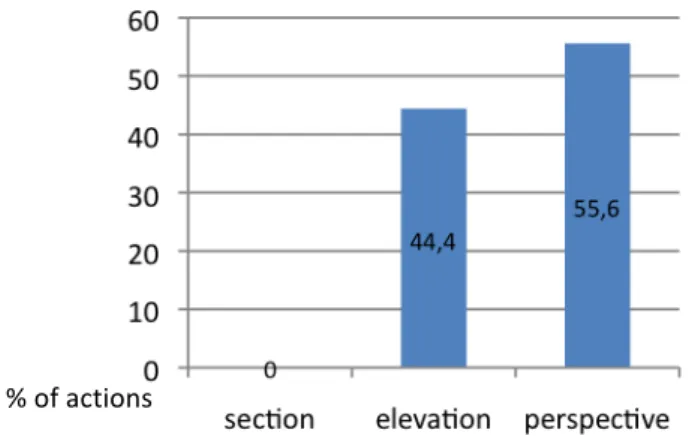
The second experiment involves observations of how professional industrial designers generate and perceive free-‐hand sketches. Results illustrate the predominance of perspectives and the importance of shifts from 2D to 3D representations. Learning about how these shifts concur to the concept’s evolution help us assess the timing and value of assistance in preliminary product design. Appropriation and perception mechanisms in between designers enable us to understand which key-‐features
constitute the graphic essence of the representation. These quantitative results provide good clues about when, why and how industrial sketches should be supported.
2. Related Work
This paper is built on two assumptions about the relationship between sketching and 3D modeling in early stage design. These have been empirically established and extensively discussed in (Elsen, Darses & Leclercq, 2010):
reduced emphasis on sketching -‐ for designers, freehand sketching remains a crucial tool for preliminary design (Basa & Senyapili, 2005; Tversky, 2002; Garner, 2000; Jonson, 2005) but the time allocated to it during the design and development cycle constantly decreases (Jonson, 2005);
increased emphasis on CAD – as designers sketch less, CAD tools are slowly relied upon to support more of preliminary design. Even if these tools are paradoxically supposed to be everything but suited to assist ideation, designers divert some of their functionalities to do so (through the use of what we called “rough 3D models”).
The recurrent dichotomies that appear in the literature between sketching and CAD (including tools, processes or other support for individual or collaborative ideation) as well as between “designers that sketch” and “designers that CAD” therefore become more and more outdated. In practice, designers exploit both tools as needed, and are less concerned with when the “right” phase in the design process to use them. The next sections will show how these dichotomies still appear in the SBIM literature, including the approaches that researchers and engineers have taken and how they impact the formulation and development of tools.
2.1 Sketching and CAD in Architecture and Product Design
Design tools can be considered on several levels of abstraction. The term “sketch” can refer to the physical tool (including its components the paper and the pen) but it can also refer to a process, an intermediary design goal (the designer ideates through the process of sketching) or to an externalized image, documenting the product evolution (the sketch understood as a drawing). Identical polysemy occurs concerning “CAD” artifacts and can be explained, according to (Darses, 2004), by the coexistence of various abstraction levels among the subject’s understanding process.
Researchers have focused on cognitive aspects of using design tools and usually contrast traditional tools (i.e. sketching, physical modeling) with new-‐generation tools (i.e. CAD tools, rapid prototyping) at the earliest, conceptual phases of the design process (Yang, 2009). Sketching is known as fast, intuitive technique to represent the opportunistic flow of ideas (Visser, 2006). Sketches reduce cognitive load and provide mnemonic help (Suwa, Purcell & Gero, 1998; Bilda & Gero, 2005); they enable an efficient and broad problem/solution exploration with minimal content (Cross, 2000; Ullman, Wood & Craig, 1989) and spur unexpected discoveries by keeping the exploration dynamic (see-‐transform-‐see process) (Schon & Wiggins, 1992). They also enable ambiguous, highly personal content (Leclercq, 2005) that impact their adaptability to serve all kinds of communicative purposes (McGown, Green & Rodgers,
1998; Détienne, Boujut & Hohmann, 2004). The contents of sketches can be implicit, have limited structure (making them difficult to interpret), their rigid and static aspects make them “old-‐fashioned” compared to more reactive representations (Leclercq, 2005).
Sketches can also be analyzed in regard to their applications or contents. Several “types” of drawings are recognized (thinking sketch (Tovey & Richards, 2004); communicative or talking sketch (Ferguson, 1992); reminder sketch (Schenk, 1991)). (Do & Gross, 1997; Lim, 2003) define various taxonomies for sketches, while (Do, 1995; Dessy, 2002) try to determine underlying principles for sketching. At a more detailed level, (McGown, Green & Rodgers, 1998; Rodgers, Green & McGown, 2000) are interested in the graphical complexity of traces.
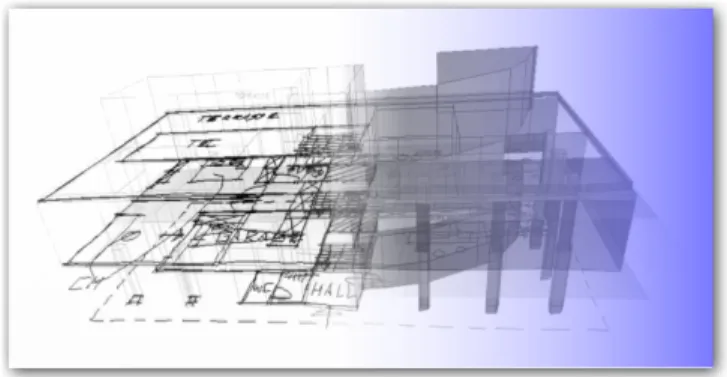
Researchers also point out the specificities of certain representations, like architectural sketches or diagrams for instance. These ones, mainly two-‐dimensional and presenting graphic symbolic content, enable a semantic computational interpretation (figure 1). Leclercq, analyzing several architectural representations in the context of their implementation, indeed proved that more than 80% of the sketches really useful for ideation are two-‐dimensional (1994). Perspectives, on the other hand, are used during later stages (once the idea has been developed), mainly for communication and negotiation purposes. In product design, on the other hand, more importance is assigned to 3D representations while too little empirical data has been gathered to evaluate the significance of symbolic codes.
Fig. 1 – Symbolic contents in architectural sketches [1] and electric diagrams [2] (Alvarado, 2004); graphical codes in diagrams [3] and in cutout scheme [4] (Davis, 2002), in regard to an axonometric
representation in product design [5].
CAD tools, on the other hand, are highly valued for their computational optimization and simulation abilities; they enable relatively quick access to 3D visualization and ease modifications through parameterization, nurturing a certain type of “heuristic fecundity” (Lebahar, 2007); they ease technical data exchange through the unification of formats and sometimes CAD modeling leads to positive premature fixation (Robertson & Radcliffe, 2009). This latter is considered a negative when a “depth” strategy of ideation contributes to the production of fewer alternatives (Ullman, Wood & Craig, 1989). From a user point of view, traditional WIMP interfaces introduce a level of cognitive overhead and can substantially divert users from their essential designing activities.
!
[1] [2]
[3] [4]
These views of the advantages and limitations of sketches and CAD tools in supporting ideation generally force a stand in favor of one or the other design tool. Previous research recommends another approach: to analyze design activity as a whole process that leverages both tools’ complementary features (Elsen, Darses & Leclercq, 2010).
2.2 Sketch Based Interfaces for Modeling
In the SBIM literature, two prominent research approaches are featured:
some SBIM prototypes explore new types of interactions for the modeling of 3D objects inside a 3D world, and thus serve designers who will make a more extensive use of these ways of expression;
on the other hand, other types of SBIM prototypes suggest new modes of freehand drawing with different levels of interactions: simple trace capture (with graphic treatments like beautification); reconstruction of geometries based on various rules or reconstruction of objects based on (sometimes semantic) interpretation of traces. These prototypes address the needs of designers who are supposed to prefer “pen and paper” style interaction.
The next two sections will examine these two approaches and will underline some of their assumptions.
2.2.1 Interactions for three dimensional modeling
Whatever the chosen input device (mouse, pen or haptic – for the latter see (Kanai, 2005)), the prototype software described here all aim to ease the creation and manipulation of 3D primitives in order to achieve more complex geometries.
Danesi et al., (1999) suggests three sub-‐classifications for SBIM prototype software:
software that employs a « WIMP » interaction (mainly menus and mouse); software that recognizes a limited range of gestures for forms selection,
generation and modification (see Sketch (Zeleznik et al, 1996); 3DSketch (Han & Medioni, 1997), or Ides (Branco et al, 1994), all referenced in (Danesi, Gardan, Martin et al. 1999))
software that exploits surfaces and deformations (like nurbs, volumes of revolution, extrusion and so on). Ides proposed several modes of interaction that can be classified here, as well as 3D Palette (Billinghurst et al, 1997), 3D Shape Deformation (Murakami et Nakajima, 1994), Virtual Clay (Kameyama, 1997) or 3-‐Draw (Sachs et al, 1991) (all referenced in (Danesi, Gardan, Martin et al. 1999)).
Interfaces for Solid Sketch and Digital sculpting can also be listed here: they usually enable users to project some virtual material perpendicularly to a reference plane, creating rough volumes that can be reshaped and modified in a second phase (for example, Z-‐brush®). We also include approaches that automatically generate complex forms (parametric, genetic or evolutionary, see (Kolarevic, 2000)), even if these rely on computational approaches rather than designer intervention during design iteration.
The DDDOOLZ sketching system (through mouse interaction in an immersive 3D environment called "virtual reality" (Achten, de Vries & Jessurun, 2000)) and Quicksketch (which cleans the 2D traces and builds mainly extruded 3D models in constant interaction with the user (Eggli, Brüderlin & Elber, 1995)) finally constitute the transition to SBIM prototypes that focus principally on the “paper and pen” metaphor. Indeed, if they operate "the line" (through mouse or pen) as input information for sequential and interactive building of the 3D models, they do not involve the use of geometric reconstruction, let alone some interpretation mechanisms presented in the next section.
2.2.2 “Paper-pen” metaphors
The development of pen-‐based interfaces has been closely linked with the development of SBIM prototypes supporting preliminary design processes through a “paper-‐pen” metaphor, starting with the seminal work of Sutherland on SketchPad (Sutherland, 1963).
In a survey paper, (Olsen, Samavati, Sousa & Jorge, 2009) compare over 150 interfaces of such type and summarize the three main steps in creating a SBIM prototype. The first and most crucial step is the generation of a digital model from sketch lines. This can be done in various ways, requiring more or less intense interaction with the user, or by performing a more or less autonomous interpretation of traces. This stage generally includes a phase of filtering the graphic information (through fitting or intentional over-‐sketching), called “beautification”. This beautification step enables the transformation of multiple, redundant, multi-‐traced sketch lines into a unique and accurate trace. In the wide-‐spread case of automatic fitting, this usually appears at the same time as the apparition of the trace, so that the user sees his/her strokes beautified as soon as he/she has drawn them. After beautification, reconstruction or interpretation approaches are used to generate a 3D representation of the project.
The second step consists in deforming the basic model in order to reach, in the most "faithful" possible way, the desired geometry. Once the model is generated (with parametric or meshed surfaces), the user can apply a set of operations (cut, fold, hole, freely deform, booleans operations and so on) that are relatively easily supported by the computer, the pre-‐existing 3D model anchoring the changes. Two difficulties nevertheless remain. The first is the pen. Pens are particularly well suited to the input of the trace, but are not optimal for the modification stage. It is sometimes complex to move in a 3D virtual space with a pen, and pens do not provide the control necessary to deform accurately. The second is linked to the general univocity of the meta-‐model linking the sketch and model: once the 3D model is generated, the modifications imposed on the form will not be translated any longer to the sketch. One might question if this technological break between the conceptual sketch and the editable 3D model really fits the cognitive and internal processes of the user.
The third and last step enables users to add details to the volumes, like annotations, surface features, profile features (Aoyama, Nordgren, Yamaguchi, Komatsu & Ohno, 2007).
This paper mainly concentrates on the first step, that is the creation of the 3D model based on sketch lines, and its three potential stages: (i) the capture, filtering and spatial positioning of traces; (ii) the geometric reconstruction of volumes and/or (iii) the (semantic) interpretation of sketches contents.
The capture, treatment and spatial positioning of traces are supported by
several techniques that are summed-‐up in (Juchmes, 2005). These techniques, including the data filtering and beautification, are the first and almost systematic step of any SBIM. Some software equip the user with "simple" support in the process of drawing. This can be done in various ways: by using tracing guides (that can be volumetric, see for instance SketchCad from (Kara, Shimada & Marmalefsky, 2007)), through instant corrections or automatic fitting to basic geometric primitives. A good example of such a system is "I Love Sketch" (Bae, Balakrishnan & Singh, 2008), which involves gestures recognition and drawings in a 3D dynamic world (technique also called "3D sketch "), exploiting the epipolar method when more complex curves have to be created. This epipolar method has proven to be cognitively challenging for designers. Another limitation of this prototype stands in the type of input: the 3D model is non-‐volumetric in essence (because of its wired structure) and the graphical input in a 3D world requires a high drawing and 3D visualization expertise. The volume perception, further modifications or implementations are made difficult, even sometimes impossible.
A question arises here concerning the timing of this first step of assistance: it has always been assumed that the capturing, filtering and spatial repositioning of strokes should be made immediately, in real-‐time. Could this as-‐available assistance negatively impact the overall design process? What are the real needs of professional designers, regarding this question?
The second stage, that is the geometric reconstruction of the model, goes a step further in the 3D generation by associating graphical units with some « basic » geometric and spatial information. The computer for instance can automatically extract « regions » from the drawing (closed geometrical shapes or blobs) (Saund & Moran, 1994; Saund, 2003) by using pre-‐defined rules, topological relationships or Gestalt perceptive standards in order to spatially position traces in the 3D world (Wuersch & Egenhofer, 2008). All these topological, geometrical and spatial links correspond to complex algorithms, which are summarized in (Company, Piquer & Contero, 2004). These so-‐called « constructive » methods can be semi-‐synchronous and exploit image recognition techniques (like Sketch-‐VRML (Jozen, Wang & Sasada, 1999)), or require the user to draw following the epipolar method (Karpenko, Hughes & Raskar, 2004; Tian, Masry & Lipson, 2009).
Another complementary approach is called "free-‐form". Features are here captured and recognized as closed contours and are transformed into blobs by software. The best-‐known example is Teddy (Igarashi, Matsuoka & Tanaka, 2007): for each recognized contour, this program provides a rough "2D skeleton " (a sort of neutral axis network) that becomes the structure for the revolution volume. Other prototype tools assume the same principle and add the ability to constrain the volume by hidden edges (reconstruction by T-‐junctions, PerSketch (Saund & Moran, 1994)).
Finally, another group of constructive systems exploits parallel projections or perspective rules to manage the 3D reconstruction (Lipson & Shpitalni, 1996; Huot, 2005; Lipson & Shpitalni, 2007). Relatively robust for mechanical or architectural parallelepiped objects, these systems first identify the geometric patterns (parallelism, symmetry, angles, isometrics, ...) and associate a « geometrical meaning » with the lines (a line being an edge, apparent or hidden, a contour and so on). These systems can sometimes be limiting to use: they require that designers express their ideas in a correct projection and with a point of view such that no edge is hidden by another. Their main advantage is the possibility to quickly infer a coherent 3D volume, since (Lipson & Shpitalni, 2007) work on closing "skins" over their wired structure.
Capture, recognition and reconstruction can eventually go a step further with the association of pre-‐defined meaning to specific content, named the “semantic
approach”. Dessy (2002) defines three essential key factors for such an interpretation:
an intense presence of geometric primitives, the constant repetition of these primitives’ properties and some constancy in the repetition of their relationships (juxtaposition, contact, inclusion, interpenetration, etc.). The recognition of these basic geometric forms triggers a process of identification governed by rules that guarantee the uniqueness of the symbol and ignore unnecessary forms. Once the symbol is recognized, the next step is to associate some common sense to the unit and then, if necessary, a set of properties.
Few design domains present these features and symbols in sufficient quantity to allow the development of such prototypes. Indeed, many developed tools focus on simple hand-‐drawn diagrams. Some research has been done on electrical diagrams (Gennari, Kara & Stahovich, 2004), UML diagrams (Casella et al., 2008a) and sketched user interfaces (Plimmer & Freeman, 2007). In mechanical engineering, one of the most robust system is ASSIST (Alvarado & Davis, 2001), referenced in (Davis, 2002)) that provides real time simulation of objects’ kinematics. Another prototype tool, called EsQUIsE, interprets architectural sketches in real time (Leclercq, 1994). By capturing and recognizing geometries (see figure 2), types of lines (walls or windows), universal architectural symbols and annotations, the system offers to designers not only a self-‐ generated 3D model of the building being designed (through extrusion), but also some evaluators (thermal, topological). Another example is VR Sketchpad (Do, 2001) and more recently the work of (Casella et al., 2008b) on architectural diagrams.
This semantic approach still encounters three obstacles, limiting its efficiency: first, it is still difficult to model more complex 3D shapes;
second, constraints must be applied to the input sketch in order limit the combinatorial explosion of possible interpretations. For instance, (Macé & Anquetil, 2009) force the user to finish the drawing of one symbol before drawing another one. This restricts the designer’s freedom;
third, these prototype tools can only work with target domains presenting high symbolic and semantic content.
Fig. 2 – Screenshots of EsQUIsE interpreting architectural sketches into a 3D volume.
These sections showed us how different approaches for reconstruction and interpretation can be. Each software prototype opts for a different strategy to generate the 3D model. Computational efficiency is usually the main argument for choosing one instead of the other, but we wonder if each strategy is equally respectful of designers’ needs and practices.
All of these systems assume that the 3D model is needed as soon as possible, and as automatically as possible. Again, we want to explore professional designers’ expectations considering this assumption.
2.3 Recommendations from Psychology and Design Ergonomics
In parallel, psychologists, ergonomists and UX theorists suggest models, methods and guidelines to optimize various aspects of design ideation. These suggestions can address team performance and organization, tasks management and sharing or uses of tools. Thanks to dedicated methodologies, these researchers provide in-‐depth analysis of subjects’ needs, beliefs and expectations and reveal the “silent realities” or unspoken aspects of theirs tasks (Nijs, Vermeersch, Devlieger & Heylighen, 2010).
In the domain of preliminary design, these researches cover a wide range of topics, from end-‐users’ needs and processes to analyses of designers creating an object to recommendations for software engineers who develop the design interface. Many suggestions concerning SBIM (or more widely Man-‐Machine Interactions) can be found in literature (Bastien & Scapin, 1995) and we selectively list some of the guidelines for sketching interfaces. These should:
be transparent, adaptable and intuitive (Safin, Boulanger & Leclercq, 2005); interoperable, “plastic” (Thévenin, 1999 quoted by (Demeure, 2007)) and perfectly suited to the target end-‐users (in this case, designers);
be able to support imprecise information (Darses, Détienne & Visser, 2001); allow flow between various type of representations, contents and levels of
abstraction (Darses, Détienne & Visser 2001);
provide up-‐stream feedback, error detection and evaluation;
enable (or even support) discovery, comparison of variants and re-‐ interpretation.
These specifications, drawn from in-‐depth understanding of complex mechanisms and dynamics, fill the gap between a basic description of the task and prescription (Dorst, 2008). They equip design engineering with a “bottom-‐up” approach that should nurture the design processes of new interfaces and tools supporting ideation.
There is a gap between these specifications and the prototypes that are created by SBIM software engineers. This could be linked to the very broad nature of these recommendations, while computer engineers must think about very specific questions in software development. This leads to misunderstandings and sometimes hazardous interpretations. Our hope is that psychology and UX researchers will be able to develop their recommendations into real world, usable software, perhaps through collaboration with software and SBIM researchers.
3. Methods
The previous research questions are considered through 2 different experiments: the first one examines freehand sketches in architecture, the other product design sketches. Considering both architectural and product design domains together enables us to highlight the differences between design processes and tools’ uses and more
importantly to underline how important it is to define context-‐specific recommendations for dedicated design support tools.
For both experiments, two assumptions are made (already established in architecture by (Leclercq, 1994)):
all the information needed to enable adapted assistance of sketching (adapted in content, in intent and in timing) are already present in designers sketches and work-‐practices;
analysis of human (experts or novices) perception and interpretation of blurred sketches can reveal clues for further computational interpretation.
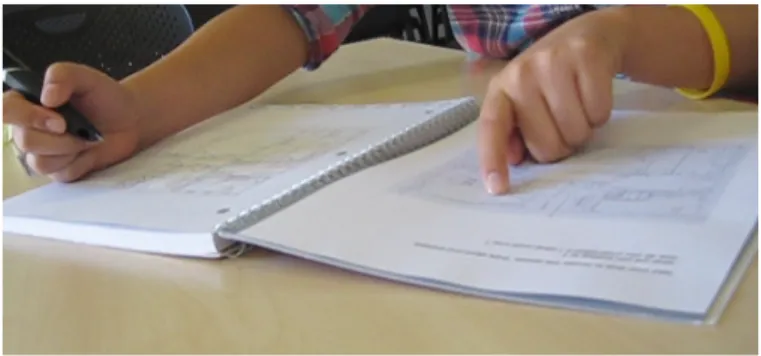
The first exploratory experiment, named the “Port Zeeland experiment”, is largely built upon this latter assumption. The goal is to observe the elements that designers focus on when formulating sketches. Twenty novices (five students in architectural design; twelve mechanical engineering students; two software engineers and one cognitive psychologist) are shown a blurred, incomplete and preliminary architectural sketch and are asked to copycat it, verbalizing their thoughts following the “think aloud” protocol (figure 3). A neutral, exterior observer restarts the think aloud process when necessary and takes active notes about how the subject reconstructs the sketch. The whole process is video recorded for further analysis.
Fig. 3 – Sketches’ perception and re-‐transcription.
Each task is completed in about 20 minutes and is followed by a short debriefing, built upon a semi-‐directive interview technique. The tapes are then iteratively and qualitatively analyzed and segmented in successive clips corresponding to distinct phases of questioning graphical units, understanding graphical units or recopying them. This segmentation is defined with the help of an expert, familiar with architectural representations and able to track shifts between units presenting different architectural, conceptual or functional meanings.
The analysis of those segments enables us to understand which clues the subjects use to capture the sketch and what kind of strategy is used to recopy it. If semantic interpretation has proved itself as an adapted strategy for highly symbolic content such as in architectural representations, we are interested complementary strategies to reduce the obstacles to computational efficiency of such an approach. By showing participants a static rough-‐sketch, we can evaluate how difficult it is for people with none (or little) architectural knowledge to capture and understand an architectural representation: are they distracted by the “off-‐line” character of the representation? Moreover, we are able to assess if architectural symbols, core to semantic interpretation systems can be that easily understood when blurred and roughly drawn.
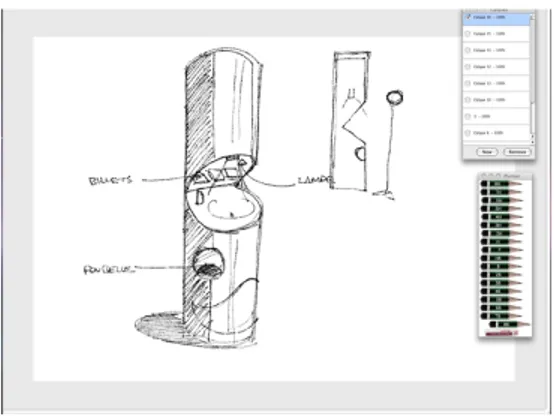
The second experiment, named “Tragere” pursues comparable goals but with a different methodology. It again explores how designs are reconstituted, but in this case examines how they can be incrementally modified, rathen than duplicated. This time, we form two groups of professional product designers, experts in consumer design, furniture design or naval design. Each designer from the first group is asked to tackle a short design problem and to sketch on a Wacom Cintiq® Graphic tablet running a dedicated sketching application (Tragere prototype, see (Jeunejean, 2004), figure 4). Each of the 12 participants is presented with one of three design prompts close to the subjects’ respective fields of expertise: one prompt relates to the design of a cafetaria tray for children, the second one to a piece of public furniture, the last to a yacht. The sketching interface enables the creation of several transparent layers which can be superimposed.
Fig. 4 – The Tragere interface and its “paper-‐pen” rendering. Here, a piece of public furniture design (designer n° 7) for a national lottery agency.
Once all “Group 1” designers have achieved their design task (in about 45 minutes each), three of the most clear and complete projects are selected to serve as the prompt for the second group of designers. We show each designer in this second group one of the three previously (anonymously) sketched projects, according to his/her respective domain of expertise (product, furniture or naval equipment, table 1). Each receives a similar design prompt to the one shown to the “Group 1” designers, except that this time designers are asked to take over the launched project (using the same tablet) as if the first colleague was suddenly no longer on the project, leaving no information other than the sketch. We also ask them to “think aloud” during their “capture-‐interpretation-‐ appropriation” process, in order to gain data about how they perceive the sketch, which key-‐features help them to understand the “Group 1” designer’s intention, and how they intend to keep the project going. Some semi-‐directive questions are asked as a debrief of the task.
Experiment
n°/Designer n° Design prompt Task
1 Tray Generator -‐ Group 1
2 Tray Generator -‐ Group 1
3 Tray Generator -‐ Group 1
4 Tray Group 2 -‐ builds on the work of Designer 3 5 Tray Group 2 -‐ builds on the work of Designer 3 6 Public Furniture Generator -‐ Group 1
7 Public Furniture Generator – Group 1
8 Public Furniture Group 2 -‐ builds on the work of Designer 6 9 Public Furniture Group 2 -‐ builds on the work of Designer 6
10 Yacht Generator -‐ Group 1
11 Yacht Generator -‐ Group 1
12 Yacht Group 2 -‐ builds on the work of Designer 10
Table 1 – Description of the experimental plan.
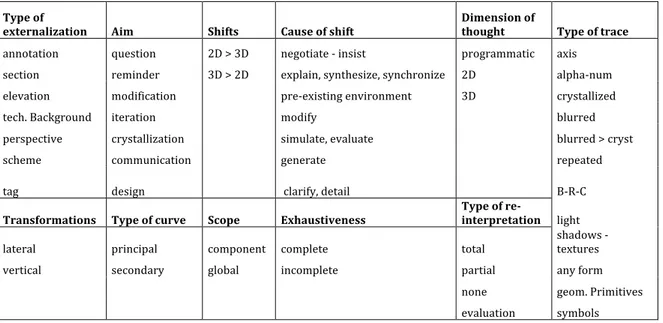
Seven designers thus assumed the role of “idea generator” and five others the role of “idea pursuer”, all twelve suggesting preliminary design solutions. Each generative task was preceded by a short exercise in order to help the designers familiarize themselves with the intuitive and easy to use Tragere® interface. Each session was video recorded, and dynamic screenshot capture enabled further trace-‐to-‐ trace qualitative analysis. The data collected is then again segmented in short clips and coded, with more detail than for the “Port-‐Zeeland” experiment (see the 12 variables and their values in table 2). Cross analysis of concurrent occurrences enables a quantitative approach of the data.
Type of
externalization Aim Shifts Cause of shift Dimension of thought Type of trace
annotation question 2D > 3D negotiate -‐ insist programmatic axis section reminder 3D > 2D explain, synthesize, synchronize 2D alpha-‐num
elevation modification pre-‐existing environment 3D crystallized
tech. Background iteration modify blurred
perspective crystallization simulate, evaluate blurred > cryst
scheme communication generate repeated
tag design clarify, detail B-‐R-‐C
Transformations Type of curve Scope Exhaustiveness Type of re-interpretation light
lateral principal component complete total shadows -‐ textures
vertical secondary global incomplete partial any form
none geom. Primitives
evaluation symbols
Table 2 – Variables and values for data coding scheme.
The type of externalization simply refers to the type of drawing produced: is it a perspective, or an elevation? Is it only annotation, perhaps added to the previous drawing? The “aim” variables are the main objectives a designer can follow during preliminary design. Defined with the help of a professional designer, the values for this variable rank from “design” to “modify” or “ask a question”. Then, we observed the various shifts occurring between 2D representations (i.e., elevations or sections) and 3D representations (i.e., perspectives) and tried to understand what caused these shifts.
After an iterative analysis of the data, we reached seven main causes for these shifts, going from “explain, synthesize or synchronize” to “introduce the pre-‐existing environment”. The dimension of the internal thoughts, revealed by visual, gestural and verbalized clues of the mental activity, is then coded.
Going deeper in the fine grained detail of the strokes’ analysis, we code the type of trace and its chronological appearance. Different levels of strokes are marked, some of them appearing in specific cycles during time. Cycles of blurred – crystallized strokes appear, and sometimes repeated strokes are added to generate what we call “B-‐R-‐C” cycles of strokes (for “blurred-‐repeated-‐crystallized”).
Goel’s lateral and vertical transformations have been coded as well, as a way to track the project’s evolution during time (Goel, 1995). Lateral transformations occur when the subject goes from one concept to a different one, whereas vertical transformations delve more deeply on the same concept.
The “type of curve” refers “principal” and “secondary” curves. Principal curves persist throughout the design process: they can still be seen in the final representation. Secondary curves, on the other hand, disappear from the drawings and don’t strategically structure them.
The “scope” and “exhaustiveness” variables examine the level of detail and the level of completeness reached by a specific drawing (global or detail? completely drawn or with zones that are unfinished?). The “type of re-‐interpretation”, eventually, considers to which extent the designers of the second group (the “idea pursuers”) capture the graphic content of the sketches they receive.
As Sketch-‐Based Interfaces for Modeling do not yet fully support the preliminary phases of product design, our hope is that this mechanism of “generating-‐capturing-‐ perceiving-‐interpreting” product design sketches will provide important clues about the type and timing of assistance needed on an every-‐day basis.
4. Results and discussion
4.1 “Port Zeeland” experiments’ results
Qualitative analysis of the videos and debriefs of the “Port Zeeland” experiments provide interesting results about sketches’ perception and key-‐features. These results can help software engineers enhancing or adapting their actual SBIM prototypes for preliminary architectural design. To begin with, we immediately observed that to manage the blurred architectural representation the subjects adopted three different strategies.
The first strategy, that we called the “structural engineer” strategy, consists in a heliocentric approach: subjects start with a global analysis of the building structure (walls, entrance) and then pursues an analysis of the architectural plan through the division of the whole space into six distinct architectural spaces, that structure the following room-‐by-‐room (or zone-‐by-‐zone) sequence. The subjects then treat each room separately and sequentially, recopying symbol after symbol -‐ the architectural function of these rooms and symbols being correctly recognized or not, which doesn’t seem to be the main concern of these subjects.
In the second strategy, named the strategy of the “visitor”, subjects also take care of the global nature of the plan first (the main four external walls), but then analyze the building and its content through a virtual walk. Subjects usually start with the main entrance, virtually walking along corridors, mentally opening doors and discovering
spaces. In front of a specific room “furnished” with various architectural symbols, subjects make deductions from their personal spatial experience to deduce its main function (“this is a bathroom, I recognize the toilet seat”, “these must be some stairs”, …) and then recopy the room and its units. This approach also derives from a zone-‐by-‐zone approach but is considered as more “egocentric”.
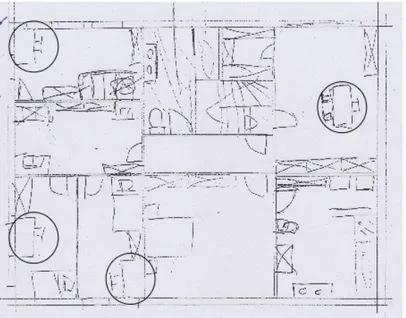
The third and last strategy, called the strategy of “the IKEA® addict”, is close to the previous one except that subjects don’t take a virtual walk into the building but rather immediately focus on equipment and furniture. They usually recopy the main four external walls as well as the six main “boxes” of the architectural plan, as a first geometric structure of the drawing, and then go from room to room, without distinct order, recopying in priority the architectural symbols they recognize (i.e., furniture or equipment). Verbatim in this case is close to “ha, this is a chair and its desk… and here is another one !” as they recognize the symbols of the chair and the desk and as they recopy them, in each spaces where they appear (figure 5).
Fig. 5 – The blurred architectural sketch to be recopied and the various chairs and desks appearing in the plan (circled).
Subjects occasionally changed from one strategy to another, mainly at the end of the process. For instance, when the “IKEA® addicts” have considered all the symbols they were able to recognize, they then generally adopt a more “structural engineer” approach to recopy the symbols that make no particular sense for them. However, overall subjects stuck to relatively constant strategy during the whole process of recopying the sketch.
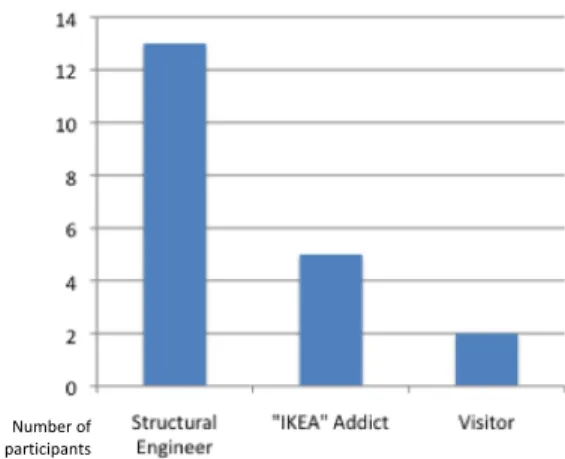
As figure 6 shows, 13 subjects out of 20 adopted a “structural engineer” strategy, five adopted an “IKEA® addict” approach while just two subjects were observed taking a “visitor” approach. There is no clear link at this point between the strategy adopted and the specific background of each subject.
![Fig. 1 – Symbolic contents in architectural sketches [1] and electric diagrams [2] (Alvarado, 2004);](https://thumb-eu.123doks.com/thumbv2/123doknet/6175417.158767/6.892.235.665.577.840/fig-symbolic-contents-architectural-sketches-electric-diagrams-alvarado.webp)