;1)//,36/
3
Université de Montréal
“Procalcitonine et Protéine C-Réactive comme
marqueurs des infections bactériennes:
une revue systématique et une méta-analyse”
par
Liliana Simon
Département de pédiatrie et médecine sociale et préventive
Faculté de Médecine
Mémoire présenté à la Faculté des études supérieures
en
vue
de l’obtention du grade de
Maître
ès Sciences (M.Sc.)
en Science Biomédicales
option Epidémiologie Clinique
des,
Juin
2003
GrdeOtr0’f3\
5 NOV
2003
© Liliana Simon, 2003
U
J5
Université
1b
de Montréal
Direction des bibliothèques
AVIS
L’auteur a autorisé l’Université de Montréal à reproduire et diffuser, en totalité ou en partie, par quelque moyen que ce soit et sur quelque support que ce soit, et exclusivement à des fins non lucratives d’enseignement et de recherche, des copies de ce mémoire ou de cette thèse.
L’auteur et les coauteurs le cas échéant conservent la propriété du droit d’auteur et des droits moraux qui protègent ce document. Ni la thèse ou le mémoire, ni des extraits substantiels de ce document, ne doivent être imprimés ou autrement reproduits sans l’autorisation de l’auteur.
Afin de se conformer à la Loi canadienne sur la protection des
renseignements personnels, quelques formulaires secondaires, coordonnées ou signatures intégrées au texte ont pu être enlevés de ce document. Bien que cela ait pu affecter la pagination, il n’y a aucun contenu manquant.
NOTICE
The author of this thesis or dissertation has granted a nonexclusive license allowing Université de Montréal to reproduce and publish the document, in part or in whole, and in any format, solely for noncommercial educational and reseatch purposes.
The author and co-authors if applicable retain copyright ownership and moral
rights in this document. Neither the whole thesis or dissertation, nor
substantial extracts from t, may be printed or otherwise reproduced without the author’s permission.
In compliance with the Canadian Privacy Act some supporting forms, contact information or signatures may have been removed from the document. While this may affect the document page count, it does not represent any loss of content from the document.
Université de Montréal
Faculté des Études Supérieures
Ce mémoire intitulé:
“Procalcitomne et Protéine C-Réactive comme
marqueurs des infections bactériennes:
Une revue systématique et une méta-analyse”
présenté par:
Liliana Simon
a été évalué
par
un
jury
composé des personnes suivantes:
Dr. François Madore
président-rapporteur
Dr. France Gauvin
directeur de recherche
Dr. Jacques Lacroix
codirecteur de recherche
Dr. Benoît Bailey
membre dujuy
lii
Sommaire
Objectifs: Une méta-analysc comparant la validité des dosages sériques de Procalcitonine (PCÏ) et de Protéine-C réactive (CRP) pour diagnostiquer une infection d’origine
bactérienne chez les patients hopitalisés.
Méthodes: Une recherche de la littérature de 1970 à 2002 permet d’identifier les articles évaluant la PCT et la CRP lors d’infections bactériennes. Les études sont revuesP trois
experts indépendants et les données sont extraites dans des tables de contingences. Les auteurs des articles sont contactés po’ir vérifier les données.
Résultats: 351 titres sont identifiés, 110 études prospectives faites chez des Patients
hospitalisés sont évaluées et 12 articles sont inclus (1497 patietits). Les données sont synthétisées en utilisant des méthodes de régressions linéaires et des courbes SROC (Summary Receiver Operating Characteristic sont générées. La valeur
Q,
qui réflète lavalidité du test (correspond au point d’intersection de la courbe SROC avec la ligne où la
sensibilité et la spécificité sont égales) est calculée. Pourdifférencier entre les infections bactériennes et les inflammations non-infectieuses, la PCT est plus sensible quela CRP
(0,8$ liC 95%0,80-0,93] versus 0,75[IC 95%0,62-0,841). La PCT est aussi plus spécifique (0,81 liC 95% 0,67-0,90] versus 0,67 IC 95%0,56-0,77]). La valeur
Q
est meilleure pour la PCT que pour la CRP (0,82 versus 0,73). Pour différencier entre les infections d’origine bactériennes et virales, la PCT est plus sensible que la CRP (0,92 IC 95% 0,86-0,95] versus (],$6 ETC 95% 0,65-0,95]). Les spécificités sont semblables (0,73lC 95% 0,42-t),91] versus 0,70 ETC 95% 0,19-t),96]). La valeur
Q
de la PCT est meilleure que pour la CRP (0,89 versus 0,83).Conclusion: La validité de la PCT est plus élevée que celle de la CRP etce test devrait être favorisé en clinique chez les patients hopitalisés.
‘1 ots—clés: méta-analysc, revue systématique, infections bactériennes, inflammation, sepsis, tests diagnostiques, otéine C-réactive, procalcitonine
Summary
Objective: Meta-analysis comparing the accuracv of serum Procalcitomn (PCT) and C reactive protein (CRP) for the diagnosis of bacterial infection in hospitalized patients. Methods: A literature search between 1970 and 2002 for identifving articles evaluating PCT and CRP for the diagnosis of bacterial infections vas performed. Each article vas independendy reviewed by three revÏewers and data extracted in 2x2 tables. Authors of articles were contacted toverify data.
Resuits: 351 tides were identifled; 110 prospective studies among hospitalized patients were evaluated and 12 articles (1497 patients) were included. Datawere summarized using linear regression methods and summary receiver operaung charactenstic curves (SROC) were generated.
Q
values, which reflect accuracy of the test and correspond to the intersection point of the SROC curve with the lime where sensidvity and specificity are equal, were calculated. PCT was more sensitive than CRP: 0.8$ [95% CI 0.80 —0.93]versus 0.75 [95% CI 0.62—0.84] to differentiate becween bacterial and non-infective
causes of inflammation. PCT was also more specific: 0.81 [95% CI 0.67 —0.90] versus
0.67 [95% CI 0.56-0.77]. The
Q
value for PCT was bigher than for CRP: 0.82 and 0.73 respectively. The sensitivity to differentiate between bacterial and viral infections xvas higher for PCT than for CPY (0.92 [95% CI 0.86—0.95] versus 0.86 [95% CI 0.65 —0.95]). Th specificities were comparable (0.73 [95% CI 0.42 —0.91] versus 0.70 [95% CI
0.19—0.96]). The
Q
value was higher for PCT: 0.89 versus 0.83.Conclusion: The overail accuracy of PCT is higher than that of CRP and should be favored for use in cinical practice in hospitalized patients.
Key words:
meta-analysis, systematic review, bacterial infections, inflammation, sepsis, diagnostic tests, C-reactive protein, procalcitoninV
Table of Contents
Tuile page
i
Identification of
the jury
il
French
Summary
iii
English
Summary
iv
Table of Contents
VList of Tables
viii
ListofFigures
ix
List of Acronyms and Abbreviations
x
Dedicadons
xiiAcknowledgements
xiiChapter I
Introduction
Deflmtions of SIRS and sepsis I
Epidemioloy of Sepsis 2
Diagnosis of Sepsis 4
Procalcitonin 5
C-Reactive Protein 9
Meta-analysis technique 12
Meta-analysis of diagnostic tests versus randomized controlled trials 13 Possible bias of meta-analysis of diagnostic tests 15
Heterogeneity of studies in a meta-analysis 1$
Moses and Shapfro methods for estimation of summary ROC curves 20 The present study
Chapter II
Article
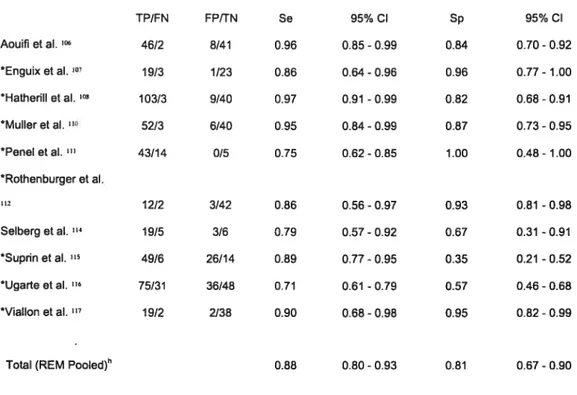
23 Abstract 25 Introduction 27 Methods 29 Resuits 32 Discussion 36 Acknowledgements 42 References 43Table 1 —Resulis derived from the 2 by 2 tables of individual studies and
sensitivity and specificity of PCT—bacterial infections vs. non-infective causes of
inflammation 59
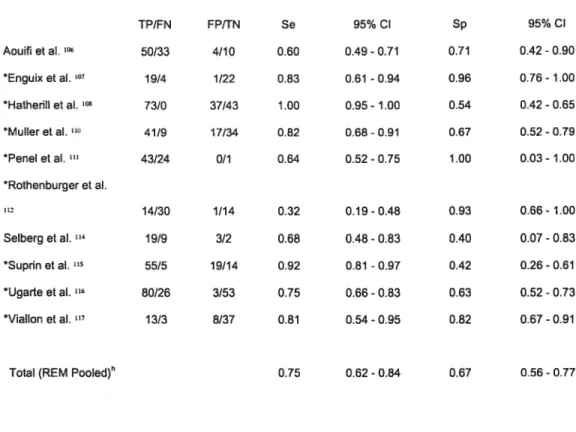
Table 2—Resuits derived from the 2 by 2 tables ofindividual studies and
sensitivity and specificity of CR2—bacterial infections vs. non-infective causes of
inflammation 60
Table 3 —Resuits derived from die 2 by 2 tables ofindividual studies and
sensitivity and specificity of PCT—bacterial infections vs. viral infections 61
Table 4— Results derived from the 2 by 2 tables ofindividual studies and Sensitivity and Specificity of CR2 —bacterial infections vs. viral infections 62
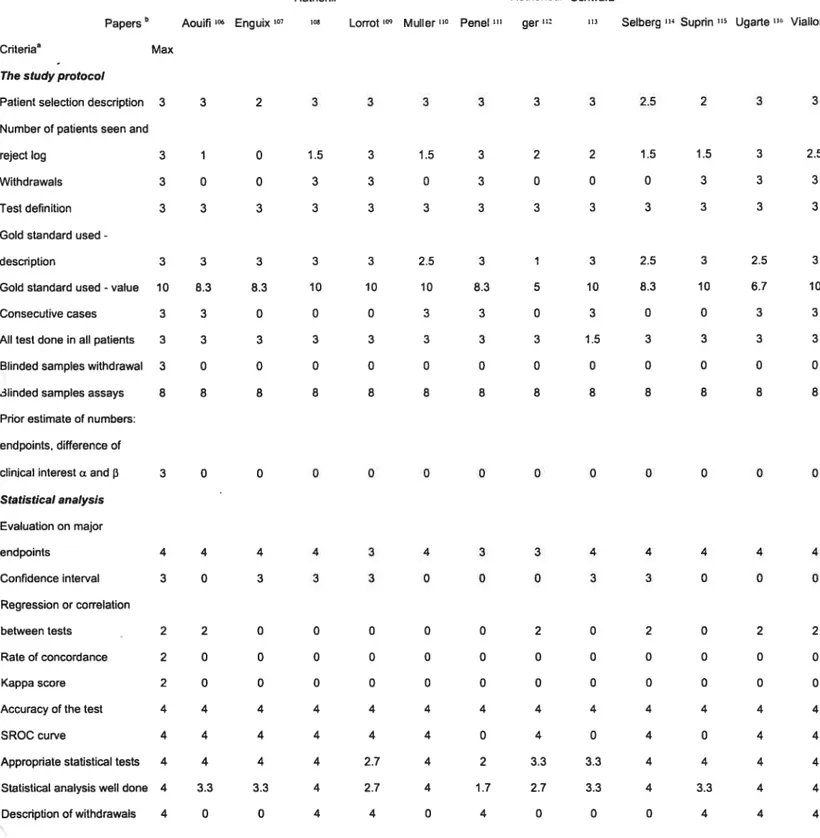
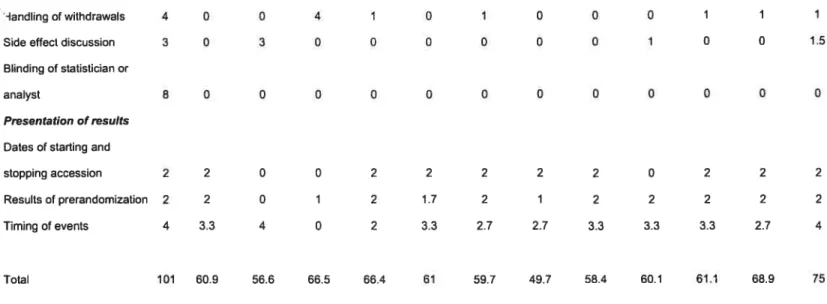
Table 5.—Quality assessment ofthe 12 included studies 63
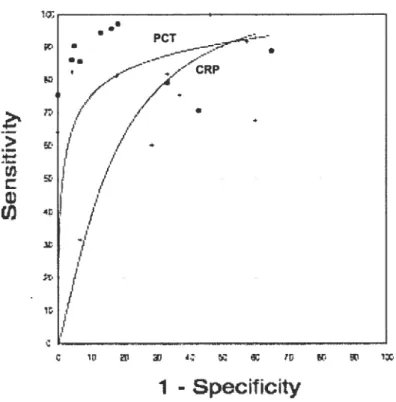
figure I —Summary receiver operating charactenstic curves comparing
serum PCT and CR2. Ten studies evaluating bacterial infections vs. non-infective causes
of inflammation. 65
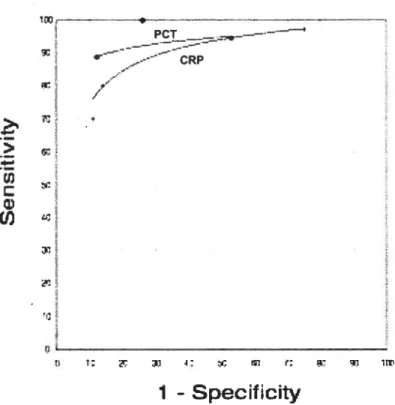
Figure 2—Summary receiver operating charactenstic curves compadng
serum PCT and CR2. Three studies evaluating bacterial infections vs. viral infections. 66 Legend tables
vii
Chapter III
Discussion and Conclusion
Study identification, selection and inclusion in this meta-analysis 69 Details on studies included in this meta-analysis 71 Details
on
studies excluded in this meta-analysis 75Evaluating quahty of the studies 77
Possible bias and validity of this meta-analysis $0
Future directions 86
Conclusions and Recommendations $8
Chapter IV
Bibliography
89Chapter V
Annexes
Annex I: abstract for presentation at the “Congrès des Résidents du Département de Pédiatrie”, November 2002, Hôpital Sainte-Justine, University of
Montreal, QC, Canada xiii
Annex II: abstract for oral presentation at the “4th World Congress on Pediatric Intensive Care”,June 8 - 12, 2002 -Boston, MA, USA xv
Annex III: Bookiet for data extraction xvi
Annex IV: Layout of die letter to die authors xxxi Annex V:JAMA Authorsbip Responsibffity, Financial Disclosure,
Ust of Tables
Table I—Resuits derived from the 2 by 2 tables ofindividual studies and
sensitivity and specificitv of PCT—bacterial infections vs. non-infective causes of
inflammation 59
Table II —Resuits derived from the 2 by 2 tables of indMdual studies and
sensitivity and specificity ofCRP—bacterial infections vs. non-infective causes of
inflammation 60
Table III —Resuits derived from the 2 by 2 tables ofindividual studies
and sensitivity and specfficity ofPCT—bacterial infections vs. viral infections 61
Table IV —Resuits derived from the 2 by 2 tables of individual studies and
Sensitivity and Specificity ofCRP —bacterial infectionsvs. viral infections 62
Table V—Quality assessment of the 12 included studies 63
ix
Ust of Figures
Chapter I
Figure I —Cartoon of the procalcitonin structure and andbody binding
6
Chapter II
Figure 1.—Summary receiver operating characteristic cunres comparing
serum PCT and CRP. Ten studies evaluating bacterial infections vs. non-infective causes
of inflammation. 65
Figure 2. —Summary receiver operating characteristic curves comparing
serum PCT and CRP. Three studies evaluating bacterial infections vs. virai infections. 66
List ofAcronyms and Abbreviations
APACHE II Acute physiology and chronic health evaluation II AminoproCT Aminoprocalcitonin
CCP Calcitonin carboxyterminal pepude
CDC Centers for Disease Control
CI Confidence Intervals
DP Dipedtidyl peptidase
CRP C-reactive protein
D Differences
DOR Summary odds ratio
ETI Endotracheal tube
FN Fais e Negative
FP False Positive
FPR False Positive Rate
ICU Intensive Care Unit
IFN-y Interferon-y
IL-113 Interleukin 113
IL-6 Interleukin 6
iNOS Nitric oxide synthase
LPS Upopolysaccharide
MEDLINE MELARS Online
MELARS Medical Literature Analysis and Retneval System
MeSH Medical subject headings
MODS Multiple Organ Dysfunction Syndrome
NK Natural killer (ceils)
NO Nitric oxide
PCT Procalcitonin
PELOD Pediatric Logisuc Organ Dysfiinction
PICU Pediatnc Intensive Care Unit
PRISM Pediatric RIsk of Mortality
xi
RCT Randomized controlled tuais
S Sum
Se Sensitivity
SIRS Systemic Inflammatory Response Syndrome SOFA Sepsis-related organ failure assessment
Sp Specificity
SROC Summary Receiver Operating Charactenstic STARD Standards for Reporting of Diagnostic Accuracy
TN True Negative
TNFcx Tumor Necrosis Factor u.
W True Positive
TPR True Positive Rate
Dedications
b
my parents Gabriella and Imre, brothers Claudio and Nataniel, and
grandparents for the support and encouragement tbroughout ail my personal
and professional life.
To my caring fiancé David, who has aiways been understanding and
compassionate.
Acknowledgements
For those whose teaching were indispensable for the progress and realization
of this project:
Dr. Jacques Lacroix
Dr. France Gauvin
Dr. Devendra Amre
For those who welcomed me at “Hôpital Sainte-Justme”:
Dr.Jean Turgeon and ail the staff in Pediatrics
Chapter I
Introduction
Dc/ùïitioizs o/SIRS u;zcÏ scbsis
In 1992, the American College of Cliest Physicians/Society of Critical Care IViedicine ACCP/SCCVD Consensus Conference arrived at die current definition of SIRS, sepsis,
severe sepsis, septic shock andmultiple organ dysfunction syndrome.’
Systemic inflammatory response syndrome (SIRS) encompasses die features of systemic
inflammation without end-organ damage, identifiable bacteremia, and the need for pharmacological support. The hallmark of SIRS is a proinftarnmatory state that is rnarked
by tachycarclia, tachypnca or hyperpnea, leukocytosis or leukopenia, pyrexia or hypothermia. The key transition from SIRS to sepsis is the presence of an identified pathogen as die cause for SIRS. Most often a bacterial infection xviii cause a systemic mflairimatory response, which can be then characterized as sepsis.
ln sepsis, most often bacterial, regulation of die eariy response to infection may be lost, and a massive cletrimental systernicreaction occurs. As result, progressive tissue damage and organ cÏysfunction may occur. Severe sepsis is the preseice of sepsis (SIRS caused by
an infection) associateci with organ dysfunction, hypoperfusion, or hypotension that usually responds to adequate fluid resuscitation. There is a subset ofpeopie withsevere
sepsis \vho develop hypotension despite adequate fluid resuscitation and require inotropic or vasopressor agents; these patients have septic shock. Multiple organ dysfunction syndrome (MODS) is defined as the presence of at least two altered organ function in a patient who is acutely iII ancl in whom homeostasis cannot be maintained without intervention.
Sepsis is a major challenge in medicine. Sepsis is extremely common, lias a veryhigh
morbidity and mortality and consumes considerable health-care resources. Around 700,000 cases of sepsis are reported annually worldwide and accounting for about $15 billion in health care costs in the U.S. alone.2 It is the second leading cause of death among patients in non-coronary intensive care units and the 10 leading cause of death overail in the United States.3 Sepsis is often lethal, killing 20 a 50% of severely affected patients.1 Bacterial infections are the major cause of sepsis
Martin et al.3 recendy reviewed the epidemiology of sepsis by assessing discharged data on approximately 750 million hospitalizations in ±e U.S. over the 22-year penod from 1979 through 2000. During this period, there were 10,319,418 reported cases of sepsis, accounting for 1.3 % of ail hospitalizadons. Even after normalizing for the population census, there was a yearly mcrease of 8.7 % in the incidence of sepsis, going from about $2.7 cases per 100,000 population to nearly 240.4 per 100,000 population. The average age of patients with sepsis increased consistendy over urne, from 57.4 years in the flrst 5-year subperiod (1979 through 1984) to 60.8 5-years in the last 5-5-year subpenod (1995 through 2000). Wbites had the lowest fates of sepsis dunng the swdy period, with both blacks and other nonwhite groups having a similarly elevated nsk as compared with whites. Black men had the highest fate of sepsis, the youngest age of onset, and the bighest mortality. When considering causative organisms, gram-negauve bacteria remain as aiways, the most important cause of sepsis. The greatest relative changes, however, were observed in die incidence of fungal infections, which increased by 2O7%. Gram-positive bacteria became the predominant pathogen after 1987; there was an average increase by 26.3% per year in the incidence of gram-positive sepsis. The total in-hospital mortality rate feil from 27.8% during the initial 5-year subpenod (1979 through 1984) to 17.9% during the last 5-year subpenod (1995 through 2000). Yet, because of the increased incidence of sepsis, the total number of deaths continues to increase. Over time, admission days significandy decreased. However, the rate of discharge of survMng
3
patients to other heath care facifities (i.e., rehabifitation centers or other long-term care facifities) almost doubled, going from 16.$% to 31.8%.
Severe sepsis is also a significant health problem in children. Watson et al.5 swdied the epidemiology of severe sepsis in children using 1995 hospital discharge and population data from seven states (24% of the United States population). They found an incidence of 0.56 cases per 1,000 population per year. The incidence was the highest in infants (5.16 per 1,000) and feil dramatically in older children (0.20 per 1,000 in 10 to 14 years old). h was 15% higher in boys than in girls (0.60 versus 0.52 per 1,000). Hospital mortallty was 10.3% (6.2 per 100,000 population). Haif of the cases had underlying disease (49.O%), and over one-flfth
(22.9%)
were low-birth-weight newborns. Respiratory infections (37%) andprimarybacteremia (25%) were die most common infections. The mean length of stay and cost were 31 days and $40,600, respectively. Esdmated annual total costs were 1.97 billion U.S. dollars nationally.Severe sepsis is especially common in the elderly and is hkely to increase substantially in the coming years as the world population ages.2 Massive resources have been invested in early diagnosis of sepsis, in developing and evaluating potential therapies, and
considerable effort has been undertaken to understand the systemic inflammation and multiple-system organ failure characteristics of severe sepsis.
Diagnosis
ofSpsis
Early specific treatrnent for sepsis is beneficial in trying to prevent the evolution to the more severe forms of the disease, such as severe sepsis, septic shock and MODS. However, treating everv SIRS with antibiotics is hazardous. It is estirnated that more than 60% of the ICU patients are treated with broad-spectrum antibiotics at an urne of their stay. Antibiotics given to a non-infected patient increases the risk of acquiring nosocomial infections caused by multiresistant organisms6’7 and cari double the risk of death.811 Avoiding the use ofunnecessary antibiotic use and opurnizing the
administration of antimicrobial agents help to irnprove patient outcome, while
minimizing resistance.12 In an European ICU, when a restrictive strategy for the use of antibiotics was adopted, a decrease of 22% in the expenses for antibioucs (saving of 14,400 Euros/year) was noted.13
Unfortunately cinical symptoms of sepsis are usually subtie ami non-specific and the problem remains the diagnosis of underlying bactenal infection. Presently, diagnosis by using bactenal culture methods remains the standard. However, there is an unavoidable delay in obtaining die resuits (usually at least 24-4$ hours). Besides, only less than one haif of the patients with signs ami symptoms of sepsis have positive resufts on blood culture.14 The demonstration of bacteria in sterile sites is not always evident. Clinically, bacterial infection cari be evidenced by finding a collection of purulent material.
Significant amount of bacteria cari also be recognized by Gram’s stain. Rapid immunological detection methods for the identification of bacterial components are available for some pathogens. Hence the identification of suitable markers for the early diagnosis of bacterial infections is paramount.
Presently two markers, procalcitonin (PCT) and C-reacuve protein (CRP), are being widely swdied to investigate their clinical utility vis-à-vis the diagnosis of bacterial infections.
5
Pro
caïttonin
Procalcitonrn was described as a precursor for calcitonin in 1975, but it was flot until 1992 that it was suggested to be an inflammatory mediator, rising in burned patients.16 A close correladon between bacterial infections and serum PCT levels was reported in 1993J7 Thereafter, several studies correlated PCT levels with bacterial infections.
Procalcitonin (PCT) is a 116 amino-acid (13 kDa) protein, derived from the
preprocalcitonin. PCT concentrations in the plasma of healthy subjects are negligible, usuafly within the picogram per miiiiliter range (10-50 pg/mL).18 PCT is the pre hormone of calcitonin and is a member of the “CAPA protein family” (c’alcitonin gene related peptide-mylin-(pro)-calcitonin-adrenomeduliin family). PCT mRNA is
synthesized by the CÀLC-I gene on chromosome 11 during normal conditions, sepsis and inflammation. In voluntary healthy subjects, PCT is produced by the C ceils of the thyroid, where it is processed into calcitonin and stored in secretory granules. Calcitonin is then released from these granules in response to hormonal or metabolic stimuli. No other genes are known to produce inflammation-induced PCT. The gene is present in various mammals and other species (e.g. salmon), but the DNA sequences and amino acids found in these animals are species-dependent. The large degree of conservation of the gene in vanous species indicates that it may have biologically important functions,18 stiil to be established.
Two types ofPCT ruRNA are synthesized witbin PCT-producing ceils, resulting in two different proteins, PCT-I and PCT-II. They are very similar in structure, differencing only at eight C-terminal amino acids.18 The type of protein synthesized or processed depends on die individual clrcumstances, the type of ceils involved, the stimulus for cellular activation, and individual suscepdbffity ofvarious ceil types to these stimuli. Variable quantities ofPCT-I and PCT-II ruRNA can be detected in different tissues. They are both detected by die commercially available assay.’8
aminoproCT
calcitonin
CCP
LUMItest
PCTFigure I —Cartoon PCT molecule and antibody site binding of the commercia.lly available
assay (LUMItest PCI)
aminoproCT, aminoprocalcitonin; CCP, calcitonin carboxyterminal pepude
The stimulus for PCT production during bacterial infection is stifi under investigation. Some flndings suggest that the release ofproximal cytokines in sepsis can initiate a greater increase in PCT. I-ligh serum PCT concentrations are measured duringseptic shock and respiratory distress, where inassive amounts of TNF are released. The injection of TNF ci. into healthyanimais is associated with an elevation of serurn PCT levels.19 The
mtravenous injection of endotoxin into healthy volunteers causes the rapid synthesis of PCT.2° Increased PCT concentrations were demonstrated after treatment with human
recombinant TNf-Πand IL-6 in cancer patients.21
The site of PCT production during severe generalized infection is stiliuncertain and controversial. Elevated serum concentrations ofPCT were found in patients with sepsis who have undergone prior total thyroidectomy;17 thus, high PCT plasma levels during systemic inflammation and sepsis are unlikely to be of thyroidal origin. Human
penpheral mononuclear ceils are another source for PCT production dunng inflammation and sepsis.n However, sigmflcant quantities ofPCT were induced dunng leukopenia in a patient on immunosuppressants for chemotherapy, while no leukocytes were detectable in visuafly and automatically analyzed blood smears.24 The liver might be a more
important source of PCT during inflammation and bacterial infection, as demonstrated by increased PCT production in liver slices after stimulation with recombinant human TNF ci. or IL-6.21
7
On the other hand, PCT mighthave an active functional protective role in patients with
sepsis. In vitro experiments showed that PCT has influence on cytokine expression. TNf-cL inductionvas significandy reduced in the presence of PCT or its C-terminal 57 amino acid fragment.25 In culwred smooth muscle ceils, low or moderatelv elevated PCT concentrations signiflcantly suppressed TNF-Πand IfN-y-stimulated production of cDNA of iNOS.26 However, in animal model of sepsis, increased mortalitv vas obsenred following intravenous PCT injections. Moreover, neutralization ofPCT with antisemm improved the survival ofanimais foflowingEscherichiacou inoculation.27
Although stili uriner investigation, it is beieved that there is protein modification of the PCT molecule, which most likely occurs by glycosylation or deamination. Two N-terminal amino acids (Ala-Pro) are removed by the enzyme dipedtidyl peptidase IV (DP IV) or CD26. The DP IV enzyme is located on renal, epithelial and endotheiai ceils, and is induced by proinflammatory mediators and endotoxin. Akhough the turnover rate of DP IV cleavage is low due to the length of the PCT molecule, a molar excess of the enzyme is prescrit in vivo,resuffing in high concentrations of tmncated PCI in the plasma of patients with severe sepsis. Furthermore, DP IV is known to modifv other proteins in which the active form is converted to an inactive form, e.g., chemokines like granulocyte chemotacuc protein-2, macrophage-derived chemokine, etc.
The exact funcuon of biologically active PCT is flot known; it is possible that it participates in amplifying die inflammatory response during infection. Recombinant procalcitonin and various synthetic proteins have been invesdgated in vitro and in experimental studies. When PCT was applied simultaneously with the inflammatory stimuliTNf-Œ/IfN-y, PCT inhibited synthesis of the inflamrnatory mediator nitric oxide (N O) in vascular smooth muscle culture.26 However, the lime course of PCT during sepsis suggests that it is not a proximal event in the inflamrriatory cascade, so that PCT is not prescrit imually with TNF-Œ and IFN-y in the early stages of inflammation. After die injection of bacterial products in vivo, it was found that PCT concentrations increased from the hour onward, reaching a plateau after 6 hours, whereas TNF-Œ peaks were detected earlier.2° Thus, it was invesugated whether PCT affects NO synthase (iNOS) by
LPS, TNf-a, and IFN-y, taking into account the typical 3-hr delay of PCT increase foflowing a bacterial challenge. A further stimulation of inducible nitricoxide synthase transcription rate vas found, suggesting that PCT acts as a modulator that augments the
inftammatoryresponse triggered by agonists like lipopolvsaccharide, tumor necrosis
factor-u, and interferon-y.28
There are some studies that show that PCT concentrations are much higher in patients with severe sepsis than in ±ose with sepsis alone.29’3u PCT may have a hazardous effect;
in vivo experiments in hamster endotoxin shock models showed that PCT administered to septic animais increased mortality and that PCT antiserum protected the animaIs from the lethal effects of sepsis.27 In the baboon sepsis model, PCT concentrations were
signiflcandy different between survivors and nonsurvivors.31 PCT concentration also seems to correlate with the severity of organ dysfunction, as deflned by different scoring systems, such as SOFA (sepsis-related organ failure assessment),32 or APACHE II (acute physiology and chromc health evaluation II) or survival3335 and poorer prognosis.36’37 Although initially high PCT concentrations do not necessarily indicate a poor prognosis, serum PCT, could potentiallv be used to monitor diseaseactlv tvinpatients with sepsis,
9
C-Reactive Protein
CRP was one of the flrst “acute phase” markers described. It vas originaily isolated in 1930 in the serum of patients with pneumonia. With its bigh afflnity for the
pneumococcal C polvsaccharide, it was later named as C-reactive protein.
CRP belongs to the pentraxin family of proteins, so called because they form a cvcic pentamer composed of five identical non-glycosylated sub-units, non-cavalent bound and organized in a very stable discoid-like structure. Another important member of this familyis the serum amyloid P component. These proteins are conserved throughout vertebrate evoludon, suggesdng that CRP has a central role in the immune response.39’4°
CRP binds to several poÏvsaccharides and peptido-polysaccharides present in bactena, fungi and parasites in the presence of calcium. These complexes activate the classical complement pathway, acting as opsonins and promoting phagocytosis. Together with complement components, CRP is the only acute phase protein directly involved in the clearance of micro-organisms. In vitro, CRP stimulates cell-mediated cytotoxicity through activation of neutrophils, promoting platelet degranulation and enhancing NK ceil activity. Under physiologic conditions, CRP binds to small nuclear nbonucleoproteins, suggesdng a direct role in the removal of necrouc
CRPis detected wi± low levels in die serum of the normal humanpopulation,with a
median of 0.8 mg/L and it is below 10 mg/L in 99% of normal samples. Levels above these values are abnormal and indicate die presence of a disease process.
As with other acute phase proteins, CRP is mainly synthesized by the liver, mainly in response to IL-6. TNF-Πand IL-1
t3
are also regulatory mediators of CR2 synthesis. During acute inflammatory or infectious states, changes in CR2 levels are determined bydie rate of synthesis and is not modified by any therapy that does not affect die evoludon of the disease 0finterventions such as renal replacement therapy.4°
Elevations in serum CRP are seen in most invasive infections, including bacterial and fungal infections, even in immunodeficient patients.4° By contrast, CRP concentrations tend to be lower in most acute viral infections.40 Nevertheless, this is not absolute and sensitivides and specfficides vary among swdies. There is limited knowledge of CRP behavior in parasitic infections, but some protozoan parasidc diseases sucli as malaria, pneumocystosis and toxoplasmosis are also able ta cause marked rises in CRP. In chromc infections, such as tuberculosis and leprosy, although abnormal, CR2 levels are usually only modestly elevated. In addition ta infection, there are several other conditions that are associated with substandal increase in CRP levels, which include trauma,surgery, burns, tissue necrosis,immunologically mediatedinflammatorydiseases, crystal-induced
inflammatorydiseases and advanced cancer. However, some inftammatory disease, such as systemic lupus erythematosus, systemic scierosis, dermatomyosids, Sjôgren’s disease, ulcerative colids, leukemia and graft-versus-host disease are associated with onlyminor
elevadons of CRP. For reasons unknown, the acute phase response mduced by these diseases is unable ta raise the CR2, due to failure of synthesis rather than increase in clearance. However, in response ta infection these patients are stiil able ta mount a major CR2 response. This property is used ta distinguisli infection from a ftare-up of the underlying disease process.4°
Besides its use in the diagnosis of sepsis, CR2 has also been associated to disease severity, with increaed levels in patients wi± septic shock compared ta patients with sepsis alone.34 h lias also been evaluated as a prognostic marker. Non-survivors had a median CR2 concentration signiflcandy bigher than sunrivors.41
Accumulating data pathologically link atherosclerosis and die inftammatory response ta vascular injury. Several prospective studies have demonstrated a direct correladon between acute myocardial infarcdon, rise in CR2, posdnfarcdon adverse events, and subsequent infarct size. Not only that, but a positive association has been found between CR2 levels and risk of developing peripheral artenal disease,38 suggesdng that CR2 would be a good marker for vascular disease in asymptomatic patients. In these situations, CR2 levels are signfficandy lower (10O dmes) than in acute inflamrnatory processes and is measured with higli-sensinve assays.42 There is no current evidence that lowering CR2
necessarily reduce cardiovascular event rates; however, many interventions known to reduce cardiovascular risk,12 including the use of anti-cholesterol drugs (stadns),43 have been linked to lower CRP levels.
Meta-anaysis technique
Interest in medical applications of meta-analysis has increased significandv in recent years, although meta-analytic procedures have been widely employed in the social sciences since the early 1970s.
The National Hbrary ofMedicine defmes meta-analysis as “a quantitative method of combining the resuits ofindependent studies (usually drawn from the published literawre) and synthesizing summaries and conclusions which may be used ta evaluate therapeutic effectiveness, plan new swdies, etc. It is often an overview of cimcal trials.” Meta-analysis is a systematic method that uses statistical analysis for extracting,
comparing, and combining resuits from independent studies ta get quantifiable outcomes. Meta-analysis should be viewed as an observational study of the evidence; the steps involved are similar ta any other research undertaking: formulation of the problem ta be addressed, collection and analysis of the data, and reporting of the results. The method consists of a thorough literature review, calculation of an effect size for each study, determination of a composite effect size from the weighted combination of individual effect sizes, and calculation of a fail-safe number (number of unpublished studies with opposing conclusions needed ta negate the published literature) ta assess the certainty of
the composite size.
Considerable amount of money is spent on chnical research. However, findings are not aiways implemented in routine clinical practice. Systematic reviews of rigorous studies provide the best evidence of the effectiveness of different strategies for promoting behavioral change.45’ Practicing evidence based medicine is one way for cinicians ta keep up to date with the exponential growth in medical literature.47
13
Meta-ana/ysis of
diagnostic
tests versus randomied controtted trials
Systematic reviews of tests are undertaken for the same reasons as systematic reviews of therapeutic interventions: to produce estimates of performance based on ail available evidence, to evaluate the quality of published swdies, and to account for variation in findings between studies. Reviews of studies of diagnostic accuracy, in common with systematic reviews of randomized controlled trials, involve key stages of question
de finition, litera ture searcbing, evaluation of studies for eigibffity and quality, data
/
/) extraction and data synthesis. However, the det1s thin some of the stages differ.48Systematic reviews of randomized controlied trials are ofren justified on the grounds that they increase statistical power: by assimiladng participants recruited to a series of trials, they increase our ability to detect small but dinicaily important differences in outcomes between treated and control groups. Statistical power is rarely discussed in studies of diagnostic accuracy as they do not compare two groups, and they do not formally test hypotheses. However, increasing sample sizes by pooling the resuits of several studies provides an opportunity to improve the precision of these estimates, and to investigate the consistency of test performance and compare resuits between studies of different designs and from different settings.48
Studies of test performance (or accuracy) compare test resuits between separate groups of patients with and without the target disease, each ofwhom undergoes the experimental test as well as a second “gold standard” reference test. The relationship between the test resuits and disease status is described using probabilistic measures, such as sensitivity and specificity. is important that the results of the reference test are very closetu the truth,
or else the performance of the experimental test will be poorly estimated. To achieve this, reference tests sometimes involve combimng several pieces of information.48
There are three major ways in wbich systematicaily reviewing studies of diagnostic accuracy differs from reviewing therapeutic interventions: the choice of search terms for
electronic literature searches, the criteria for the assessment of swdv qualiry, and the methods for the statistical combinadon of results.48
Electronic database searches for swdies of diagnostic accuracv can be more difficuit and less productive than those for randomized trials. Occasionally a simple search using just the test name wffl prove to be sensitive, but many diagnostic technologies (such as ultrasound, x ravs, and serologv tests) are used across a variety of fields in medicine, so that a mixture of appropriate and inappropriate studies wffl be retrieved, and the search will not be specific. Including terms for the disease is the searcli may help.48 Several MeSH terms have been suggested for locating studies of diagnostic accuracy.
15
Possibte bias of meta-anaysis of dïagnostit’ tests
The idealstudy sample for inclusion in a review is a consecutive (or randomly selected) series of patients recruited from a relevant cinical population. Selection bias may be introduced by selecting patients for inclusion in a non-random manner. This can present as a form of spectrum bias that arises whenever the swdy population is flotrepresentadve
of the spectrum of disease within which the test .vi11 be applied in practice.
In practice, ÏtS easier to include patients with or without the disease as separate groups,
as in a case-control study. This Can lead to bias, however, as detecuon rates vary
according to the severity of the disease, and the chances of falsely positive diagnosis wiil vary between patients according to the alternative disease that they do have. Choosing cases that have already been idendfied as having the disease will mtroduce bias into the estimates of test sensitivitv, choosing controls that are completelv healthy will introduce bias into the estimates of test specificity.48
As well as being selected in a correct manner, it is also important that the swdy samples are selected from similar healthcare settings. This is more a matter of the applicabffity of
study rather than study quality. Importantly, it is possible that the spectrum of disease and alternative diagnoses varies between different points in the health care referral process, such as primary and secondary care. As the sensitivity and specificity might not be constant across the spectrum of the disease or across the alternative conditions, the observed values of test sensitivity and specfficity in die rwo samples might differ. This variation lias nothing direcdy in do with disease prevalence within the study group: althoughitis likely that the prevalence of die disease wffl also differ between points in a referral process, the obsenred sensitivity and specificity will only change if the
proportionate mixofdie spectrum of diseased and non-diseased patients varies as well.
Variation in prevalence may be a hint of die presence of spectrum bias, but it is not its cause.48
The selecuon of a good reference standard is crucial. Tvpically the reference standard is considered a “gold standard”, and the comparison is one-sided: if there are any
disagreements between the reference standard and the experimental test it is always assumed that the experimental test is incorrect. It is important that the two tests are based on independent measurements. In some circumstances the reference diagnosis may be made on the basis of a battery of cinical tests and other available cinical
evidence. If this is the case, the batterv of resuits should flot incÏude the experimental test resuit, or else the diagnostic accuracy viil most likely be overestimated. Such an effect is knoWn as incorporation bias.48
Verification bias is a problem when the decision to undertake the reference investigation is influenced by the resuit of the experimental test or other factors wbich indicate that die disease is unlikely. There are nvo levels ofincomplete verification: partial verification where flot ail participants undergo die reference investigation, and differendal verificadon where different reference tests are used according to the results of the experimental test. Partial venfication bias usuaily leads to the numbers of true negative and false negative participants being reduced, so that sensitivity is biased upward and speciflcïty biased downwards. In contrast, differendal verificadon bias may lead to both estimates being biased upwards.48
Blinding involves each test being undertaken and interpreted without knowledge of the resuits of the other. This is especiailv important for tests that involve subjective
judgements, such as those that rely on human perceptions in interpredng images and sounds.48
Another important aspect of quality is whether both diagnostic tests were undertaken before any treatment was started. ‘Vhere this does not occur, a treatment paradox can be introduced: patients who are diagnosed with the disease at die flrst test can be treated and cured before the second test, and misclassifled as false positives or false negatives
17
Inclusion of the test resuits of ail participants in the analysis is important. Many tests report some resuits as being in agry-one, or occasionally as testfaiÏures. Although including these outcomes in an analysis is not aiways straightfonvard, ignoring them will present a test more favourably than is justified.48
Ideally, a study report should include clear descriptions of the reference and the experimental tests, with definitions of positive and negative outcomes for both, and descriptions of demographic characteristics, co-morbidities, the source and referral bistory of the patients. Lijmer et aL° provided evidence that case control study designs radier than cinical cohort overestimated diagnostic accuracy by a relative diagnostic odds ratio of 3.0 (95% CI 2.0 -4.5), being the greatest potenual source ofbias. Studies using
differential reference standards were also found to overestimate diagnostic performance compared to those using the same reference standard for both, whilst partial verification did not introduce a consistent effect. Unblinded studies were on average more likely to overestimate diagnostic accuracy. They also noted that the omission on repordng specific details of a swdy vas associated with systematic differences in results.48
The problem of publication bias are more difficuit: there are no studies in the literature which estimate rates of publication bias for diagnostic accuracy studies, and such
investigations are difficuit to undertake, as studies cannot easily be identified before they are undertaken. Also, there is no way to investigate whether or flot the studies identified are a biased sample. Some authors have suggested that publication bias may in fact be a greater problem for studies of diagnostic accuracy than for randomized controlled trials.50
I—Ieterogenei ofstudies in a mela-ana!ysis
Another important source of variation to consider in meta-analyses of diagnostic accuracy is the variation introduced by changes in diagnostic threshold. The studies included in a systematic review may have used different thresholds to define positive and negative test resuits. Some may have done this explicitly, for example byvaryingnumerical cut-points
used to classify a biochemical measurement as positive or neganve. for others there may be naturally occurring variations in diagnostic thresholds between observers or between laboratories. The choice of a threshold may also have been determined according to the prevalence of the disease—when the disease is rare, a low threshold may have been used
to avoid large numbers of false positive diagnoses being made. Unlike random variabffity and other sources of heterogeneity, varying the diagnostic threshold ber.veen studies introduces a particular pattern into the ROC plot of study resuits. If such variation is present, the points will demonstrate curvawre that parallels to the underlying ROC curve for that test. The approach to combining swdies in these situations involves denving die best-fitting ROC curve rather than summarising the resuits as a single point.48
The simplest method of combining studies of diagnostic accuracy is to compute weighted averages of die sensitivity, specificities or likelihood ratios. This method should only be applied in the absence ofvariability of the diagnostic threshold. The possibility ofa threshold effect can be investigated before this method is used, both graphically by plotting the study resuits on an ROC plot, and statistically, by undertaking tests of heterogeneity of sensitivities and specificities and investigadng whether there is a relationship between them. The homogeneity of the sensitivities and specificities from the studies can be tested using standard chi-squared tests as both measures are simple proportions. Calculation of the correlanon coefficient between sensitivities and
specificities will test whether they are related, as would be die case if there vas variation in the diagnostic threshold. If an association between die sensitivities and specificities is detected, use of weighted averages will lead to underestimation of diagnostic
performance, as the point corresponding to the average of the sensiiivities and the average of the specificities aiways fails below the ROC curve. Note that when the studies
19 in the systematic reviews have srnall sample sizes, tests for heterogeneity and correlation have low statistical powcr, and therefore a threshold related effect may exist but rernain undetectccl by the statistical tests.1
1f there is any cviclence that die diagnostic thresholdvaries between the studies, the best
summary of the rcsults of the studics xviii be an ROC curve rather than a single point. Diagnostic tests where the diagnostic odds ratio is constant regardiess of the diagnostic threshold have symmetrical ROC curves. In these situations, it is possible to use standai-ci meta-analysis rncthods for combimng odds rations to estirnate the common diagnostic odds ratio, and hence to determine the best-fitnng ROC curve. Once the surnrnary odds ratio, DOR, bas been calculateci the equation of the corresponding ROC curveis given
Aloses
ancÏ
SAt/3iro methocit/or estimation oftmmnay
ROC
ciii’vesDifference between studies
in
patient groups, test executionand study design canintroduce vanability in diagnostic odds ratios. Both methods ofpooling odds ratios can be cxtcnclccl to investigate the possible importance of these features. If it can be assumed that the summary ROC curves arc symmetrical, the impact of other factors can be investigated using standard mcthods of mcta-regression for odds ratios. Alternatively, Littcrnberg-Moses regression method can be extended by addinga covariate to the
regrfesslon ecpatlon for cach potential effect modifier. The exponential of each of these
tcrms estimates multiplicative increasesindiagnostic odds ratios for each factors.48
\Vhen die diagnostic odds ratio changes with diagnostic threshold, asymmetrical ROC curves occur. Litternberg, Moses and Shapiro proposed a method for fitting a whole
family of summaryROC curves which allow forvariation in DOR (summary odds ratio) with thrcsho1d.”2
‘flic method considers the relationship betxveen the DOR and a surnrnary measure of diagnostic threshold,givcnby thc procluct of the odds of truc positive and the odds of false positive resuits. Asa diagnostic threshold decreases, the numbers of positive
diagnosis (both correct and incorrect) increases,anddie measure of threshold increases.
‘flic diagnostic odds ratio isclcnoted by D, and die logarithm of themeasure of threshoidby S. D andS cati be caicuiated from the truc positive rate TPR and false positive rate (FPR using the folloxving ecluations:
S in
{
jTPR/(1-’J7R] x FPR/(1-FPR]} = iogit (TPR +logit (FPRD in (DOR in
{
[TPR/ (1-TPR1 x [(1-FPR/
FPRI}
in [(LR +ve)/
(LR—ve]logit (TPR) -iogit (d’PR,\vhere /ogitindicates theIo,g ofthe ocÏdç, as used in logistic
regressi on.
Littcnberg anci Moses’ method first consders a plot of the iog of the diagnostic odds
21
propose computing the best fitting straight lime through the points of the grapli. If the equation of the fttted lime is given by: D = a+ bS testing the significance of the estimate
of the siope parameter b testes whether there is significant variation in diagnostic performance with threshold. If the lime can be assumed horizontal, the diagnostic odds ratio does mot change with threshold, and the method yields symmetrical ROC curves, similar to those obtained from directly pooling odds ratios. However, if there is a significant trend in the diagnostic odds ratio with diagnostic threshold then ROC cunres are asymmetrical, the summarvROC curve being calculated as:
sensidvity = 1/[1 + (1/& x (1— specificity/specificity)1 )1]•48
Once S and D have been calculated for each study in the meta-analysis, a simple least squares regression is used to fit a straight lime to the points. The regression lime is then back-transformed into sensitiviry and specificity. À confidence interval (CI) on the
summarv ROC curve can be obtained by back-transforming the CI form the linear regression.53
Thepresent stu4y
Previous studies have suggested that both PCT and CRP could be promising diagnostic
markers for bacteriai infections.17’ 29, 30, 33, 34, 37, 38, 40, 54-134 However the accuracy of these markers lias varied across studies, especially as a resuit of limitations in sample size and differences in studv designs. In order to adequately summarize the udlity of these markers in cinical practice, we carried out a meta-analysis and svstematically reviewed studies that simultaneously invesdgated these tests as markers for bacterial infection.
Chapter II
Article
Procalcitonin and C-Reactive Protein as Markers of Bacterial
Infection: A Systematic Review and Meta-Analysis
Uliana Simon, MD; France Gauvin, MD, MS; Devendra K. Amre, MBBS, PhD; Patrick Saint-Louis, PhD; Jacques Lacroix, MD, FRCP
AuttorAffitiations: currently Department of Pediatrics, Yale Universitv School of Medicine, New Haven, Connecdcut (Dr Simon—previously Department of Pediatrics, University of
Montreal, Montreal, Quebec), Department of Pediatrics ÇDr Gauvin and Dr Lacroix) and Department of Climcal Biochemistry (Dr Saint-Louis) and the Research Center (Dr Amre), University of Montreal, Montreal, Quebec
Correspondence/repnutaddress: Liliana Simon, M.D.
Section of Critical Care and Applied Physiology Department of Pediatrics
Yale University School of Medicine 333 Cedar Street
New Haven, Connecucut 06520-8064 Phone: 203 785-4651
Fax: 203 785-5833 E-mail:
RUNNING TITLE: PCT & CRP, meta-analysis WORlD count (text only): 3746
25
AB STRACT
Context: Procalcitonin and C-reactive protein have been advocated to diagnose bacterial infection. Their accuracy remains uncertain.
Objective: Meta-analysis of published studies to compare the accuracy of procalcitonrn and C-reacdve protein as diagnostic markers of bacterial infection.
Data Sources: Studies published in MEDLINE (1970—2002) that evaluated procalcitonin
and C-reactive protein for the diagnosis of bacterial infections were identified. Cross references were reviewed.
Data Selection: 351 tides were identified; 110 prospective studies among hospitalized patients were evaluated. Articles were selected by three reviewers.
Data Extraction: Data were extracted in 2 by 2 tables. Authors of articles were contacted to verify data.
Data Synthesis: 12 articles were included (1497 patients). Data were summarized using linear regression methods and summary receiver operating characteristic curves were generated. Procalcitonin was more sensitive than C-reactive protein: 0.88 [95% CI 0.80 —
0.93] versus 0.75 [95% CI 0.62—0.84] for differentiating between bacterial and non-infective
causes of inflammation; difference 0.13 [95% CI 0.08—0.17], p < 0.05. Procalcitonin vas
also more specific: 0.81 [95% CI 0.67—0.90] versus 0.67 [95% CI 0.56 —0.77]; difference
0.14 [95% CI 0.08—0.20], p <0.05. The
Q
value for procalcitomn vas higher than for Creactive protein: 0.82 and 0.73 respectively. The sensitivity for differentiating betwecn bacterial and viral infections was higher for procalcitonin than for C-reactive protein (0.92
0.11], p < 0.05. The specificities were comparable (0.73 [95% CI 0.42—0.91] versus 0.70 /
[95% CI 0.19 — 0.96]); difference 0.03 [95% CI tLO4—0.1], p > 0.05. The
Q
value wasbiglier for procalcitonin: 0.89 versus 0.83 for C-reactive protein.
Conclusions:The diagnostic value of procalcitonin was higher than the one for C-reactive protein in hospitalized patients. Procalcitonin should be favored for use in cimcal practice.
KEY WORDS
meta-analysis, systematic review, bacterial infections, inflammation, sepsis, diagnostic tests, C-reactive protein, procalcitonin
27
INTRODUCTI ON
Bacterial infections are a major cause of hospitalization, intensive care unit admission and mortality. Bacterial infections often activate the systemic inflammatory network, causing systemicinftarnmatory response syndrome (SIRS). This acute activation as a resuit of bacterial, fungal, viral and/or parasitic infections is referred to as sepsis.1 Bacterial infections are the leading cause of systemic inflammation and sepsis.2 Because the presentations may be similar, a major challenge in cinical practice is to accurately distinguish between SIRS and sepsis. Around 700,000 cases of sepsis are reported annually worldwide and account for about US$ 15 billion in health care costs in the U.S. alone.3 Recent data from the Centers for Disease Control (CDC) indicate that the incidence of sepsis is increasing by an average of 16% a year inthe U.S.. Dunng the 20-year penod from 1979 to 1999, the incidence of sepsis increased by more than 329%. It went from 78 to 259 cases per 100,000 people. The associatedmortality rate is decreasing, though, dropping from 29%ni 1979 to l7.4% in
1999. However, because of the increased incidence of sepsis, the total number ofpeople who die from sepsis continues to increase each year.2
Recognizing sepsis and bacterial infections is important in order to initiate timely and appropnate treatment. The increase in antibiotic resistance due to inappropriate use of broad-spectrum antibiotics makes the identification of the cause increasingly cntical.
However die early diagnosis of bacterial infections is difficuit and sometimes chaflenging. It requires demonstration of bacteria in sterile sites, either by finding pus or a significant amount of bacteria by Gram’s stain or culture, or by showing the presence of bacterial
genome by PCR. Presendy, diagnosis by using bacterial culture methods is the reference standard. However, its udlityis often hampered by delays in obtaining the resuits (usually at least 24- 4$ hours). Hence the identification of suitable markers for the early diagnosis of
bacterial infections is paramount.
Two potential markers, procalcitonin (PCT) and C-reactive protein (CRP), are presendy being widely studied to investigate their accuracy vis-à-vis the diagnosis of bacterial infections. PCT is die pre-hormone of calcitonin. Under physiologic conditions, serum concentration ofPCT is negligible or undetectable.4 CRP is an acute phase reactant that tises whenever an inflammatory process is present. Previous studies have suggested that both PCT and CRP could be promising diagnostic markers for bacterial infections.
However the reported diagnostic accuracy of these markers has varied across studies. This is probably due to differences in study designs and/or limitations in sample size. In order to adequately summarize die accuracy of these markers, we carried out a meta-analysis and systemadcafly review of studies that simultaneously invesdgated PCT and CRP as markers for bacterial infection.
29
METHODS
Retrievin<g tue literature. Ail studies published in MEDLINE from January 1, 1970 through May 30, 2002 that evaluated PCT and/or CRP for the diagnosis of bacterial infections were identified using pre-established scarch strategies. Referring to at least one keyword per category, cross-searcbing of the following five categones were donc using a Boolean strategy:
(1) type of study (descriptive study or diagnosis or epidemiological study or meta-analysis or multicenter study or prospective or review-literature or reproducibffity or test or validation);
(2) site of the study (critical care or hospital or intensive care); (3) subjects (human); (4) test (C-reactive protein or interferon or interleukin or procalcitonin or wbite blood ccli count or sedimentation) and (5) disease (infection or cross infection or hospital acquired infection or
meningitis or multiple organ dysfuncdon syndrome or MODS or pneumonia or sepsis or septicemia or septic shock or systemic inflammatory response syndrome or SIRS). The bibliography of the relevant articles were further cross-checked to search for articles flot referenced in MEDLINE.
Setection ofStudies Inclusion and ExclusionCriteria, and Data Extraction. Studies that
prospectively and simultaneously evaluated both PCT and CR2 as diagnostic markers for bacterial infection in hospitalized patients were evaluated. Studies examining ail age groups were included. Retrospecuve sW±es, reviews, animal studies ami snidies with incomplete data were excluded. The tities and abstracts of ail pertinent articles were reviewed by three independent reviewers (LS, FG, JL) to identifr potentiaily relevant studies. Discrepancies or disagreements, if any, on the inclusion or exclusion of studies were resolved by consensus. Whenever possible, the raw data from the articles were used to construct 2 by 2 tables.
When raw data was unavailable, the tables were constructed using given measures of sensitivity and speciflcity. Some studies reported the sensitivity and specificity at many
cutoff points. In such instances, we chose the cutoff point with the best efflciency value, which is found by dividing the sum of cases classffied as truc positives and truc negatives by the total number of cases.5 Authors ofindividual articles were contacted and asked to complete or correct any missing or incorrect information.
,Quatiy Assessment. We evaluated the methodological quality of the included studies by applying the critena for assessing randomized clinical trials design-related bias described by Chalmers et al.6 Four aspects of each study were evaluated for the assessment of the quality of the research: (1) basic descriptive material; (2) study protocol; (3) analysis of the data and (4) data potentiafly useful for combination of several randomized dinical trials resuits. The latter three aspects were graded and a score was awarded to cadi item under each aspect. Subsequendy, an overail quality index for each study was obtained by adding up the item scores and dividing by the total possible score. Rate of agreement among the three independent reviewers was calculated forcadiitem and expressed as a percentage.
Mela-anaLvsis. The meta-analysis approach that uses linear regression techniques to combine
data from independent studies evaluating similar diagnostic test/critena as described by
Moses and Shapiro was udlized.7 To create diesummary receiver operaung charactenstic
(SROC) curve, we frrst calculated the truc-positive rate (TPR) and false-positive rate (FPR) from each individual study from diereconstructed 2 by 2 tables. These rates were tien
converted tu their logistic transform (log [ITR/f-TPR] and log [FPR/1-FPR]). The sum (S)
31
regression lime fitted to these points, with D as the dependent variable and S as the independent variable (D = a+ bS). Based on this equatiom, the values of semsitivity and
specificity required to construct the SROC curve were then calculated as: sensitivity= 1/(1
+ 1/ea/(l_b) x (1 — specificity/specificity)1
+b)I(1_b)
The resulting values were then plotted in the SROC space to obtain the SROC curve. We took into account the differences in sample sizes among the studies by weighting each observation by the reciprocal of the variance of D and performing weighted regression. To further compare the accuracy between PCT and CRP, we calculated the
Q
values from the SROC cunres obtained for each of these critena. Tins value represents the intersection point of the SROC curve with a diagonal lime from the left upper corner to the right lower corner of the ROC space, where sensifivity andRESULIS
From the initial search of the MEDLINE database (January 1, 1970 to May 30, 2002), a total of 351 publications were retrieved. 0f these, 110 smdies that suggested thatPCT and/or CRP were performed in hospitalized patients with bacterial infection were selected.srI7 On reviewing these abstracts, 21 artic1es977 that prospectively and simultaneously evaluated PCT and CRP were identifled. Another article118 was found after searching the
bibliographies and other related information sources, including textbooks. On detailed review of these 22 articles, 12 of them were deemed appropnate for the meta-analysis.106117 Four of the 22 studies were excluded 100, 102-104
because swdy design was not geared towards the evaluation of the role of PCT and CRP as diagnostic markers of infection, and other outcomes such as prognosis, mortality or PCT kinetics was evaluated. Six other studies were excluded because die swdy population and data extraction was not clear,105’8 die study population was an extension of another published study,97’98’10’ or because no control group was evaluated.99 Whenever possible, authors were contacted and asked to verify the data extracted from the original article. They were also asked to provide any available
supplementary information pertaining to the critena used for diagnosing infection. Resuits of each individual swdy included in the present meta-analysis derived from their 2 by 2 tables are presented in Tables I through 4.
The methodological evaluation of swdy quality is presented in Table 5. The average quality index was 62/101. When evaluating the study protocols, patient selection was always well descnbed and haif of the studies included consecutive patients. Test deflmtion, description
33
and value were adequatelv described in most of the swdies. Assavs were blindly performed, but there vas no blinding when samples were drawn from the patients. The accuracy of the tests vas calculated in ail studies, largehr by construcdng a ROC curve. No description vas available on whether thestatisticianwho performed the analyses vas blinded to the
diagnosis. Resuits were presented in a non-uniform way among the included swdies. There were a total of 324 items rated to evaluate the quality of the studies. Complete agreement between reviewer scores was seen in 86.4% ofthe items (280/324); in 12.7% (41/324) there was agreement between two reviewers, and complete disagreement was obsenred in less than 1% (3/324).
In ail included swdies PCT was measured by an immuno-luminometric assay (ILMA) with
the commercially available LUMItest PCT (distributed by BRAHMS Diagnostica GmbH, Berlin, Germany). However, CRP concentrations were determined using several different techniques and assays. They were: a laser nephelometric technique101 (BN 100, Iviedgenix Diagnostics, Fleurius, Belgium),106’m Image analyser, Beckman,107 immunonephelometric method (BNA analyser, Behring Werke AG, Marburg, Germany),2 enzymatic
heterogeneous sandwich inimunoassay (Vitros 950 analyser;Johnson andJohnson, Rochester, New York, USA),108 EMIT C-reacuve protein assay
G.
Merck Diagnostica, Zûrich, Switzerland),° Vitor 9501 RC System, Ortho-Clincal-Diagnostics GmbH, Neckargemtind, Germany114 or direct immunotrubidimetry Çrina-QuantT1, Boehringer Mannnheim, Germany).”6Bactenal infections were mainly determined by isolation of pathogen from blood and/or other sterile sites, although charactenstic clinical and/or radiological presentation was also
used for the diagnosis. Viral culture and anti-virai or anti-bacterial antibody titers were used in some studies to confrm an infectious diagnosis. Biopsy and autopsy were rarelv
performed. Estimates of sensitivit and specificity of the different tests evaluated are shown in Tables 1 through 4. One swdy108 had three groups of patients (bacterial infections, viral infections and non-infective causes of inflammation) and vas analyzed in both groups presented below.
The SROC curves for PCT and CRP are plotted over the domain ofTPR and FPR in Figure I for 10 studies (905 patients) included in the meta-analysis that evaluated PCT and CRP as diagnostic markers for bacterial infections compared with non-infective causes of
inflammation. The SROC cunre provides evidence on the individual contribution of each swdy to the regression analysis. PCT has signiflcandv bigher accuracy as compared to CRP in the discrimination between bactenal infections and non-infective causes of inflammation. Pooled sensidvity for PCT was 0.88 [95% CI 0.80—0.93] versus 0.75 [95% CI 0.62 —0.84]
for CRP. The difference in sensitivities vas 0.13 (i.e. 13%) [95% CI 0.08—0.171, p < 0.05,
therefore significant. Pooled speciflcity for PCT was also higher than the one for CRP: 0.81 [95% CI 0.67 —0.90] versus 0.67 [95% CI 0.56—0.77], respectively. The difference in
specificities was 0.14 (i.e. 14%) {95% CI 0.08 —0.20], p <0.05, therefore sigrnficant. This
was confirmed on calculation of the
Q
values, which was higher for PCT(Q
= 0. 82 [95%CI 0.64—0.99]) than that for CRP
(Q
= 0. 73 [95% CI 0.64—0.82]).In figure 2, the SROC curves for PCT and CRP are plotted over the domain ofTPR and FPR for 3 studies (592 patients) included in the meta-analysis that evaluated PCT and CRP as diagnostic markers for bacterial infections compared with viral infections. PCT vas also
35
significantlybetter than CRP for differendating between bacterial and viral infections. Pooled sensitivity for PCT vas 0.92 [95% CI 0.86—0.95], compared to 0.86 [95% CI 0.65 —
0.95] for CRP. The difference in sensitivides was 0.06 (i.e. 6%) [95% CI 0.005 —0.11], p <
0.05, therefore significant. Pooled specificides were however comparable: PCT 0.73 [95% CI 0.42 —0.91] versus CRP 0.70 [95% CI 0.19—0.96]. The difference in specificides was
0.03 (i.e. 3%) [95% CI -0.04—0.1], p > 0.05, therefore flot significant. The
Q
valuescalculated from the curves were higher for PCT
(Q
= 0. 89 {95% CI 0.82 —0.96j) than thatfor CRP
(Q
0. 83 [95% CI 0.81 —0.85]), suggesdng that in terms of overail accuracy, PCTDISCUSSION
Early identification of bacterial infections is stiil a challenge for clinicians. It usually requires bacterial culture resuits for the definitive diagnosis, which may take up to at least 48 hours to be available. Identification of an early marker would therefore be extremely useful. Based on our systematic review and meta-analysis, we observed that PCT was, in general, a more accurate marker for bacterjal infection than CRP. This vas observed both when
differentiating between bacterial infections and non-infective causes of inflammation and for differentiating between bacterial and viral infections.
PCT appears to be a promising marker. Under physiologic conditions, PCT is denved from the preprocalcitomn, secreted by the C-cells of the thyroid in response to hypercalcemia.4 The mechanism proposed for PCT production following inflammation and its role are stiil not completely known. It is believed that PCT is produced by the liver119 and bv penpheral blood mononuclear cells,12° modulated by Upopolysaccharides and sepsis-related cytokines. Following stimulation, PCT secretion begins witbin 4 h, peaks at 8 h, remains elevated at 24 h119’121’122 and clears when the insuit appears to be under control.’23 In addition, the kinetics ofPCT are very stable. The assay is relatively easy to perform and the test result is available within two hours, permitting inclusion of the resuits in short-term dinicai decision making. The cost of the test is moderate (approximately US$ 1O).b07
PCT concentration seems to correlate with severity of disease, with levels bigher in patients with severe sepsis than in those with sepsis alone.49’124 PCT concentration also seems to