O
pen
A
rchive
T
OULOUSE
A
rchive
O
uverte (
OATAO
)
OATAO is an open access repository that collects the work of Toulouse researchers and
makes it freely available over the web where possible.
This is an author-deposited version published in :
http://oatao.univ-toulouse.fr/
Eprints ID : 16781
To link to this article : DOI:10.1016/j.epsr.2015.06.009
URL :
http://dx.doi.org/10.1016/j.epsr.2015.06.009
To cite this version :
Manière, Charles and Pavia, Anthony and
Durand, Lise and Chevallier, Geoffroy and Bley, Vincent and
Afanga, Khalid and Peigney, Alain and Estournès, Claude Pulse
analysis and electric contact measurements in spark plasma
sintering. (2015) Electric Power Systems Research, vol. 127. pp.
307-313. ISSN 0378-7796
Any correspondence concerning this service should be sent to the repository
administrator:
[email protected]
Pulse
analysis
and
electric
contact
measurements
in
spark
plasma
sintering
C.
Maniere
a,b,c,
A.
Pavia
a,b,
L.
Durand
b,c,
G.
Chevallier
a,b,
V.
Bley
b,d,e,
K.
Afanga
a,b,
A.
Peigney
a,b,
C.
Estournès
a,b,∗aCNRS,InstitutCarnotCIRIMAT,Toulouse,France
bUniversitéPaulSabatier,118routedeNarbonne31062Toulouse,France
cCNRS-CEMES(Centred’ElaborationdeMatériauxetd’EtudesStructurales),29RueJeanneMarvig,31055Toulouse,France dUniversitédeToulouse,UPS,INPT,LAPLACE,118routedeNarbonne–Bât.3R3,F-31062Toulousecedex9,France eCNRS,LAPLACE,F-31062Toulouse,France
Keywords:
Sparkplasmasintering Currentpulses Jouleheating Electricalcontact Papyex® Experimentaldesign
a
b
s
t
r
a
c
t
Inordertomodelthecurrentdensitydistributionandthetemperaturechangesofthetoolsusedduring aspark-plasma-sintering(SPS)cycle,thevariationofthepowerdeliveredbyanSPSmachineandthe graphite-Papyex®-graphiteelectricalcontactswerestudiedexperimentally.Theelectricdevicewasalso
characterized;inparticularcurrentpulsecharacteristicsandtheirbehaviorwithtimewerestudiedin variousconditionsoftemperature,pulsessequences,materialsandtotalelectricpowerdissipated.It iswellknownthattheperformanceofanelectriccontactisdependentontheappliedpressureandthe temperature.First,byvaryingthepressureduringtheSPScycletheeffectoftheelectriccontactsisclearly seen.Secondly,inordertodeterminethebehaviorofsuchcontactsexperimentallyoverapressurerange of10–50MPaandtemperaturesof50–800◦C,aDœhlertexperimentaldesignwasused.
1. Introduction
Thespark-plasma-sintering(SPS)processisusedto manufac-turecomplexshapedsolidmaterialsfrompowder.Theinteresting partoftheprocessisitsabilitytosinterinafewminuteswhile maintainingafinemicrostructureintherefractorymaterials com-paredtohourswithhighpressure sinteringandseveraltensof hourswithnaturalsintering.Thisperformanceisduetothe simul-taneousapplicationofhighuniaxialpressureandtemperatureby Jouleheatingviapulsedcurrentpassingthroughthetoolsandalso thematerialtobesinteredifitconductselectricity.Moreover,the SPSmethodheatsthepartbeingmadeveryquicklycomparedto thehigh-pressuremethod.
Theaimofelectro-thermalmodelingthisprocesswastopredict thethermalgradientsinthesampleandtoexplaintheireffects onthefinalmicrostructure[1–3].In theliterature,most model-ingisperformedusingthefiniteelementsmethod(FEM).InFEM modelingauthorsoftenconsiderthatallthecontactsareperfect.
∗ Correspondingauthorat:CIRIMAT,118routedeNarbonne,31062Toulouse, France.Tel.:+33561556109;fax:+33561556163.
E-mailaddress:[email protected](C.Estournès).
However,recent works,in particular thatof Pavia [4],where a rapidinfraredcamerawasusedtoobserveanopendieduringa wholeSPScycle,revealedthatheattransferatthePunch/Die inter-facehasapredominanteffectonthethermal-gradientparticularly wheninsulatingmaterialsaresintered[4].Usually,inSPStools,a graphitesheet(Papyex®fromMersenCo.,Gennevilliers,France)is
introducedbetweenthepunch,theinnerdiewallandthesample toensureeasysampleremoval,withalowfrictioncoefficientand goodthermalcontactbetweentheparts.
Thecontactphenomenaandelectricandthermaleffectsare typ-icallydependentnotonlyontheappliedpressurebutalsoonthe temperature[5–8].Theyareexplainedbythenon-idealsurfacedue totheroughnessofthematerialsinvolvedinthecontact[9].
Thechallengeofourpresentstudywastoevaluatethese electri-calcontactresistances(ECR)essentialinFEMmodelingoftheSPS process.Therearealreadysomeworkspublishedonthe determi-nationoftheelectriccontactbetweenthepartsoftheSPStools. Anselmi-Tamburini et al. [10] determined, by ambient electric resistancemeasurements,thepressuredependenceoftheelectric contactinaluminaandcoppersamplesandconcludedthatabove auniaxialappliedpressureof50MPa,itisuselesstoconsiderany contactphenomenainthevicinityofthesample.Buttheydodraw ourattentiontothecontactbetweenthepunchesandthediewhich
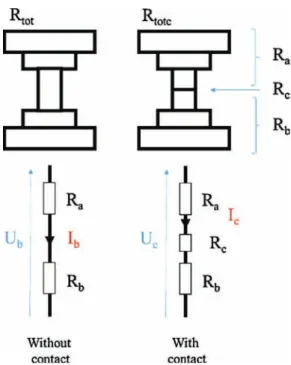
Fig.1. Representationofthetwoset-ups:withandwithoutcontacts[1,2].(Forinterpretationofthereferencestocolorinthisfigurecitationintext,thereaderisreferred tothewebversionofthisarticle.)
isassumedtoplayastrongerrolethantheglobalresistanceofthe tool.Vanmeenseletal.andMcWilliametal.[11,12]madesimilar studiesoftheelectriccontact.Theymeasuredtheelectric resis-tancesofdifferentSPSconfigurationswithandwithoutcontacts. Thenon-contactconfigurationisusedtosubtractallresistances excepttheelectricalcontactresistanceinthecontact configura-tion.ThisprocessisexplainedbelowinEq.(IV)usedtomeasure contactresistance.
In the present study, we chose the same strategy ask-ing them to determine the electric resistances of the graphite/Papyex®/graphite contact to follow the behavior of
the contact with temperature and pressure. Indeed previous studiesmainlyconsideredthepressuredependence oftheECR. Here,aDœhlertexperimentaldesignwasused.
2. Experimental
TheexperimentwascarriedoutontheSPSmachine(Dr.Sinter 2080,SPSSyntexInc,Japan)atthe“PlateformeNationaleCNRSde FrittageFlash”locatedatUniversityToulouseIII-PaulSabatier.
ThefirstpartofthispaperisdevotedtotheanalysisoftheDC pulsedcurrent given bythedevice usedconsideringtwo types ofmaterialstobesinteredrespectivelymore conducting (man-ganese)andinsulating(alumina)comparedtothegraphiteused forthetools(Ref.2333fromMersenCo.,Gennevilliers,France). The molds usedhave either 8 or 36mm inner diameters. Sen-sorswereselectedforsamplingthesignals(u(t)acrossthecolumn andi(t)passingthrough)withasufficientlyhighfrequency(upto 10,000Hz)todescribeeachpulsecorrectly.Fortheinstantaneous currentawidebandRogowskicoilsensor(PowerElectronic Mea-surements,CWT60)wasused.Tomeasurethevoltageacrossthe SPScolumn,thepotentialwasconsidereduniformovertheentire
contactsurface.Fromthesynchronizedvoltageandintensity mea-surements,averageandRMSvalues(Uave,Urms,IaveandIrms)were
calculatedusingaLabviewroutine(NationalInstrumentsoftware). Thesignalwasalsocalibratedusinganoscilloscopetoverifythe correspondencebetweenmeasuredandcalculatedmeanvalues.
Thesecondpartof this paperisdevoted tohighlightingthe importanceofelectriccontactsinSPStools.Inparticular,the elec-triccontactsgraphite/Papyex/graphitepresentmainlyattheinner interfacesofthemoldaredeterminedusingtheprincipledescribed byVanmeenseletal.[11].TwoSPScentralpunchconfigurations werestudied.Onewithtwographite/Papyex®/graphitecontacts
(inredinFig.1)andonewithoutcontacts.Theheightofthispartof thecolumnsisthesameinbothconfigurations.Theelectric resis-tancewasobtainedforeachofthetwoset-upsusingthecurrent andvoltagevaluesgivenbytheSPSmachine.
3. Resultsanddiscussions 3.1. Studyofmachinecurrent
Toknowwhatkindofcurrentvalueisgivenbythedisplayofthe SPSmachine,theRogowskicoilwasplacedbelowtheSPSchamber attheoutputofthecurrent.ThemeasurementsreportedinFig.2
showthatthevalueofcurrentgivenbythemachine(Isps)roughly
correspondstotheaveragecurrentcalculatedbytheRogowskicoil (Iave).
Forthermal effectstudies,it wouldbebettertousetherms ratherthantheaveragevalues.Thecoefficientusuallyusedto con-verttheaverageintormsvalues fortheoreticalrectifiedpulsed current,eitherUorI,issimpleandnear1.11[13].Inanycase,as theelectricalresistanceistheratioofthevoltagetothecurrent intensity,weshoulduseeithertheaverageorthermsvalues.
Fig.2.Comparisonofthedifferentcurrentmeasurements.
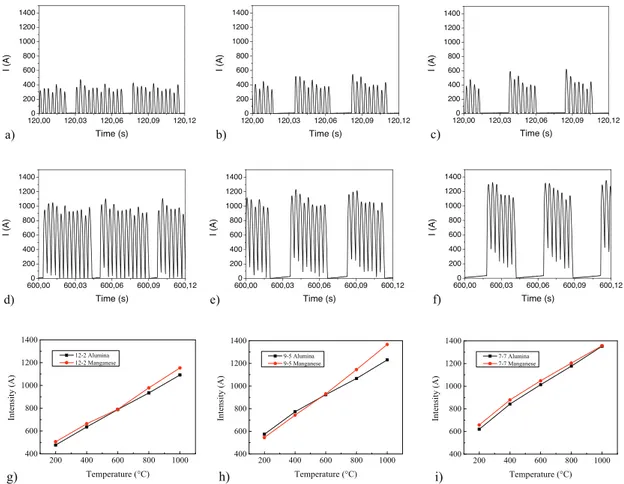
3.2. Studyofpulsedcurrentsequences
TheRogowskicoilsensorallowedustofollowtheintensityand shapeofthecurrentpulsesforvarioussequencesandduringthe wholeSPScycle.Thisrequiredan8mminnerdiametergraphitedie containingeitheraconductingorinsulatingpowderedmaterial(i.e. manganeseoraluminaseeTable1).Threetypesofsequences(Xis thenumberofpulsesandYthenumberofdeadtimes;i.e.X-Y= 12-2,9-5,7-7)weretestedatvarioustemperaturesbetween200and 1000◦Candforanappliedpressureof100MPa.Itwasfound(Fig.3)
thatforthesethreesequences,theactualnumberofpulseswas maintainedcomparedtothenumberaskedforalthoughChenetal.
[14]haveshownthatthisisnotthecaseforsequenceswithsmall numbersofpulses.Inagreementwiththeseauthors,itisshown herethatareductioninthenumberofpulsesatagiventemperature
Table1
Electricalresistivityofvarioussamplematerialsdependingontheabsolute temper-atureT[1;2].
Material Electricalresistivity(m)
Manganese 1.43×10⁻⁶+4.0×10⁻¹⁰T−3×10⁻¹³T2 Alumina 8.7×10¹⁹T−4.82
Graphite 2.14×10⁻⁵−1.34×10⁻⁸T+4.42×10⁻¹²T2
impliesahighermaximumintensity.Theintensityofthepulsesis alsoincreasedwhentemperatureisincreased.Thiseffectisshown inFig.3(g)–(i)whereImaxisplottedversustemperatureforvarious
sequencesforbothaluminaandmanganesepowders.Notethat thereisnottoomuchdifferenceinthevaluesofImaxirrespective
ofthetypematerialstudied. 3.3. Studyofthepulseintensity
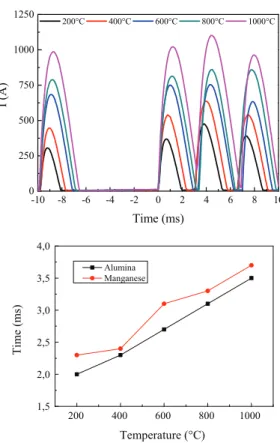
Comparisonof thepulsepatternsacquired atdifferent tem-peraturesfora12-2sequenceallowedustostudythedurations ofthepulsesandthedeadtimes.Pulsedurationincreasedwith temperatureandhencewiththecurrentintensity(Fig.4a).In con-trast,thedeadtime decreasedwithincreasingtemperatureand intensity(Fig.4b)whiletheglobalperiodofthesignalremained unchangedwhateverthetemperature.Thiswasobservedforan 8mminnerdiameterdieconfigurationwitheitheranaluminaora manganesesample,aconfigurationthatdoesnotrequireelevated electricpowertoheatthetools.Itwasalsoobservedon increas-ingthepowerdemandthat,foran8mmdie,whenImaxwasnear
andabove1000A,thesignalnolongerreturnedtozerobetween twosuccessivepulses.McWilliamset al.[12]have shownthat increasingthevolumeof thedieimpliesincreasingtheelectric
g)
200 400 600 800 1000 400 600 800 1000 1200 1400 Intens ity ( A) Temperature (°C) 12-2 Alumina 12-2 Manganeseh)
200 400 600 800 1000 400 600 800 1000 1200 1400 In te n si ty ( A ) Temperature (°C) 9-5 Alumina 9-5 Manganesei)
200 400 600 800 1000 400 600 800 1000 1200 1400 In te n si ty ( A ) Temperature (°C) 7-7 Alumina 7-7 ManganeseFig.3. Recordofthecurrentpulseintensityatdifferenttemperaturesandpulsessequences,((a)–(c))200◦C,((d)–(f))1000◦C,(a,b)12-2,(b,e)9-5,(c,f)7-7,(g–i)Imax measuredinvariouspulsesequencesandtemperatures.
-10 -8 -6 -4 -2 0 2 4 6 8 10 0 250 500 750 1000 1250 I ( A ) Time (ms) 200°C 400°C 600°C 800°C 1000°C 1000 800 600 400 200 1,5 2,0 2,5 3,0 3,5 4,0 T im e ( m s) Temperature (°C) Alumina Manganese
Fig.4. Studyofpulsetimestep:(a)pulseformatdifferenttemperatures;(b)pulse timeversustemperature.
powernecessarytoattainthesametemperatureinthesame con-figuration.Thisimpliesthatthephenomenonpreviouslyobserved (Fig.4)isamplifiedfora36mmdiewhichincreasesthegraphite volumeandtheelectricpowerneededtoheattheassembly. Con-sequentlytheresultingsignalisnolongersimplypulsedbutlooks likeasquarewave(seeFig.5).
3.4. Electricalresistanceofthecolumn
The RMS value of the current (Irms) was obtained using a
RogowskicoilsensorandtheRMSvoltage(Vrms)usingtwo
elec-trodeslocatedbetweenthelargestspacersandtheInconelram cover.TheglobalelectricalresistanceoftheSPScolumncanthus beobtainedbycalculatingtheratioUrms/Irms.Fig.6representsthe
variationoftheelectricalresistanceofthecolumn(Rcalc=Urms/Irms)
versustime intwo SPScycles.Thefirstisobtainedwitha pres-sureof5MPathroughoutthecyclewhilethesecondat100MPa wasappliedbeforethebeginningoftheincreaseintemperature withaheatingrateof100◦C/minupto1000◦Cand4minofdwell.
480,00 480,03 480,06 480,09 0 1000 2000 3000 4000 I (A) Time (s)
Fig.5.Currentpulseshapeathighintensity.
0 200 400 600 800 1000 0 1 2 3 4 5 6 7 R ( 1 0 -3 .O h m ) Time (s)
Fig.6.Electricresistanceofthecolumnwithauniaxialpressureof5MPa(red)or 100MPa(black).(Forinterpretationofthereferencestocolorinthisfigurelegend, thereaderisreferredtothewebversionofthisarticle.)
0 200 400 600 800 1000 0 1 2 3 R ( 1 0 -3 .O h m ) Time (s)
P Before the cycle P Beginning of the cycle P at 500°C P at 1000°C
Fig.7.Electricalcolumnresistanceinvariouspressurecycles.
Theresistancecalculatedforthecycleat5MPawassignificantly higherthanthatobtainedforapressureof100MPa,whichis prob-ablyduetothedifferenceinelectricalcontactresistances(ECR)at thecolumninterfaces.Withthethermalexpansionofthegraphite partsduringtheSPScycle,thepressureincreaseswithtemperature andconsequentlytheECRandtheglobalresistanceofthecolumn decrease,whichisclearlyseenforthelowuniaxialpressure(red curveinFig.6),theinstabilityat300scorrespondingtothe shrink-agezoneduetothesintering.Byvaryingthetimeatwhichthe loadof100MPaisapplied(Fig.7),theresistancewasseentobe higherbeforepressureapplicationbuttendedtoconvergetothe samevalueattheendofthecycle.Thisclearlyshowsthe correla-tionbetweenthepressureandtheECR:anincreaseoftheuniaxial pressureresultsinadecreaseoftheECR.
3.5. MethodofECRdetermination
In the configurations in Fig. 1, all the electrical resis-tancesare in series. Therefore, theelectrical contact resistance graphite/Papyex®/graphite(R
c)canbedeterminedbyremovingthe
valueoftotalelectricalresistanceofthecolumnwithoutcontact (Rtot)fromthatwithcontact(Rtotc),atagivendwelltemperature.
AsintheequivalentschemespresentedinFig.8,whereRc is
thecontactresistanceandRa+Rbisthesumofallotherresistances
presentinthesystem(RatheupperpartandRbthelowerpart):
Rtotc,andRtot,thesumofallseriesresistances,respectivelywith
andwithoutthecentralgraphite/Papyex®/graphitecontacts,from
theratiovoltage(U)/intensity(I). Rtotc= Ra+ Rc+ Rb=Uc Ic (I) Rtot= Ra+ Rb= Ub Ib (II)
Fig.8. Electricalequivalentmodel.
ByreplacingRa+Rbin(I)weobtain:
Rtotc= Rtot+ Rc (III)
Rc= Rtotc− Rtot= Uc Ic
−Ub Ib
(IV) ThevaluesUc,Ub,Ic andIb areaveragevaluesgivenbytheSPS
machineandweredeterminedinthestationarystate(dwell tem-perature).
TodeterminethebehavioroftheECRwiththeappliedpressure andtemperatureanexperimentaldesignwasused.Tosolvethis problemitispossibletouseeitherTaguchi,Dœhlertorcomposite experimentaldesignapproach.Dœhlert’sapproachwaspreferred becauseitgivesusandfutureauthorsthepossibilitytoeasilymove theexperimentaldomaintohigherpressuresand temperatures withaminimumofthreemoreSPSexperiments.
ThedifferentexperimentsinFig.9werecarriedoutapplyingthe Dœhlertexperimentaldesign[15,16].Withthismethod,thechoice ofstudyrangeiscrucial.Indeedthistypeofexperimentaldesign isbasedonthegeneralprincipleofinterpolationofexperimental resultsbyaseconddegreepolynomialfunction.Therefore,ifthe rangeofstudyistoohighthereisariskofhavinganinterpolation functionthatisnotsuitabletodescribeorfittheexperimentaldata points.Ontheotherhand,doingtheinterpolationovertooshorta rangewillnotberepresentative.Therangeofappliedpressureswas
Fig.9. Dœhlertexperiments.
Table2
(a)Thetableofexperimentsand(b)coefficientsofthemodel.
(a)
Pressure(MPa) Temperature(◦
C) ECR() 30 425 1.07E−03 30 425 1.03E−03 50 425 8.99E−04 40 800 4.50E−04 20 800 4.04E−04 10 425 9.67E−04 20 50 3.51E−03 40 50 2.15E−03 (b) Coefficients +/− a0 1.05E−03 3.59E−04
P(a1) −2.41E−04 2.93E−04
T(a2) −1.39E−03 2.93E−04
PT(a12) 8.11E−04 5.86E−04
P2(a11) −1.19E−04 5.08E−04
T2(a22) 8.09E−04 5.08E−04
chosenherebetween10and50MPa.Indeed,inthisconfiguration (diameterofthepart=10mm)thelowthresholdloadleadingtoa stablevaluethattakesintoaccountthedilationofthestack, corre-spondstoaminimumappliedpressureof10MPa.Asreportedby Anselmi-Tamburinietal.,itisuselesstogoabove50MPabecause thecontacttendstobeperfectoverthishighthreshold.The tem-peraturerangeislimitedfrom50upto800◦Cinordertolimitthe
interpolationproblem(seeabove).
Thepolynomialseconddegreemodelis:
y= a0+ a1x1+ a2x2+ a12x1x2+ a11x21+ a22x22 (V) Where,aiaretheeffectcoefficientsofpressure,temperature,the
interaction betweenpressure and temperature,and thesecond degreeeffectsonthepressureandtemperature,ytheresponsehere itistheelectricalcontactresistance,x1isthepressureandx2the
temperature.
3.6. ECRexperimentaldesign
Thepresentmodelhasacorrelationcoefficient(R2)of0.97,i.e.
near1,theinterpolationfunctionoftheresultsisthereforecorrect. Theexperimentaltabletodeterminetheelectricalcontact resis-tances(ECR)ofa10mmdiameterpunchisrepresentedinTable2a. Thecoefficientsofthemodelandtheirstandarddeviation(+/−)are reportedinTable2b.ThecomparisonofthecoefficientsinFig.10
showsapredominanteffectoftemperature(thea2 coefficientis
thehighestandis negativewhichtellsusthat thetemperature decreases theelectrical contact) and that there is a significant pressure/temperatureinteraction(a12).Thepositiveseconddegree
coefficienta12showsthattheincreasesofpressureand
tempera-turehaveapositivecurvature.
Fig.10.Representationofeachvalueofthecoefficientsandtheirstandard devia-tions.
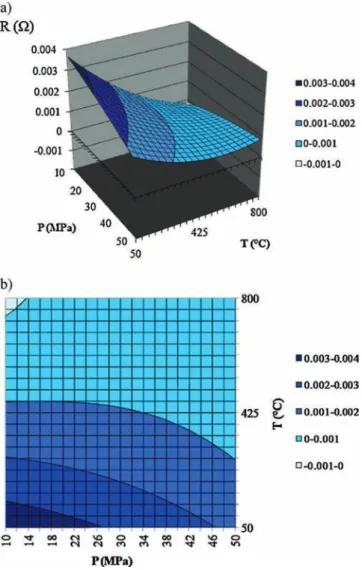
Fig.11.Electricalcontactresistanceversuspressureandtemperature(a)3D repre-sentation(b)2Dprojection.
Fig.11aisa3DgraphoftheinterpolationfonctionoftheECR inandFig.11btheprojectionin2D.Thesefiguresshowthat, asexpected,theECRdecreaseswithappliedpressure and tem-peratureandreachesavaluenearzeroathightemperaturesand pressures.Moreover,thefunctionseemstobeasymptoticwithan increaseoftemperatureandpresureatroughly800◦Cand50MPa
probablyduetothepositiveinterractioncoefficient(a12orPT).In
mostSPScycles,inparticularforsinteringofceramics,the exper-imentalconditionsaresuchthatthevaluesof800◦Cand50MPa
areexceeded.HenceitisperfectlyacceptedthattheECRvaluecan beignoredaroundthesamplewherethepresureandtemperature aremaximum(higherthan50MPaand800◦C).However,forthe
frictionzonewherethecontactbetweenpunches/Papyex® inner
wallofthedieismoving,thepressureisverylowandisnotinthe pressurerangeofthisexperimentaldesignrequiringdetermination usingadifferentapproach.
Theequationofmodel(V)isexpressedincenteredandreduced variableswithmaximumandminimumequalto1and−1.These variablesareusedinexperimentaldesigntobeabletocomparethe effectsofeachoftheexperimentalparameters(suchasPandTin
Fig.10).TorewriteEq.(V)inaformthatcanbeeasilyincludedin electro-thermalmedialization,theECR(m2)canbeexpressedas
afunctionofthepressureP(Pa)andthetemperatureT(K): ECR= 5.85∗ 10−7− 4.68∗ 10−15P− 9.45∗ 10−10T
+ 7.36∗ 10−18PT− 2.33∗ 10−23P2+ 3.39∗ 10−13T2 (VI)
TheECRvaluesobtainedinthepresentstudyareabout3× 10−7 (m2)atlowpressureandtemperatureandoftheorderof7× 10−8
(m2)athighpressureandtemperature.Thesevaluesareofthe
sameordermagnitudeasthoseobtained,forothergraphite refer-ences,byZavaliangaos[5]andMaizzaetal.[8]whoobtainedECR valuesof1.3× 10−7(m2)ontheverticalcontact(lowpressure) and8× 10−8(m2)onthehorizontalcontact(highpressure). 4. Summaryandconclusion
ThepulsedcurrentoftheDr.Sinter2080SPSmachineandthe electriccontactinsidetheSPStoolshavebeenstudied.
Thecurrentpulsesshowedthattheincreaseintemperatureis obtainedbyincreasingthemaximumintensityofthepulsewhile respectingthedesiredpulsepattern.
Theincreaseofthemaximumintensityofthepulsesgoeswith anincreaseof theirstep timeand adecrease ofthedeadtime. Moreover,thepulsecurrentrepresentationathighelectricpower hasshownthattheafterroughly3000Aofmaximumintensitythe shapeofthecurrentcorrespondstoasquarewave.
Measurementsoftheelectricalresistanceofthecolumnshow thatECRexistsanddecreaseswithbothpressureandtemperature. Theexperimentaldesignhelpedustounderstandhowthe elec-triccontactresistance(ECR)workswithpressureandtemperature bythefollowingpoints:
-ECRdecreaseswithpressureandtemperature.
-ECRdecreasesasymptoticallytozeronear800◦Cand50MPa.
-ThelastpointsuggeststhattheseECRarenegligiblearoundthe samplebecausethetemperatures andpressuresarehigher in commoncycles(asshownbyAnselmietal.[10]).
Theelectriccontactsbetweenthepunchesandthedieareina placeofverylowpressure(lowerthan10MPa)andareexpected tohaveastrongerrole.
Acknowledgements
ThesupportoftheLAPLACEfortheinstrumentationandfruitful discussionsandthePlateformeNationaleCNRSdeFrittageFlash (PNF2/CNRS)weregratefullyappreciated.C.MandC.E.thankthe FrenchNationalResearchAgency(ANR)forthefinancialsupportof thisstudywithintheprojectANR09MAPR-007Impulsé.
References
[1]A.Pavia,L.Durand,F.Ajustron,V.Bley,G.Chevallier,A.Peigney,C.Estournes,
Electro-thermal measurementsand finiteelementmethodsimulationsof
a spark plasma sintering device, J. Mater. Process. Technol.213 (2013)
1327–1336.
[2]G.Molénat,L.Durand,J.Galy,A.Couret,Temperaturecontrolinsparkplasma
sintering:anFEMapproach,J.Metall.2010(2010),ArticleID145431.
[3]Th.Voisin,L.Durand,N.Karnatak,S.LeGallet,M.Thomas,Y.LeBerre,J.-F.
Castagné,A.Couret,Temperaturecontrolduringsparkplasmasinteringand
applicationtoup-scalingandcomplexshaping,J.Mater.Process.Technol.213
(2013)269–278.
[4]A.Pavia,Etudefondamentalespourlacompréhensiondesmecanismesdes
matériauxparlatechnologieSparkPlasmaSintering(PhDThesis),Université
ToulouseIIIPaulSabatier,2012.
[5]A.Zavaliangaos,J.Zhang,M.Krammer,J.R.Groza,Temperatureevolutionduring
fieldactivatedsintering,Mater.Sci.Eng.A379(2004)218–228.
[6]D.Tiwari,B.Basu,K.Biswas,Simulationofthermalandelectricfieldevolution
duringsparkplasmasintering,Ceram.Int.35(2009)699–708.
[7]J.Zhang,Numericalsimulationofthermoelectricphenomenainfieldactivated
sintering(Ph.D.thesis),DrexelUniversity,Philadelphia,PA,2004.
[8]G.Maizza,S.Grasso,Y.Sakka,Movingfinite-elementmeshmodelforaiding
sparkplasmasinteringincurrentcontrolmodeofpureutrafineWCpowder,J.
Mater.Sci.44(2009)1219–1236.
[9]R.Holm,ElectricContacts:TheoryandApplications,4thed.,Springer/Verlag
[10]U.Anselmi-Tamburini,S.Gennari,J.E.Garay,Z.A.Munir,Fundamental
investi-gationsonthesparkplasmasintering/synthsisprocess.II.Modelingofcurrent
andtemperaturedistributions,Mater.Sci.Eng.A394(2005)139–148.
[11]K.Vanmeensel,A.Laptev,J.Vleugels,O.VanDerBiest,Modellingofthe
tem-peraturedistributionduringfieldassistedsintering,ActaMater.53(2005)
4379–4388.
[12]B.A.McWilliams,Numericalsimulationofelectricfieldassistedsintering(Ph.D.
thesis),DrexelUniversity,Philadelphia,PA,2008.
[13]R.Mercier,H.Sauvignet,R1015,1986,http://www.techniques-ingenieur.fr/ res/pdf/encyclopedia/tiare-r1015-version1.pdf
[14]U.Chen,U.Anselmi-Tamburini,J.E.Garay,J.R.Groza,Z.A.Munir,Fundamental
investigationsonthesparkplasmasintering/synthesisprocess:I.Effectofdc
pulsingonreactivity,Mater.Sci.Eng.A394(2005)132–138.
[15]D.Vjnovic,D.Chicco,H.El,Zenary,Doehlertexperimentaldesignappliedto
optimisationandquantityofagranulationprocessinhighshearmixer,Int.J.
Pharm.145(1996)203–213.
[16]D.Gazquez, M.Sanchez-Vinas, M.GraciaBagur,G. Garcia,Applicationof
Doehlertdesignsintheoptimisationofexperimentalvariablesassociatedwith
thesimultaneoussolventextractionofseveralmetals,J.Anal.At.Spectrom.13
![Fig. 1. Representation of the two set-ups: with and without contacts [1, 2]. (For interpretation of the references to color in this figure citation in text, the reader is referred to the web version of this article.)](https://thumb-eu.123doks.com/thumbv2/123doknet/3225629.92290/3.892.188.690.121.583/representation-contacts-interpretation-references-citation-referred-version-article.webp)