HAL Id: hal-02479345
https://hal.archives-ouvertes.fr/hal-02479345
Submitted on 1 Jun 2021
HAL is a multi-disciplinary open access
archive for the deposit and dissemination of
sci-entific research documents, whether they are
pub-lished or not. The documents may come from
teaching and research institutions in France or
abroad, or from public or private research centers.
L’archive ouverte pluridisciplinaire HAL, est
destinée au dépôt et à la diffusion de documents
scientifiques de niveau recherche, publiés ou non,
émanant des établissements d’enseignement et de
recherche français ou étrangers, des laboratoires
publics ou privés.
Correlation between artificial and natural weathering of
hemp fibers reinforced polypropylene biocomposites
Célia Badji, J. Beigbeder, Hélène Garay, Anne Bergeret, Jean-Charles
Benezet, Valérie Desauziers
To cite this version:
Célia Badji,
J. Beigbeder,
Hélène Garay,
Anne Bergeret,
Jean-Charles Benezet,
et al..
Correlation between artificial and natural weathering of hemp fibers reinforced
polypropy-lene biocomposites.
Polymer Degradation and Stability, Elsevier, 2018, 148, pp.117-131.
Correlation between arti
ficial and natural weathering of hemp fibers
reinforced polypropylene biocomposites
Célia Badji, Joana Beigbeder, Hélène Garay, Anne Bergeret
∗, Jean-Charles Bénézet,
Valérie Desauziers
C2MA, IMT Mines Ales, Université de Montpellier, 6 avenue de Clavières, 30319 Cedex, France
Keywords: Accelerated ageing Natural ageing Statistical method Hempfibers Temporal equivalence
A B S T R A C T
The degradation behaviors of hempfibers reinforced PP biocomposites under outdoor and artificial weathering were compared to establish a correlation. For this purpose, several measurements were performed throughout the expositions. Mechanical performance was tested by three-point bending test. Microstructure and chemical composition changes were also assessed. Otherwise, visual aspect and topography were determined. The arti-ficial weathering effectively accelerated the degradation mechanisms. Oxidation pathways and surface aspect alteration of both polymer and biocomposites occurred faster. However, whereas biocomposites were mainly subjected to outdoor conditions due to high sensitivity of hempfibers, neat PP was globally mostly affected by laboratory chamber conditions. Its oxidation rate largely outstripped reinforced materials ones. Principal Component Analysis was used for verifying the differences of variables correlations profiles between artificial and exterior ageing dataset in order to compare the degradation mechanisms. Through the statistical analysis, some attempts were made to find equivalence between artificial and outdoor weathering times thanks to properties degradation rate similarities.
1. Introduction
Environmental and production aspect benefits of natural fibers en-courage research and industries to develop bio-based materials. Among them, hempfibers have long been valued for their high strength, and were besides extensively employed in the fabrication of ropes, sails and textiles [1]. Nowadays they are also used as a substitute for glass, carbon or metallicfibers for the reinforcement of thermoplastic matrix. Automotive, building and furniture industries constitute the main ap-plication of biocomposites.
Solar radiation, air, oxygen, rain, temperature and biotic factors constitute the main weather features of materials degradation. Some works reported results regarding biocomposites durability. Few trials performing natural weathering of naturalfibers and flours reinforced biocomposites are reported in literature [2–4]. Synergic effect com-bining temperature, humidity and, ultraviolet (UV) radiation causes materials degradation. Even if exposition to real conditions is reliable to interpret the performance loss, it is difficult to understand the con-tribution of each factor to properties variations. Moreover, outdoor durability test is often laborious and includes irregular changes and slow degradation rate inducing long-term exposures needed to observe noticeable changes. Therefore, artificial weathering carried out in
laboratory chambers can substitute them in order to accelerate the degradation phenomenon and predict outdoor weathering [5–7]. They intended to simulate exposure conditions that would potentially be experienced by materials employed in real world applications.
Most of estimations of correlations between artificial and exterior exposition assumed an intimate link of decomposition rate with only UV light since it is widely accepted that photo-chemical reactions are mainly responsible for properties variations of polymers. So UV lamps are supposed to closely simulate spectral power distribution of sunlight [8]. The reciprocity law is classically used to correlate two ageing [9–11]. This law implies that for a same cumulative UV energy under two types of ageing, the degradation degrees are similar even if light intensities differ. Laboratory ageing of polypropylene (PP) was com-pared to whole year outdoor weathering occurring in Shanghai rea-soning only through UV radiation [12]. Intrinsic viscosity and tensile strength values obtained under outdoor exposure were compared to those measured under several lamps UV intensities. It was noticed that, at the same cumulative UV irradiation, the results of test carried out with lamps whose intensities are 82 and 163 W m−2were more com-patible with the outdoor weathering test, while test achieved under 325 W m−2lamp induced higher loss of tensile strength. Moreover, it was demonstrated by infrared spectroscopy that a different oxidative
∗Corresponding author.
E-mail address: Anne.Bergeret@mines-ales.fr(A. Bergeret).
properties of isotactic polypropylene under several outdoor weathering stations situated in China. They were compared to properties measured under artificial weathering [25]. A modified Arrhenius equation ex-tended to three parameters that are temperature, UV radiation and oxygen pressure, was proposed to correlate properties of outdoor weathered PP with those measured under accelerated ageing. It was demonstrated that a single acceleration factor based on the improved Arrhenius equation and meteorological data could satisfactorily predict outdoor durability. Tidjani et al. estimated an acceleration factor from the carbonyl absorbance whose value was arbitrarilyfixed at 0.1 [26]. The acceleration factor (ratio between artificial and natural ageing times needed to obtain absorbance of 0.1) equalled 29. Most of the time, this ratio was often punctually calculated at just one precise time of weathering and fewer verified the ratio over continuous periods.
Artificial weathering should obviously duplicate changes resulting from exterior exposure. However, artificial ageing does not sometimes exactly correlate with natural exposure [27,28]. Indeed, Martin et al. conducted artificial and outdoor weathering on polyvinyl chloride (PVC) [29]. Short-period exposure in chamber reproduced same color variations as outdoor whereas longer duration caused darkening that was not observed under natural ageing. Nevertheless, Yang et al. showed that when exposition continues further, the surface color of PVC could gradually change from chalky (1000 h) to dark (2000 h) [14]. Thus, this darkening can also result from too long artificial
ex-position.
As the acceleration factor determination only implies property one by one in literature, the main target of this work is to correlate outdoor and accelerated weathering of PP and hempfibers reinforced PP bio-composites through several properties in the same time. The in-vestigation focuses on physical, chemical and mechanical properties changes all along the exposure. Then, in view of literature reports conclusions, one must verify whether degradation mechanisms are si-milar or not through Principal Component Analysis (PCA). Finally, re-lationships between the two types of ageing by finding temporal equivalence will be attempted.
2. Materials and methods 2.1. Materials
Polypropylene grade H733-07 with a meltflow rate of 7.5 g/10 min (230 °C, 2.16 kg) purchased from Braskem Co. (Brazil) was used as thermoplastic matrix. Hemp fibers were provided by AgroChanvre (France). The dispersity of hempfibers whose length (L) and diameter (D) were assessed by optical microscopy (Leica WILD M10, Germany) on 1000fibers and L/D aspect ratio was measured on 60 fibers is pre-sented in Supplementary Data (Figure S1 and S2). After the retting process, their cellulose, hemicelluloses and lignin rates displayed in
Table 1were determined by successive chemical extractions based on TAPPI T264, ASTM D1104 standards [30,31]. Two hempfibers loading 10 wt% (PP10) and 30 wt% (PP30) were chosen. Maleic anhydride grafted polypropylene (MA-g-PP) coupling agent with a 1 wt% grafting rate (Orevac CA100) and supplied by Arkema (France), was added at 3.1 wt% of PP in the biocomposites.
2.2. Material processing
Hempfibers and MA-g-PP have been dried before process for 15 h at 60 °C in an oven to remove residual water. Granules of PP and MA-g-PP
Table 1
Hempfibers chemical composition.
Cellulose Hemicelluloses Lignin Lipophilic extractives Ash
(wt%) 82.1 8.5 4.5 2.7 2.1
mechanism occurred under 325 W m−2 lamp. Thus, the reciprocity law
is not verified in this case. Similarly, in another study, the increment of carbonyl absorbance (measured through infrared experiments) of PP against cumulative exposure energy highlighted outdoor exposure as more impactful than accelerated one for a same amount of UV exposure [13]. Yang et al. attempted to correlate outdoor and artificial
weath-ering (UV radiation followed by spray) of polyvinyl chloride (PVC) in terms of cumulative UV radiation energy Q [14]. When samples were
subjected to a same Q value, desaturation and ultimate strength de-crease were faster under accelerated ageing than under outdoor one. Therefore, as for previous works, both weathering conditions did not correlate according to the classic reciprocity law. However, results obtained from accelerated and natural weathering fitted by application of a power law generalization of the reciprocity law. Indeed, the power index added to the reciprocity formula and related to materials made consistent the aging levels of samples obtained at different radiation intensities when E is constant. Nevertheless, even if samples behaviour is highly UV light dependent, it was shown that different weathering performances can occur even if the cumulative energy of UV irradiation is identical [15]. Indeed, depending on light intensity, different
com-pounds having evolved from aged PP were detected. It was noted that different hydroperoxides decomposition pathways could occur gen-erating either carboxylic acids and ketones or esters by varying UV intensity. Also, the lack of agreement between spectral radiation and solar spectrum on one side and the weather variability on the other side may jeopardize a good simulation. Moreover, other exterior factors such as humidity can catalyse photo-degradation [16–18].
Fabiyi et al. conducted simultaneous natural and accelerated weathering of wood plastic composites (WPC). They compared PP matrix degradation of WPC after outdoor and xenon-arc ageing by considering all exterior factors [19]. Similarly, other comparisons were
carried out without any calculation of degradation acceleration factor which corresponds to the ratio between time of natural weathering and time of accelerated weathering needed to obtain a same degradation degree [20,21]. However, quantitative correlation between artificial
and exterior ageing was also performed to find a temporal equivalence by comparing the alteration degree of the analysed materials. Howard and Gilroy studied low-density polyethylene (LDPE) degradation after very long-term natural and Weather-Ometer ageing [22]. On the basis
of experimental data, they established an expression verifying the re-lationship between the two kinds of exposure. This equation indicated that during the early stage of exposure, changes were faster in the Weather-Ometer chamber than outdoor. Nevertheless, when exposition continued further, the efficacy of the accelerated device falls off at an ever increasing rate. Otherwise, the decisive element for use of wood in the harsh outside environment is its durability. Because of slowness of the natural weathering process of wood, the compressive strength va-lues of wood samples recorded all along the artificial weathering were compared to the value obtained after one-year and two-year exterior weathering in Polish temperate climate [23]. The accelerated ageing
included soaking (16 h), high-temperature step at 70 °C (8 h), and ir-radiation at 30 °C (6 h). Equivalence was deduced from comparison between these artificial conditions and an exterior weathering by re-cording intersection of the two sets of data corresponding to a same rate of degradation. It revealed that the number of artificial cycles re-presenting one-year ageing differed according the wood specie. It was found that short cyclical changes highly put samples under stress. In-deed, cyclic exposures tend to be more severe than steady-state ex-posures [24]. Otherwise, no particular factor was considered as major
influential parameter. They suggested that interaction of many exterior factors induce their degradation. In addition, one single acceleration factor does not exist. Indeed, geographical and climatic conditions, materials composition, strongly contribute to the acceleration.
But correlations between natural and artificial ageing were also deduced from different kinds of properties. For instance, Lv et al. de-termined microstructure, surface morphology and mechanical
were mixed with hempfibers in a BC21 Clextral co-rotating twin-screw extruder (L/D = 36 with the diameter D = 25 mm) (Clextral, France) with the temperature ranging from 190 to 175 °C from feed to die and a screw speed of 220 rpm. Once dried for 3 days at 60 °C, extruded pellets were injection molded in a Krauss Maffei KM50-T180CX (Krauss Maffei, Germany) at 210 °C with an injection speed of 30 cm3s−1to obtain
square specimens of 100 × 100 × 2 mm and ISO 1 dog-bone specimens.
2.3. Weathering conditions 2.3.1. Natural weathering
Natural weathering was carried out in the South West of France from September 2015 to September 2016. The exterior exposition corresponded to a decking use. The weathering conditions were in adequacy with ISO 877–1:2011 standard [32]. The samples werefixed on galvanized racks at an angle of 45° with the ground and looked South. Dog-bone and square specimens were sampled after 1, 2, 3, 6, 9 and 12 months for laboratory characterizations. Average seasonal data were recorded from Pau-Uzein meteorological station [33] and are il-lustrated inFig. 1.
2.3.2. Artificial weathering
Artificial weathering aimed to emulate exterior exposure. QUV-Spray apparatus from Q-Lab (Labomat Essor, France) usingfluorescent UVA-340 lamps providing 365-295 nm UV solar spectrum part was used. The conditions followed the ISO 4892–3:2013 standard [34]. Each 12-h weathering cycle consisted of 8 h of dry UV exposure with an irradiance level of 0.76 W m−2 at λ = 340 nm at 50 °C, followed by 3.75 h of condensation exposure at 50 °C without irradiation and 0.25 h spray step. Specimens were collected for analysis after 100, 150, 250, 500, 750 and 1000 h of exposure.
The designation of non-weathered and weathered materials is fea-tured inTable 2.
2.4. Mechanical characterization
Flexural properties characterization was conducted using Zwick TH 010 press apparatus with a 2.5 kN load cell. Test was carried out at 23 ± 2 °C and 50 ± 10% RH on ISO 1A dog-bone samples (ISO 178:2010) [35]. A three point bending system was utilized with cross-head speeds of 2 and 100 mm min−1for the modulus andflexural stress at the conventional deflection measurements respectively. Flexural stress-strain behaviors of samples were analysed in order to determine elastic modulus Efcalculated between 0.05 and 0.25% of strain and the
stress at the conventional deflection σfccorresponding to the stress at a
strain of 3.5%. Eight replicates specimens of each material were tested. 2.5. Visual aspect characterization
2.5.1. Spectrocolorimetry
A Chroma Sensor 3 spectrocolorimeter (Datacolor, United States) was used to measure the surface color according to the CIE 1976 L*, a*, b* uniform system. The configuration illuminant/observer was set at D65/10°. An increase of L* (from 0 to 100) witnesses a material lightening whereas a* and b* are defined as the chromaticity positions on axes from−300 to +300 which are green (-a*) to red (+a*) and blue (-b*) to yellow (+b*) axes respectively. Color was measured on four areas of three specimens.
2.5.2. Spectrophotogoniometry
A GON 360 goniometer (Instrument Systems, Germany) coupled to a MAS 40 spectrometer with a halogen lamp was used to measure the gloss by collecting the radiometric power at different angles of detec-tion. For this purpose, the source angle wasfixed at 20° according to ISO 2813 standard [36] and detector angles varied from 5° to−60°. More details are given in a previous paper [20]. The haze gloss G1was
determined from the ratio between the intensity obtained for the angle of detection opposed to the source angle−20° and the intensity ob-tained for the angle of−22° both situated in the specular zone (Eq.(1)). The contrast gloss G2was determined from the ratio between the
in-tensity at−20 °C and the intensity collected for the angle of −35° of a diffusely reflected light (Eq.(2)). The higher the value of G1and G2are,
the glossier the surface seems. The gloss was calculated for three re-plicates at four locations on each material.
= = − ° = − ° G I Θ I Θ ( 20 ) ( 22 ) 1 (1) = = − ° = − ° G I Θ I Θ ( 20 ) ( 35 ) 2 (2)
Fig. 1. Mean relative humidity RH (%) and rainfall (mm) (a) and mean temperature T (°C) and instantaneous solar radiation maximum SR (W.m−2) (b).
Table 2
Designation of non-weathered and weathered materials (n: months number, m: hours number). Unweathered (UW) materials Exterior weathered (EW) materials Artificial weathered (AW) materials Designation PP-UW, PP10-UW,
PP30-UW PP-EWn, PP10-EWn, PP30-EWn PP-AWm, PP10-AWm, PP30-AWm
2.6. Microstructure characterization
2.6.1. Differential scanning calorimetry (DSC)
The thermal properties were measured using a PYRIS Diamond ca-lorimeter (Perkin Elmer, United States). The samples (10 mg) were heated from 30 to 210 °C with a heating ramp at 10 °C.min−1under nitrogen atmosphere at a 20 mL min−1flow. Two heating steps with an intermediate cooling step were performed. Two replicate samples per material were analysed. The crystallinity degrees χc1 and χc2 were
determined from thefirst and second heating ramp respectively using Equations(3) and (4): = × × χ H W H (%) Δ Δ 100 c m m 1 1 100 (3) = × × χ H W H (%) Δ Δ 100 c m m 2 2 100 (4)
where W is the PP mass fraction, ΔHm(J.g−1) is thefirst or second
heating ramp melting enthalpy andΔHm100corresponds to the
theo-retical melting enthalpy of a fully crystalline PP (ΔHm100= 209 J g−1
[37]).
2.7. Chemical composition characterization
2.7.1. Fourier Transform InfraRed spectroscopy (FTIR)
A IFS66 spectrometer (Bruker, United States) was used in Attenuated Total Reflectance (ATR) mode to follow the functional groups assigned to the samples degradation. The exposed surfaces were analysed and the spectra of materials were recorded between 400 and 4000 cm−1 with a resolution of 1 cm−1. In order to normalize the spectra, the Min-Max normalization method of the spectra with the 2925 cm−1reference band assigned to the CH2methylene groups was
performed.
2.8. Surface characterization
2.8.1. Confocal rugosimetric measurement
A MICROMESURE STIL system equipped with a STIL CHR150 op-tical sensor (STIL, France) was used to evaluate the roughness by alti-tude measurement of each surface point on the sample without contact with the sample according to the ISO 25178 international standard. The analysis principle is detailed elsewhere [20]. The micrometric range of the optical pen was 285μm. The analysed area X*Y was 5 mm × 5 mm with an analysis step of 10μm in X and Y directions. The roughness parameter Sa followed during the weathering corresponds to the ar-ithmetic mean of the absolute of the height values (Eq.(5)).
=
∑ ∑
= − = − NM z x y Sa 1 ( , ) x N y M 0 1 0 1 (5) with M the number of points along the X axis, N the number of points along the Y axis, and zx,y the altitude inμm. Mean values and standard deviations were obtained from the analysis of four areas of three sam-ples.2.9. Principal Component Analysis (PCA)
Principal Component Analysis (PCA) gives a simple graphical overview on large set of observations of variables (properties) by data reduction. It also estimates the correlation structure of the variables and relatedness between populations. Statistica 13 (Dell, France) software was employed for the statistical calculation. Statistical analysis was used to compare dataset of exterior and accelerated ageing. This aimed tofirst verify if the relationships established between properties are similar for the two weathering. Then, the method was used to attempt correlating the two weathering by individuals (samples) analysis. Variables values were centered-reduced to scale them for overcoming
domination of variables with the highest variance. Table 3 resumes denominations of variables.
3. Results and discussion 3.1. Mechanical performance
Flexural properties of PP and biocomposites were determined all along one-year outdoor (EW) and 1000-h artificial (AW) weathering. Their changes are illustrated in Fig. 2. The higher values of bio-composites mechanical properties recorded whatever the time and type of exposure are associated with the reinforcement and stiffening effect of vegetalfibers. However, elastic modulus (Ef) and conventional
de-flection stress (σfc) of all materials declined during the two weatherings
due to polymer and hempfibers degradation.
Otherwise, the longest-time accelerated ageing more affected more elastic modulus of PP and PP/hempfibers composites than outdoor one due to high number of cyclical changes in moisture, temperature and UV radiation in short times [23]. Also, the performance loss rate over ageing increased from PP to PP30 after exterior ageing whereas it de-creased after artificial one. Indeed, elastic modulus dede-creased by 20% and 8% for PP30-EW and neat PP-EW respectively after 12 months. On the contrary, it diminished by 30% and 41% for PP30-AW and PP-AW respectively after 1000 h. This can be explained by either different degradation mechanisms during EW and AW leading to different per-formance loss speeds or too-long exposition corresponding to more than 1 year of natural exposure covered by the accelerated ageing. The properties presented later will allow further understanding of these variations and target the possible reasons of differences.
As regards trend ofσfcchanges, neat PP stress was more influenced
than PP30 whatever the type of weathering after the total duration. Also, in the last six months,σfcof PP-EW fell by 21% whereas it
re-mained almost constant before. After a 250-h stable period, it linearly dropped by 36% for PP-AW. Thus, artificial ageing amplified the strength loss.
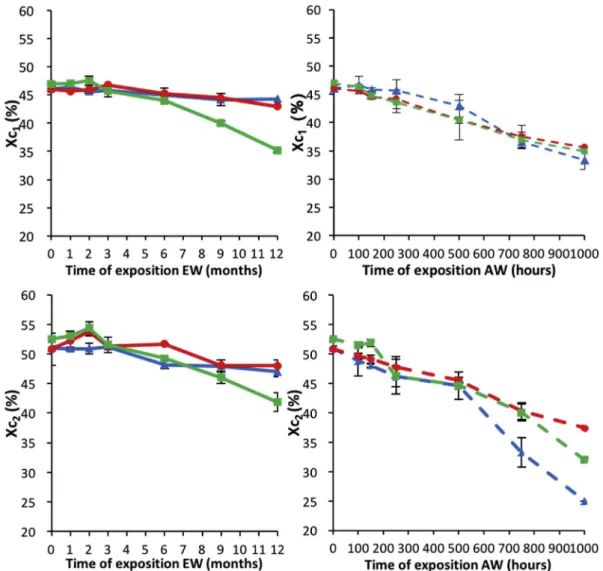
3.2. Microstructure
The crystallinity degree of polymer was influenced by the weath-ering (Fig. 3). Indeed, even if the photodegradation is prevalent in the amorphous phase whose molecular chains can further crystallize, the global decrease of crystallinity rate suggests that crystalline phase was mostly affected [3,38]. Firstly, χc1 was slightly less impacted by
weatherings thanχc2. Indeed, the main difference is noted for PP-AW
decreasing from 46.1 ± 0.2% to 33.3 ± 1.6% and from 51.0 ± 0.3% to 25.0 ± 2.8% forχc1 andχc2 respectively at the end of the AW.
Moreover, some differences were noted between AW and EW. Indeed, the high absolute curve slope ofχc2evolution of artificially aged
ma-terials indicates a higher kinetic of crystallinity rate decrease under
Table 3
Designation of variables. Designation Parameter
E Modulus of elasticity (MPa)
s Stress at the conventional deflection (MPa) χc1,χc2 Crystallinity rate from 1st and 2nd heating steps (%) A1 Absorbance C=O at 1711 cm−1(carboxylic acids and ketones) A2 Absorbance C=O at 1740 cm−1(esters and aldehydes) A3 Absorbance C=O at 1780 cm−1(γ-lactones) A4 Absorbance C=C at 1650 cm−1(vinyls)
Sa Roughness (μm)
G1 Haze gloss
G2 Contrast gloss L* Lightness (light-dark)
a* Chromatic coordinate (red-green) b* Chromatic coordinate (yellow-blue)
artificial weathering conditions. For instance, χc2of PP-AW exhibited a
drastic decrease of 50% in 1000 h whereas PP-EW one lost only 7% of its crystallinity degree original value after 12 months. Otherwise, unlike for EW, neat PP was more subjected to QUV chamber conditions than PP10 and PP30. These observations match with results obtained from modulus measurements. It is noted that onlyχc1corresponds to
mate-rials microstructure when mechanically tested. 3.3. Chemical structure
It is common to monitor photooxidation products in the 1700-1800 cm−1region of FTIR spectra of polymers throughout their ageing. Thus, carbonyls compounds including carboxylic acids in the dimer form and ketones, esters and aldehydes, and lactones peaking at 1711, 1740 and 1780 cm−1respectively were analysed [15]. Thermoplastic polymers can also undergo chain scission inducing vinyl species for-mation whose 1650 cm−1infrared band attests its presence. The ana-lysis is hence focused on absorption bands between 1490 and 1830 cm−1. The infrared spectra of materials that were unweathered, artificially weathered for 1000 h and exterior weathered for one year are featured inFig. 4.
Firstly, increase of all carbonyl and vinyl bands with the fiber loading comes from C=O and C=C bonds naturally present in
cellulose, hemicelluloses and lignin. Also, their increase after exposition of all materials corroborates oxidative mechanism and scission of polymer chains. It can be noticed that lactones level of each material was not influenced by the kind of ageing after 1000 h and one year of accelerated and exterior weathering respectively at the opposite of other carbonyl derived substances whatever the material. Indeed, oxi-dative degradation rate recorded after 1000 h of AW corresponding to 41 days is higher than those after 1 year of EW. So artificial ageing was more impactful than exterior ageing for durations that were chosen in this work.
Similarly, C=C bond peak height was higher for PP-AW1000 than for PP-EW12 whereas no difference was observed for biocomposites. PP was, once again, mainly sensitive to laboratory chamber conditions that accelerated polymer chain scissions.
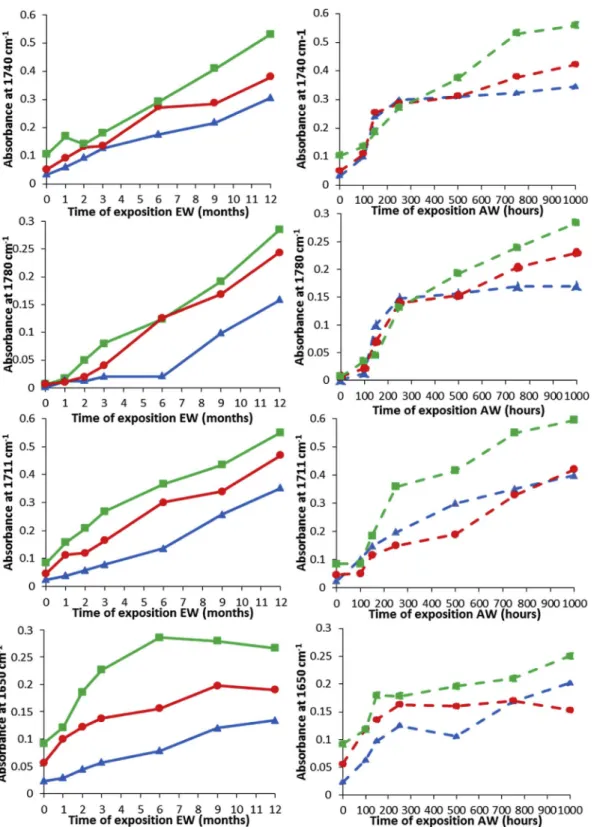
The maximum absorbance evolutions of C=O carboxylic acid and ketone bonds (1711 cm−1), C=O ester and aldehyde bonds (1740 cm−1), C=Oγ-lactone bond (1780 cm−1) and C=C vinyl bond (1650 cm−1) with the ageing time and type (EW, AW) are showed on
Fig. 5. Oxygenated products aroused from hydroperoxide species formed under UV rays and high temperature of the two types of weathering that can decompose into alkoxy radicals which dissociate into lower molecular weight products [25,39]. However, the increase rate of oxygenated products was lower after natural ageing than after
Fig. 2. Elastic modulus and conventional deflection stress of PP (blue), PP10 (red) and PP30 (green) over EW (full line) and AW (dashed line). (For interpretation of the references to color in thisfigure legend, the reader is referred to the Web version of this article.)
Fig. 3. Crystallinity rate of PP (blue), PP10 (red) and PP30 (green) over EW (full line) and AW (dashed line). (For interpretation of the references to color in thisfigure legend, the reader is referred to the Web version of this article.)
Fig. 4. Infrared spectra of UW, EW (1 year) and AW (1000 h) materials: PP (blue based), PP10 (red based), PP30 (green based). (For interpretation of the references to color in thisfigure legend, the reader is referred to the Web version of this article.)
artificial ageing whatever the material. Otherwise, this trend was even more valid for neat PP. So, artificially aged PP underwent stronger oxidative degradation.
As regards carbonyl bonds evolution profile, results show that esters and aldehydes (1740 cm−1) on one hand and lactones (1780 cm−1) on another hand evolving from PP degradation reached a constant absor-bance value after 250 h of 0.3 and 0.15 respectively whereas ketones and carboxylic acids (1711 cm−1) were progressively detected for ar-tificial weathering. This suggests that, at this weathering stage, ketones and acids were formed to the detriment of the previous ones. Same
evolution was observed for biocomposites with a slightly slower in-crease of esters, aldehydes and lactones generation after 250 h rather than a plateau. Therefore, ketones and acids groups could be favored in these conditions of humidity, UV radiation and temperature. Concerning exterior weathering, continuous increase of these oxyge-nated compounds was recorded. However, the maximum shifted from 1740 to 1711 cm−1from non-weathered to weathered state whatever the type of weathering. The hydrolysis of ester species leading to car-boxylic acids could be responsible to the 1711 cm−1 band level in-crease.
Fig. 5. Maximum absorbance values at 1711, 1740, 1780 and 1650 cm−1of PP (blue), PP10 (red) and PP30 (green) infrared spectra over AW and EW. (For interpretation of the references to color in thisfigure legend, the reader is referred to the Web version of this article.)
As concerns a* coordinate values, results showed that
non-weathered PP10 presented higher a* coordinate value (about 3) than non-weathered PP and PP30 (both about 1). This can be attributed to a greater extractives (whose color is reddish) migration at the surface during moulding process for lowfiber rate than for higher fiber content because of steric hindrance due to holocellulose and lignin [42] [43]. The higher extractives proportion at the surface of the lowestfiber rate biocomposite demonstrated by higher a* parameter value, was cer-tainly due to extractives whereas steric hindrance due to holocellulose and lignin limits their migration at PP30 surface. Otherwise, the pre-sence of vegetalfibers induced high chromatic variations of reinforced materials over the expositions. Indeed, a* value of biocomposites di-minished whatever the type of weathering demonstrating a red color loss. This can be attributed to extractives and red chromophores de-gradation or removal due to radiation and rain for EW and spray for AW.
As regards b* coordinate changes, PP30 underwent yellowing during thefirst stage until 6 months (EW) and 500 h (AW), then b* decreased. This evolution has already been observed by Peng et al. demonstrating that yellow paraquinones and photooxidative products formation due to presence of chromophore comprised of carbonyl groups was firstly favored. This preceded the further reduction of paraquinones part into hydroquinones. However, the quinones forma-tion mechanism occurred slower during exterior ageing. Indeed, PP30-AW rose from 1.91 for non-aged sample to 2.45 after 500 h then drastically dropped to 0.20 after 1000 h whereas PP30-EW increased to 3.11 then decreased to 2.32 after 12 months. Similarly, b* value of PP10-AW decrease rate exceeded PP10-EW one. So, in our experimental conditions, chamber testing might be favourable for accelerating the degradation phenomenon.
3.4.2. Gloss
The light angular repartition profile of non-weathered and longest-weathered materials (1000 h for AW and 1 year for EW) is shown in
Fig. 8.
For non-weathered sample, maximum intensity of the specular peak dropped with the vegetalfibers rate meaning that brightness decreased. Some irregularities brought by the presence of short hempfibers at the sample surface were responsible for less smooth surfaces.
After ageing, gloss was reduced for all materials. Indeed, the peak was no longer prominent after weathering and specular zones were no longer well defined, especially for PP30 for which peak almost
Fig. 6. Lightness evolution of PP (blue), PP10 (red), and PP30 (green) materials under EW and AW. (For interpretation of the references to color in thisfigure legend, the reader is referred to the Web version of this article.)
γ-lactones generally originating from intramolecular reactions could evolve from back-bitting mechanism [25]. Otherwise, the evolution of
lactones absorbance peak reveals an auto-accelerated shape meaning first induction stage followed by rapid increase and steady state period [40]. A short induction period, of about 100 h, is observed for PP-AW
whereas this stage lasted 6 months for PP-EW.
As regards vinyl bonds evolution profiles, biocomposites level sta-bilized after almost 6 months and 250 h of natural and accelerated weathering respectively. Indeed, enolic groups can further rearrange into carbonyl species [41]. Also, even if they exhibit the same evolution
profile, vinyl groups level less increased for AW biocomposites than for EW ones. It can be due to continuous high temperature in chamber (50 °C) inducing the higher decrease of vinyls to the profit of carbonyls [25]. However, a different tendency is observed for neat PP since, as for
ketones evolution, it progressively increased. Moreover, the amount of C=C species after one year corresponds to 250 h of accelerated ageing. Thus, this mechanism seems to correlate with an acceleration of de-gradation rate of PP under conditions of artificial exposure that were applied in this study.
3.4. Visual appearance 3.4.1. Color
Fig. 6 depicts lightness evolution versus exposure time. PP was not significantly influenced by the ageing. Nevertheless, results showed that lightness increased for biocomposites because of fibers photo-degradation and structural changes. As reported in literature, oxido-reduction process of lignin leading to formation of hydroquinones due to chromophore structures formation in lignin may induce whitening [4]. The bleaching kinetics of PP10-AW and PP30-AW were more
im-portant than those of PP10-EW and PP30-EW respectively. Otherwise, PP30 bleaching saturated at almost 75 after 3 months of EW and 250 h of AW. This can be explained by the increasing rate of holocellulose at the surface being uncovered after biocomposites exposition. Otherwise, they degraded in a similar manner. Thus, the type of weathering did not modify the evolution profile.
Fig. 7 shows a* and b* colorimetric coordinates in a two-dimension space.
Results show that PP colorimetric coordinates was not highly in-fluenced by the two types of ageing.
disappeared due to diffuse reflection enhancement. No significant dif-ference between PP30-AW and PP30-EW curves was observed. Nevertheless, aged neat PP exhibited short and broad symmetric peak that was extremely less intense than PP-UW one, signifying that polymer was particularly affected. Indeed, the maximum radiometric power value went from 17,094 u.a. to 2676 u.a. and 264 u.a. after EW and AW respectively. Thus, gloss and smoothness decreased faster in
1000 h of artificial ageing than in one year of outdoor natural one. PP10 went through the same tendency.
Evolutions of gloss parameters throughout weathering are presented inFig. 9.
G1and G2of PP-AW significantly decreased from 235 and 4275 to 1
and 5 respectively for thefirst 250 h whereas G1and G2of PP-EW took
one year to go down to 34 and 12 respectively. PP10-AW reached
Fig. 7. Colorimetric coordinates of PP (triangles), PP10 (spheres) and PP30 (squares) over AW (lighter colors) and EW (darker colors) (h: hours, m: months). (For interpretation of the references to color in thisfigure legend, the reader is referred to the Web version of this article.)
Fig. 8. Angular repartition of intensity of light reflected by PP (blue), PP10 (red) and PP30 (green) before (full line) and after 1000-h artificial (dotted line) and one-year natural (dashed line) ageing. (For interpretation of the references to color in thisfigure legend, the reader is referred to the Web version of this article.)
approximately 1 whatever the gloss ratio after longer time (500 h) whereas PP10-EW reached 9 (G1) and 1 (G2) value ratio after 9 and 12 months respectively. Both PP30-AW and PP30-EW parameters rapidly tended to 1 suggesting that intensity level reached a same level what-ever the detection angle. As previously seen, PP was mostly degraded. As regards gloss variations, this trend was confirmed for artificial and outdoor ageing. Moreover, the ratio cannot drop below 1, so the parison between PP30 and PP decrease rates cannot directly be com-pared since non-weathered PP30 already exhibited low gloss para-meters close to 1 and thus swiftly reached the lowest parameter. 3.5. Surface aspect
3.5.1. Roughness
Average roughness was estimated by altitude variations measurement at the samples surface.Fig. 10gathers non-aged and 1000-h artificially and
one-year naturally aged materials. Before ageing, materials surface was relatively smooth. Some surface crackles progressively appeared after-wards, deepened and propagated gradually with ageing time. It is observed that the surface pictures differed according to the kind of weathering and the material and artificial weathering induced more surfaces deterioration. Finally, differences are noted according to the material as neat PP pre-sented regular microcracks whose depth is higher after accelerated ageing. On the contrary, PP30 exhibited some dispersed hollows due to hemp fi-bers removal or protrusion caused by exterior parameters [8].
Fig. 11clearly emphasizes the roughness continuous increase of all materials. By comparing EW and AW graphs, the highest degradation kinetic measured through average roughness parameter during exterior weathering was attributed to biocomposites whereas neat PP roughness outstripped during artificial weathering.
3.6. Statistical analysis
The previous observations do not corroborate the well-known higher sensitivity of biocomposites than conventional glass fibers composites face to UV radiation, temperature and humidity [1,44,45]. In view of properties changes, neat PP was globally particularly de-graded due to artificial degradation. Therefore, parameters im-plemented in the laboratory chamber that strongly affected neat polymer stability may have been over-represented. PCA analysis will permit to understand and clarify these differences.
3.6.1. Global degradation mechanisms
All along the exposition, neat PP and biocomposites properties evolved at different rates. Moreover, depending on the property, the higher degradation kinetic was recorded either for PP or PP30 after artificial weathering whereas the contrary was noted after outdoor ageing. Thus, in order to verify the mechanisms and understand the observed differences, PCA is used to consider all studied properties.
The correlation circles allow representing the profile of correlations
Fig. 9. Gloss parameters over EW (full line) and AW (dashed line) of PP (blue), PP10 (red), and PP30 (green). (For interpretation of the references to color in thisfigure legend, the reader is referred to the Web version of this article.)
between variables and can bring elements on causal relationships (Fig. 12). If the proximity between variables measured after EW differs
from that measured after AW, we can assume that different mechanisms of degradation occurred. For this purpose, values were normalized to non-weathered state values in order to only consider the influence of time of weathering on properties changes for accurate interpretation of global degradation mechanisms induced by exposure. It can be noticed that positions of variables projected on the two circles globally do not differ. Gloss parameters, microstructure and mechanical properties are effectively well defined and positively correlated with the first principal component PC1 (horizontal axis). On the contrary, lightness is
positively represented by PC2 for both ageing. Since weathering times are mainly organized according to PC1 andfiber loading according to PC2 (Fig. 13), normalized stiffness, conventional deflection stress and
crystallinity ratio variables discriminate samples weathered at different ageing times. Finally, A1, A2 and A4 assigned to ketones and acids, to aldehydes and esters and to vinyls normalized absorption bands re-spectively equally contribute to PC1 and PC2. Otherwise, b* coordinate was far away from the two circles meaning that it was not well pro-jected. Thus b* colorimetric parameter cannot be interpreted.
Variables representing roughness parameter Sa and lactone max-imum absorbance A3 contribute at different rates to PC1 and PC2
Fig. 10. Surface images of PP, PP10 and PP30 before (UW) and after artificial (AW) and exterior (EW) weathering.
Fig. 11. Roughness parameter evolution of PP (blue), PP10 (red) and PP30 (green) over AW and EW. (For interpreta-tion of the references to color in thisfigure legend, the reader is referred to the Web version of this article.)
principal components axes drawing. Indeed, A3 and Sa are close to PC1 carrying the highest rate of information of the cloud of data (almost 56%) for EW. But these variables get more contribution to PC2 for AW. By simultaneous interpretation of subjects scatterplots and correlation circles, it is deduced that these parameters mostly discriminate the weathering time according to PC1 thanfiber rate according to PC2 for EW (Figs. 12 and 13). On the contrary, for AW, Sa and A3 mainly distinguish fiber loadings through PC2. Indeed, strong differences of evolution trend of roughness and lactone maximum absorbance be-tween PP, PP10 and PP30 were observed (Figs. 5 and 11). Short-term induction times of 150 h and 100 h respectively before the increase of parameters were verified for PP-AW whereas they increased after 6 months and 1 month respectively for PP-EW. This fact maybe induced the main discrimination offiber loadings for AW (Fig. 13b). Thus, the difference of A3 and Sa positions between AW and EW is explained by the decomposition acceleration generated by the artificial ageing. Otherwise, they remain opposed according to PC1 axis whatever the kind of weathering.
Formation of cracks (Sa variations) were favored by UV rays and rain rather than high temperature [46]. Indeed, it was shown that temperature has not altered the crack growth mechanism [47]. More-over, it has been deduced from infrared spectroscopy that hydrolysis could be responsible for carboxylic acid and ketone functional groups continuously fast increase for AW. Therefore, spray step representing rainfall might accelerate polymer chains scissions. Moreover, water might enhance the diffusion of oxygen in the matter favoring chains oxidation. So, spray and UV radiation steps especially inducing surface aspect changes could be over-represented. Also, in this case, lignin
component found in vegetalfibers certainly acted as antioxidant after extended-time artificial exposure since the increase of the roughness and oxygenated products of artificially aged PP30 kinetic was lower [5,48].
3.6.2. Temporal equivalence
The objective is tofind eventual similar behaviour between natu-rally exteriorly (EW) and artificially (AW) weathered samples. Hence, to assess eventual temporal equivalence, individuals living in a multi-dimensional space whose dimensions number corresponds to the number of variables, were projected on a plan to easily perceive the proximities (Fig. 14). As previously, normalized variables were con-sidered for only considering influence of exposition.
PP-AW100 and PP-EW3 present almost same coordinates according to PC1 axis to which all properties are mostly linked. Therefore, these materials are supposed to present same degradation rate according to the studied properties. Otherwise, they are also close to each other according to PC1 corresponding to the most important linear combi-nation characterized by the most of variables and capturing the largest information (75%). PP-AW250 and PP-EW12 present almost same co-ordinates according to PC1 and PC2. Thus, acceleration factors were calculated by the ratio between time of natural weathering and that of artificial weathering. They were estimated at 22 and 35 at these precise periods. Indeed, it is evident that non-linear evolution induces different acceleration factors according to the weathering stage. However, ke-tone and acid groups absorbance represented by A1 only verified the first equivalence whereas most of other properties mainly confirmed the second one. In literature, Lv et al. determined acceleration factor of
Fig. 12. Correlation circles of normalized variables under EW (a) and AW (b).
Fig. 13. Scatterplots of EW (a) and AW samples (b): PP (blue based), PP10 (red based), PP30 (green based). (For interpretation of the references to color in thisfigure legend, the reader is referred to the Web version of this article.)
PP only thanks to carbonyl index. The values scale ranged from 8.2 to 30 depending on the outdoor conditions and thus included the first value found in our study [25]. Similarly, the acceleration factors cal-culated from accelerated and natural ageing of a different polyolefin that was polyethylene, equaled 29 and 16 because they were de-termined from carbonyl absorbance and elongation at break evolution respectively [26]. So values were different according to the property.
As regards biocomposite loaded at 10 wt% of hempfibers, PP10-AW100 is related to PP10-EW2. Otherwise, 250 h and 6 months also
generated same amounts of damage. Thus, the acceleration factors equal almost 14 and 17.5. In addition, by comparison with neat PP, PP10 required two times higher of natural exposure duration than PP to reflect 250 h of ageing in the QUV chamber.
Finally, as for previous materials, two temporal correspondences are given for PP30. Indeed, the two last natural weathering times 9 and 12 months coincide with 500 and 750 h respectively. So acceleration fac-tors are 13 and 12. The two acceleration facfac-tors are almost equivalent. This can be justified by the fact that the two sampling were very close in
Fig. 14. Correlation circles and scatterplots of PP (a), PP10 (b) and PP30 (c): EW (darker colors), AW (lighter colors). (For interpretation of the references to color in thisfigure legend, the reader is referred to the Web version of this articile.)
4. Conclusion
This work aimed to perform natural and artificial ageing of neat PP and biocomposites and correlate the two weathering conditions. Results showed that conditions of irradiation, humidity, temperature and water spraying chosen in this work accelerated oxidation kinetics and en-hanced mechanical performance decrease under artificial weathering compared to outdoor conditions. The natural fibers photo-oxidation mechanisms inducing surface color variations of biocomposites were accentuated in the QUV chamber. a* and b* colorimetric parameters decrease due to carbohydrates and lignin components decomposition was mostly intensified through artificial ageing. Smooth surface aspect of samples was also altered. Otherwise, the type of roughness differed according to the material with regular cracks for neat PP and some holes for the biocomposite with the highest fiber rate limiting the surface gloss.
Otherwise, results showed that modulus decrease of neat PP is more important than those of biocomposites after artificial ageing. Elsewhere it was observed that the degradation generally increased with thefiber rate after outdoor weathering whereas it decreased after artificial one. It also dug the cracks and holes formed after decomposition causing more deep cracks at neat PP surface.
PCA allowed comparing artificial and exterior weathering. It was found that correlation circles were quite similar apart from variables whose profile exhibited induction stage. Thus, this statistical method has disclosed a relationship between outside and chamber weathering. It permitted to conclude that artificial ageing more accelerated neat PP degradation maybe due to overrepresentation of factors in cycles than those found out of doors and sensitivity of PP face to short cyclical changes.
Depending on the material, different acceleration factors were es-timated from PCA. Indeed, one-year natural exposure of neat polymer was represented by 250 h of accelerated ageing whereas 750 h were required for the highest fiber loading composite. Contrary to studies found in literature that classically put face together values of a same property obtained after accelerated and natural ageing, this statistical method used to estimate acceleration factors allowed to take into ac-count all parameters at the same time. It could be interesting to gen-eralize this approach to other materials and other quantitative para-meters representative of weathering.
Acknowledgements
This research did not receive any specific grant from funding agencies in the public, commercial, or not-for-profit sectors.
Appendix A. Supplementary data
Supplementary data related to this article can be found athttp://dx. doi.org/10.1016/j.polymdegradstab.2018.01.002.
References
[1] A. Shahzad, Hempfiber and its composites - a review, J. Compos. Mater. 46 (2012) 973–986,http://dx.doi.org/10.1177/0021998311413623.
[2] M.Z. Ahmad Thirmizir, Z.A. Mohd Ishak, R. Mat Taib, S. Rahim, S. Mohamad Jani, Natural Weathering of kenaf bastfibre-filled poly(butylene succinate) composites:
effect of fibre loading and compatibiliser addition, J. Polym. Environ. 19 (2010) 263–273,http://dx.doi.org/10.1007/s10924-010-0272-2.
[3] C. Homkhiew, T. Ratanawilai, W. Thongruang, Effects of natural weathering on the properties of recycled polypropylene composites reinforced with rubberwoodflour, Ind. Crop. Prod. 56 (2014) 52–59,http://dx.doi.org/10.1016/j.indcrop.2014.02. 034.
[4] S. Butylina, M. Hyvärinen, T. Kärki, A study of surface changes of wood-poly-propylene composites as the result of exterior weathering, Polym. Degrad. Stabil. 97 (2012) 337–345,http://dx.doi.org/10.1016/j.polymdegradstab.2011.12.014. [5] I. Spiridon, K. Leluk, A.M. Resmerita, R.N. Darie, Evaluation of PLA–lignin
bio-plastics properties before and after accelerated weathering, Compos. B Eng. 69 (2015) 342–349,http://dx.doi.org/10.1016/j.compositesb.2014.10.006. [6] K.C.C.C. Benini, H.J.C. Voorwald, M.O.H. Cioffi, Mechanical properties of HIPS/
sugarcane bagassefiber composites after accelerated weathering, Process Eng. 10 (2011) 3246–3251,http://dx.doi.org/10.1016/j.proeng.2011.04.536.
[7] N.M. Stark, L.M. Matuana, Ultraviolet weathering of photostabilized wood-flour-filled high-density polyethylene composites, J. Appl. Polym. Sci. 90 (2003) 2609–2617,http://dx.doi.org/10.1002/app.12886.
[8] L. Soccalingame, D. Perrin, J.-C. Bénézet, S. Mani, F. Coiffier, E. Richaud, A. Bergeret, Reprocessing of artificial UV-weathered wood flour reinforced poly-propylene composites, Polym. Degrad. Stabil. 120 (2015) 313–327,http://dx.doi. org/10.1016/j.polymdegradstab.2015.07.013.
[9] A. François-Heude, E. Richaud, E. Desnoux, X. Colin, Influence of temperature, UV-light wavelength and intensity on polypropylene photothermal oxidation, Polym. Degrad. Stabil. 100 (2014) 10–20,http://dx.doi.org/10.1016/j.polymdegradstab. 2013.12.038.
[10] J.W. Martin, R.A. Ryntz, J. Chin, R.A. Dickie, R.A. Ryntz, J. Chin, R.A. Dickie (Eds.), Service Life Prediction of Polymeric Materials: Global Perspectives, Springer Science & Business Media, 2008, p. 537, , http://dx.doi.org/10.1007/978-0-387-84876-1.
[11] X. Yang, X. Jiang, J. Hu, F. Wang, C. Hu, Relationship between physical and me-chanical properties of accelerated weathering and outdoor weathering of PVC-coated membrane material under tensile stress, J. Ind. Textil. (2016),http://dx.doi. org/10.1177/1528083716639062.
[12] X. Yang, X. Ding, Prediction of outdoor weathering performance of polypropylene filaments by accelerated weathering tests, Geotext. Geomembranes 24 (2006) 103–109,http://dx.doi.org/10.1016/j.geotexmem.2005.11.002.
[13] Y. Azuma, H. Takeda, S. Watanabe, H. Nakatani, Outdoor and accelerated weath-ering tests for polypropylene and polypropylene/talc composites: a comparative study of their weathering behavior, Polym. Degrad. Stabil. 94 (2009) 2267–2274, http://dx.doi.org/10.1016/j.polymdegradstab.2009.08.008.
[14] X. Yang, X. Jiang, J. Hu, F. Wang, C. Hu, Relationship between physical and me-chanical properties of accelerated weathering and outdoor weathering of PVC-coated membrane material under tensile stress, J. Ind. Textil. (2016),http://dx.doi. org/10.1177/1528083716639062.
[15] J.L. Philippart, C. Sinturel, R. Arnaud, J.L. Gardette, Influence of the exposure parameters on the mechanism of photooxidation of polypropylene, Polym. Degrad. Stabil. 64 (1999) 213–225,http://dx.doi.org/10.1016/S0141-3910(98)00191-8. [16] M.D.H. Beg, K.L. Pickering, Accelerated weathering of unbleached and bleached Kraft woodfibre reinforced polypropylene composites, Polym. Degrad. Stabil. 93 (2008) 1939–1946,http://dx.doi.org/10.1016/j.polymdegradstab.2008.06.012. [17] D.R. Bauer, Interpreting weathering acceleration factors for automotive coatings
using exposure models, Polym. Degrad. Stabil. 69 (2000) 307–316,http://dx.doi. org/10.1016/S0141-3910(00)00074-4.
[18] G.R. Fedor, P.J. Brennan, Technical Bulletin (Q-LAB): Comparison between Natural Weathering and Fluorescent UV Exposures : UVA-340 Lamp Tests Results, (2011). [19] J.S. Fabiyi, A.G. McDonald, Degradation of polypropylene in naturally and
artifi-cially weathered plastic matrix composites, Maderas Cienc. Tecnol. 16 (2014), http://dx.doi.org/10.4067/S0718-221X20140050000210–0.
[20] C. Badji, L. Soccalingame, H. Garay, A. Bergeret, J.-C. Bénézet, Influence of weathering on visual and surface aspect of wood plastic composites: correlation approach with mechanical properties and microstructure, Polym. Degrad. Stabil. 137 (2017) 162–172,http://dx.doi.org/10.1016/j.polymdegradstab.2017.01.010. [21] L. Belec, T.H. Nguyen, D.L. Nguyen, J.F. Chailan, Comparative effects of humid
tropical weathering and artificial ageing on a model composite properties from nano- to macro-scale, Compos. Part A Appl. Sci. Manuf 68 (2015) 235–241,http:// dx.doi.org/10.1016/j.compositesa.2014.09.028.
[22] J.B. Howard, H.M. Gilroy, Natural and artificial weathering of polyethylene plas-tics, Polym. Eng. Sci. 9 (1969) 286–294,http://dx.doi.org/10.1002/pen. 760090409.
[23] A. Jankowska, P. Kozakiewicz, Comparison of Outdoor and Artificial weathering using compressive properties, Wood Res. 59 (2014) 245–252.
[24] M. Crewdson, Outdoor weathering must verify accelerated testing, Antec 2011 (91) (2010) 260–266.
[25] Y. Lv, Y. Huang, J. Yang, M. Kong, H. Yang, J. Zhao, G. Li, Outdoor and accelerated laboratory weathering of polypropylene: a comparison and correlation study, Polym. Degrad. Stabil. 112 (2015) 145–159,http://dx.doi.org/10.1016/j. polymdegradstab.2014.12.023.
[26] A. Tidjani, R. Arnaud, A. Dasilva, Natural and accelerated photoaging of linear low-density polyethylene: changes of the elongation at break, J. Appl. Polym. Sci. 47 (1993) 211–216,http://dx.doi.org/10.1002/app.1993.070470203.
[27] Z.N. Azwa, B.F. Yousif, A.C. Manalo, W. Karunasena, A review on the degradability of polymeric composites based on naturalfibres, Mater. Des. 47 (2013) 424–442, http://dx.doi.org/10.1016/j.matdes.2012.11.025.
time as much outside (9 and 12 months) as in the chamber (500 h and 750 h). Also, plots of properties such as carbonyl groups maximum absorbance, conventional deflection stress and elastic modulus as a function of weathering time present linear correlation coefficients su-perior to 0.90. This can justify the low difference between acceleration factors since for linear evolution, the ratio between the slope of EW and AW corresponds to acceleration factor.
[28] C.A. Taylor, A. Amiri, D.C. Webster, C.A. Ulven, Long-term behavior of bio-com-posites for structural applications, CAMX 2016-Compos, Adv. Mater. Expo (2016), http://dx.doi.org/10.13140/RG.2.2.33964.87682.
[29] K.G. Martin, R.I. Tilley, CSIRO Australia, Division of Building Research Report 04-2-6, (1970).
[30] J.S. Han, J.S. Rowell, Chemical composition offibers, in: R.M. Rowell, R.A. Young, J.K. Rowell (Eds.), Pap. Compos. From Agro-based Resour, CRC/Lewis Publishers, 1996, pp. 84–134.
[31] J. Acera Fernández, N. Le Moigne, A.S. Caro-Bretelle, R. El Hage, A. Le Duc, M. Lozachmeur, P. Bono, A. Bergeret, Role offlax cell wall components on the microstructure and transverse mechanical behaviour offlax fabrics reinforced epoxy biocomposites, Ind. Crop. Prod. 85 (2016) 93–108,http://dx.doi.org/10. 1016/j.indcrop.2016.02.047.
[32] ISO 877–1: Plastics – Methods of Exposure to Solar Radiation – Part 1: General Guidance, (2011).
[33] Pau-Uzein meteorological station, Real-time Weather Reports, (2016)http://www. infoclimat.fr/observations-meteo/temps-reel/pau-uzein/07610.html, Accessed date: 16 June 2017.
[34] EN ISO 4892-3: Plastics - Methods of Exposure to Laboratory Light Sources - Part 3: Fluorescent Lamps, (2013), pp. 2–14.
[35] ISO 178:2010, Plastics– Determination of Flexural Properties, (2010). [36] ISO 2813: Coatings: Determination of Gloss Value at 20°, 60° and 85°, (2014), pp.
1–31.
[37] L.H. Sperling, Introduction to Physical Polymer Science, fourth ed., John Wiley & Sons, 2006, ,http://dx.doi.org/10.1002/0471757128.ch9.
[38] N.M. Stark, L.M. Matuana, Influence of photostabilizers on wood flour-HDPE composites exposed to xenon-arc radiation with and without water spray, Polym. Degrad. Stabil. 91 (2006) 3048–3056,http://dx.doi.org/10.1016/j.
polymdegradstab.2006.08.003.
[39] J.F. Rabek, Photostabilization of Polymers: Principles and Applications, Elsevier Applied Science, 1990,http://dx.doi.org/10.1007/978-94-009-07-47-8.
[40] S. Morlat, B. Mailhot, D. Gonzalez, J.L. Gardette, Photo-oxidation of polypropylene/ montmorillonite nanocomposites. 1. Influence of nanoclay and compatibilizing agent, Chem. Mater. 16 (2004) 377–383,http://dx.doi.org/10.1021/cm031079k. [41] S.A. Jabarin, E.A. Lofgren, Photooxidative effects on properties and structure of
high-density polyethylene, J. Appl. Polym. Sci. 53 (1994) 411–423,http://dx.doi. org/10.1002/app.1994.070530404.
[42] D. Rosu, R. Bodîrləu, C.A. Teacə, L. Rosu, C.D. Varganici, Epoxy and succinic an-hydride functionalized soybean oil for wood protection against UV light action, J. Clean. Prod. 112 (2016) 1175–1183,http://dx.doi.org/10.1016/j.jclepro.2015.07. 092.
[43] A.J. Vinha, A.G. Carvalho, M. Teixeira de Souza, C. Marangon Jardim, A. de Cassia Oliveira Carneiro, J. Luiz Colodette, Effect of extractives on wood color of heat treated Pinus radiata and Eucalyptus pellita, Maderas Cienc. Tecnol. 17 (2015) 857–864,http://dx.doi.org/10.4067/S0718-221X2015005000074.
[44] G. Dorez, L. Ferry, R. Sonnier, A. Taguet, J.-M. Lopez-Cuesta, Effect of cellulose, hemicellulose and lignin contents on pyrolysis and combustion of naturalfibers, J. Anal. Appl. Pyrol. 107 (2014) 323–331,http://dx.doi.org/10.1016/j.jaap.2014.03. 017.
[45] P. Wambua, J. Ivens, I. Verpoest, Naturalfibres: can they replace glass in fibre reinforced plastics? Compos. Sci. Technol. 63 (2003) 1259–1264,http://dx.doi. org/10.1016/S0266-3538(03)00096-4.
[46] H. Du, W. Wang, Q. Wang, S. Sui, Y. Song, Effects of ultraviolet absorbers on the ultraviolet degradation of rice-hull/high-density polyethylene composites, J. Appl. Polym. Sci. 126 (2012) 906–915,http://dx.doi.org/10.1002/app.36558. [47] M.M. Thwe, K. Liao, Durability of bamboo-glassfiber reinforced polymer matrix
hybrid composites, Compos. Sci. Technol. 63 (2003) 375–387,http://dx.doi.org/ 10.1016/S0266-3538(02)00225-7.
[48] Y. Peng, R. Liu, J. Cao, Y. Chen, Effects of UV weathering on surface properties of polypropylene composites reinforced with woodflour, lignin, and cellulose, Appl. Surf. Sci. 317 (2014) 385–392,http://dx.doi.org/10.1016/j.apsusc.2014.08.140.