Publisher’s version / Version de l'éditeur:
ASHRAE Transactions, 111, Pt. 1, pp. 1-14, 2005-03-01
READ THESE TERMS AND CONDITIONS CAREFULLY BEFORE USING THIS WEBSITE. https://nrc-publications.canada.ca/eng/copyright
Vous avez des questions? Nous pouvons vous aider. Pour communiquer directement avec un auteur, consultez la
première page de la revue dans laquelle son article a été publié afin de trouver ses coordonnées. Si vous n’arrivez pas à les repérer, communiquez avec nous à PublicationsArchive-ArchivesPublications@nrc-cnrc.gc.ca.
Questions? Contact the NRC Publications Archive team at
PublicationsArchive-ArchivesPublications@nrc-cnrc.gc.ca. If you wish to email the authors directly, please see the first page of the publication for their contact information.
NRC Publications Archive
Archives des publications du CNRC
This publication could be one of several versions: author’s original, accepted manuscript or the publisher’s version. / La version de cette publication peut être l’une des suivantes : la version prépublication de l’auteur, la version acceptée du manuscrit ou la version de l’éditeur.
Access and use of this website and the material on it are subject to the Terms and Conditions set forth at
Investigation of effectiveness of emergency ventilation strategies in the
event of fires in road tunnels
Kashef, A.; Lougheed, G. D.; Bénichou, N.; Debs, A.
https://publications-cnrc.canada.ca/fra/droits
L’accès à ce site Web et l’utilisation de son contenu sont assujettis aux conditions présentées dans le site LISEZ CES CONDITIONS ATTENTIVEMENT AVANT D’UTILISER CE SITE WEB.
NRC Publications Record / Notice d'Archives des publications de CNRC:
https://nrc-publications.canada.ca/eng/view/object/?id=a12390ca-9cfe-445c-b916-c0b84fff32b1 https://publications-cnrc.canada.ca/fra/voir/objet/?id=a12390ca-9cfe-445c-b916-c0b84fff32b1
Investigation of emergency ventilation strategies
effectiveness in the event of fires in road tunnels
Kashef, A.; Lougheed, G.D.; Bénichou, N.;
Debs, A.
NRCC-47015
A version of this document is published in / Une version de ce document se trouve dans: ASHRAE Transactions, v. 111, pt. 1, 2005, pp. 1-14
Investigation of Emergency
Ventilation Strategies Effectiveness
in The Event of Fires in Road Tunnels
ABSTRACT
A research project is being conducted at the National Research Council of Canada (NRC) to evaluate the effectiveness of current emergency ventilation strategies to control smoke spread in the event of a fire in two road tunnels. The research study includes numerical and experimental phases. The numerical phase uses Computational Fluid Dynamics (CFD) models to study smoke ventilation in the tunnels. The experimental phase is used to calibrate and to partially validate the chosen CFD models and to provide the necessary initial and boundary conditions.
SOLVENT, a CFD model, was used to model ventilation scenarios using existing data. The current paper presents the efforts to validate the CFD model against onsite flow and fire test measurements conducted in a 1.8 km road tunnel. The CFD model includes aerodynamically significant physical features of the tunnel and is customized to provide general roughness replicating the actual roughness in the tunnel.
INTRODUCTION
Fires in tunnels pose major safety issues and challenges to the designer, especially with the increase in the number of tunnels, their length and number of people using them. The main fire safety issues include (NFPA 502 2001, Lacroix, D. 1998): safe evacuation of people inside the tunnel, safe rescue operations, minimal effects on the environment due to the release of combustion gases and a minimal loss of property.
The safety of tunnel users and rescuers is the main objective for the emergency ventilation system (EVS). Life can be threatened in a number of ways: the inhalation of combustion products such as carbon monoxide and carbon dioxide, and the exposure to high temperatures and heat fluxes. Evacuation can be significantly affected by poor visibility, power failure, blocked exits due to traffic jams or crashed vehicles, or obstruction resulting from a collapse or explosion in the tunnel. Temperatures up to 1350oC and heat fluxes in excess of 300 kW/m2 can be generated within a few minutes of ignition in certain types of fires. For safe evacuation, acceptable visibility and air quality must be maintained in the tunnel.
From the beginning of a fire, the airflow in a tunnel is modified and becomes highly unsteady. The modifications are due to the fire itself, the operation of the emergency ventilation system, and the change in the traffic flow in the tunnel. The smoke progress and its degree of stratification depend mainly on the airflow in the tunnel. With no airflow in the fire zone, the smoke moves symmetrically on both sides of the fire (Heselden, A J M. 1976). The smoke remains stratified until it cools down due to the combined effects of the convective heat exchange with the tunnel walls and the mixing between the smoke and the fresh air layer. The other parameters that affect the smoke flow (Heselden, A J M. 1976) and stratification are: fire heat release rate, tunnel slope and traffic flow.
In the event of a fire, the intent of the EVS is to provide tunnel users with a safe egress route that is free of smoke and hot gases. Tunnel operators must implement a plan of smoke clearing, which consists of selecting a sequence of fan operation with the objective of keeping the road upstream of the fire accident smoke free. This is done by limiting the upstream smoke flow and either venting it using fans or letting it escape through the downstream portal. When the fire department arrives on the fire scene, the operator must cooperate and modify, as needed, the fan operation in order to facilitate access to the site.
Establishing airflow requirements for roadway tunnels and consequently the capacity of the EVS is a challenging task due to the difficulty of controlling many variables. These include changes in traffic patterns and operations during the lifetime of the facility. Methods of controlling air contaminants and smoke from a fire in a tunnel using EVS include longitudinal airflow, smoke extraction and smoke dilution.
To evaluate the effectiveness of the emergency ventilation strategies in the event of a fire in the two tunnels in Montreal, Quebec, NRC has undertaken a research project with the Ministry of Transportation of Quebec, Canada.
The first two stages of the project have been completed. An extensive literature review on vehicle tunnel ventilation for fire safety has been completed and provided a rational basis for choosing two CFD numerical models for the initial evaluation: namely, SOLVENT (Innovative Research, Inc./Parsons Brinkerhoff, Inc. 2000) and Fire Dynamic Simulator (FDS) (McGrattan et al. 2000). Based on comparisons with field test data, a model will be selected for use in the remainder of the project.
Tunnel Ventilation System
The L.-H.-La Fontaine road tunnel (Figure 1), built in 1964, is located in Montreal, and travels underwater in a north-south direction. The tunnel is 1.8 km long with three lanes in each direction, inside two concrete tubes. Two ventilation towers are located at the ends of the underwater section. A control and monitoring centre for the tunnel is located at the North tower. A central section separates the two tubes. Galleries located in this section are used to supply air along the tunnel length via openings distributed along the walls (Figure 2) and these galleries can also be used as evacuation routes. Doors at various locations along the length of the tunnel provide access to the gallery. There are doors between the galleries providing a route to the other roadway. The wall openings have adjustable dampers to ensure uniform air distribution. The side vents are situated in two rows, upper and lower. The lower and the upper rows are located at heights of 1.0 and 3.9 m above the tunnel floor, respectively, and at intervals of approximately 6 m. The two rows of vents are offset by 3 m.
The tunnel ventilation is provided by a semi-transverse ventilation system with local extraction points (Figure 1). The ventilation system is composed of 8 ceiling exhaust fans (4 fans for each roadway) and 8 fans that supply air through the side vents which are uniformly distributed along one wall for each roadway. All fans can operate in reverse mode. Therefore, fresh air may be supplied at either the ceiling (fans VE151 through VE254), or by fans VA101 through VA204 through the side vents. In the exhaust mode, fans VE151 through VE254 can operate at 30 or 60 Hz, and in the supply mode they can only
operate at 60 Hz. In the supply mode, fans VA101 through VA204 can operate at: 30, 40, or 60 Hz. In the exhaust mode, these fans can only operate at 60 Hz.
EXPERIMENTAL WORK
Airflow measurements and fire tests were conducted in the North roadway of the L.-H.-La-Fontaine tunnel. The initial airflow measurements (Kashef et al. 2003) were used to establish the ventilation scenarios for the fire tests (Kashef et al. 2004) and to provide input data for the CFD models.
Airflow Measurements
Onsite airflow measurements were used to determine the capacity of the current EVS of the tunnel and to establish the boundary conditions for the CFD models. Airflow measurements were made throughout the EVS and the tunnel for selected ventilation scenarios. In addition, the range of airflow conditions at the tunnel portals was established.
Two fire scenarios were used for the ventilation tests. One fire scenario was located near the mid-tunnel (at a distance in the range of 555 to 615 m from the north portal) and the second close to ventilation fan VE153 (at a distance in the range of 355 to 555m from the north portal). For these fire locations, one emergency ventilation scenario (hereinafter referred to as the “main scenario”) was activated which used fans VA103 and VA201 in the supply mode and fans VE151 and VE153 in the exhaust mode. After conducting flow measurements of the main scenario, fan VE251 was activated in the supply mode, in addition to the already-active fans of the main scenario (hereinafter referred to as the “secondary scenario”).
Airflow temperature and pressure difference measurements were made for both the main and secondary scenarios at selected side vents (VA101, VA103, and VA201), ceiling vents (VE151, VE153, VE251, and VE253) and at several tunnel cross-sections. Additional measurements were conducted using weather stations at the two portals, in the tunnel, and within the evacuation passage (VA103 gallery). Flow measurements were also conducted at a few locations across the tunnel for the secondary scenario. Air temperatures were used to calculate the air density.
The airflow balance in the tunnel was carefully considered during the tests, especially for the main scenario, as a check of the various airflow measurements. The net airflow (out of the tunnel) was calculated to be about 34.5 m3/s or 43.1 kg/s (assuming an air density of 1.25 kg/m3 at an ambient temperature of 9oC). As will be demonstrated in the numerical section, it is believed that this net airflow out of the tunnel can be attributed to an underestimation of airflow at the south portal.
Air temperatures and speeds were measured at selected upper and lower side vents in the North Roadway. The differential pressure between the tunnel environment and the gallery was also measured at the lower vents. Measurements were made at side vents located at the beginning, quarter points, and at the end of the ventilation galleries to provide information on airflow in each gallery. The air speed was measured at 5 points for the lower vents and at 3 points for the upper vents. Air velocities were also measured at 9 points at the two portals and the middle of the tunnel.
In order to determine the bulk flow at a given location, the cross-section was divided into 3, 5, or 9 sub-areas associated with the measurement points. The velocity of air at each point was considered to represent the entire sub-area. The bulk flow was then computed by multiplying the air velocity by its corresponding sub-area and then adding the results for all sub-areas. A positive air velocity within the tunnel represents airflow from the north portal towards the south portals. The error in the values of bulk flow rates calculated using this method is estimated to be in the range of 2-4% as there was in allowance for the effect of the turbulent boundary layer flow. A summary of airflows in the tunnel for both the main and secondary scenarios is shown in Figures 3 and 4, respectively.
The pressure inside the ventilation gallery must be larger than that in the tunnel roadway to ensure that the airflow is directed from the gallery into the tunnel. This would also ensure a smoke-free escape route in the gallery for tunnel users. In general, the main flow direction was from the ventilation gallery into the tunnel area. This was confirmed by releasing cold smoke bombs at different locations in the tunnel, representing smoke and fire effluent sources. No smoke was observed within the two ventilation galleries and the results indicated that the airflow was directed into the tunnel.
Ventilation fan VA101 was not activated as part of the selected ventilation scenario. However, low positive airflow velocities were measured at the side vents in this section of the supply system. The airflow conditions were measured within the ventilation gallery of fan VA103. The air speed was 14.5 m/s indicating a dynamic pressure of approximately 131 Pa.
During the cold smoke tests, it was observed that smoke was efficiently cleared when the smoke source was placed close to exhaust fans VE151 and VE153. However, when the source was placed near the middle section of the tunnel, it took longer for the smoke to clear as a result of low airflow velocities in this section of the tunnel. This suggested that other ventilation scenarios should be explored for a fire located near the middle of the tunnel.
By activating fan VE251 in the supply mode, higher air velocities were recorded near the middle section of the tunnel (Figure 4). This in turn improved the smoke clearance. However, in examining the airflow distribution, only a small portion of the air supplied by VE251 was directed towards the middle section of the tunnel with the remaining portion of supplied air directed towards the south portal. This increased the airflow exiting the portal from 72 to 189 m3/s.
Also shown in Figures 3 and 4, the airflow introduced at the side vents by fan VA103, together with the air pulled through the north portal, was comparable to the airflow exhausted by fans VE151 and VE153. As a result, minimum airflows was drawn from the middle of the tunnel, causing low airflow velocities at mid-tunnel and beyond. Even with the activation of fan VE251 in supply mode (secondary scenario), the airflow was mainly directed to the south portal, resulting in little improvement in airflow velocities at the middle of the tunnel. It is believed that most of the flow exiting the south portal was fresh air supplied by fans VA201 and VE251.
Fire Tests
Fire tests were conducted using a propane burner system developed by NRC. Two fire tests were conducted in the North Roadway of the tunnel (Figure 5): one in the middle of the tunnel and one close to the exhaust fans at the north end of the tunnel. Two different EVS scenarios were activated for the two tests. For Test 1, the EVS scenario used the two fans VE151 and VE153 in the exhaust mode and the two fans VA103 and VA201 in the supply mode. In Test 2, a similar EVS scenario was activated except fan VA103, which was used in the exhaust mode.
During the planning phase, the project team investigated several issues to develop the fire source for the in-situ fire tests. These issues included: fire source alternatives, fire size, test duration, tunnel safety and test logistics.
In order to simulate a fire, the heat source must produce a buoyant airflow. Therefore, the heat source must convert a substantial portion of the energy to heating the air to produce convective airflow. As such, cold smoke systems or electrical systems that produce primarily radiant heat are not applicable. Various clean-burning fuel arrangements, including alcohol pan fires, propane burners and oil-fuelled burners, were explored for this project. A clean-burning propane burner system that produces minimal smoke was developed for the in-situ fire tests. The burner was about 1.3 m wide and 1.83 m long. This system was a compact, portable and convenient heat source that is capable of producing up to 5 MW of heat output simulating a small car fire. Artificial smoke was used for visualization purposes with four smoke bombs added at 1 min intervals.
The fire size was selected so as to minimize damage to the tunnel structure and different components and to produce reliable data for the calibration and validation of the numerical models. Based on preliminary laboratory tests, CFD simulations as well as discussions with the tunnel authority and the local Fire services, the heat output for the fire tests was limited to 2 MW. The objective was to limit the temperature at the tunnel ceiling below 100°C.
Other concerns considered during the planning stage included: ensuring that the smoke from the smoke bombs was well-mixed with the plume from the propane burner so as to produce hot buoyant smoke; ensuring that the smoke was not recycled into the South Roadway that was open to traffic. Initial flow measurements tests indicated that it took longer to clear the smoke with the fire located close to mid-tunnel. Therefore, the fire test with the fire located close to the exhaust fans VE151 and VE153 preceded the second test where the fire was located at the middle of the tunnel.
Temperature and smoke optical density (SOD) measurements were conducted. These measurements were taken at 60 locations downstream of the fire and 20 locations upstream of the fire. Table 1 presents the SOD values measured downstream of the fire for the two tests. Also, the air speed was measured at the two portals, mid-tunnel, exhaust fan locations, and inside the evacuation paths located between the two roadways.
A thermocouple tree was constructed at each fire location to measure the centreline plume and ceiling temperatures. The thermocouple tree included 11 thermocouples, distributed vertically along the tunnel height and horizontally at the ceiling spanning 6 m upstream and downstream from the fire.
Table 1: Smoke Optical Density (SOD) Measurements
TEST 1 TEST 2 Y Location Z 1.5 3.0 6.4 9.1 11.3 1.5 3.0 6.4 9.1 11.3 1.5 0.030 0.030 0.030 0.030 0.030 0.039 0.041 0.050 0.051 0.048 3.0 0.030 0.030 0.030 0.030 0.030 0.066 0.070 0.081 0.061 0.056 4.0 0.067 0.065 0.077 0.044 0.045 0.053 0.060 0.049 0.049 0.057 1 4.6 0.080 0.073 0.066 0.088 0.046 0.064 0.060 0.066 0.058 0.057 1.5 0.050 0.050 0.043 0.043 0.036 0.050 0.072 0.050 0.050 0.050 3.0 0.079 0.043 0.050 0.050 0.043 0.064 0.064 0.050 0.043 0.050 4.0 0.132 0.072 0.057 0.043 0.043 0.068 0.066 0.067 0.057 0.049 2 4.6 0.125 0.086 0.050 0.029 0.029 0.090 0.090 0.098 0.083 0.059 1.5 0.053 0.058 1.131 1.899 0.053 0.032 0.038 0.275 0.030 0.030 3.0 0.031 0.058 0.275 0.040 0.041 0.026 0.026 0.053 0.038 0.032 4.0 0.032 0.038 0.081 0.045 0.037 0.028 0.028 0.028 0.028 0.024 3 4.6 0.030 0.032 0.032 0.034 0.033 0.024 0.024 0.025 0.025 0.026 Y: distance across the width of the tunnel Roadway (m)
Z: distance across the height of the tunnel (m)
SOD indicates the level of smoke obscuration. The higher the value of SOD, the higher the smoke obscuration and the lower the visibility. The visibility, VIS, may be calculated from SOD as follows [Klote and Milke 2000]:
α K
VIS =− (1)
where:
α = extinction coefficient, m-1 = 2.303 SOD
K = proportionality constant, dimensionless (6 for illuminated signs, 2 for reflected signs and
building components in reflected light)
VIS = visibility, m.
The NFPA 502 defines the smoke obscuration levels that should be considered to maintaine a tenable environment for peroids of short duration. The smoke obscuration levels that are continously maintained below the point at which a sign illuminated at 80 lx (7.5 ft-candles) or equivalent brightness for internally luminated signs, is discrenible at 30 m (100 ft), and doors and walls that are discrenible at 10 m (33 ft).
The maximum ceiling temperature was approximately 50°C for Test 1 and 21°C for Test 2. The vertical temperature profiles at the fire locations were similar for the two tests. The maximum temperature was about 60oC measured at 0.4 m above the ground.
For both tests, the values of SOD were quite low upstream of the fire and the temperatures were at ambient temperature (about 20oC). These observations indicate that the EVS scenarios used in the tests created an airflow such that the hot smoke moved in the desired direction. That is, it moved from the South to the North in the traffic direction.
In general, close to the fire location, high SOD values were measured and as a result, the visibility was reduced. A few meters from the fire, the SOD decreased at lower tunnel height and the visibility was in the range of 12 m and higher. However, at locations further away from the fire, the SOD increased at lower elevations and the visibility was reduced especially during Test 2. Moreover, the reduced level of visibility extended, in the case of Test 2, further downstream of the fire location.
For Test 1, the smoke was pulled towards the ceiling (at the exhaust fans VE151 and VE153) and, therefore, lower values of the SOD were observed and good visibility was maintained up to the 3.0 m elevation.
There were differences in the behaviour of cold flow tests conducted in the tunnel (Kashef et al. 2003) and the hot smoke in the current set of tests. During cold smoke tests, it was noted that when the smoke source was located close to the exhaust fans (similar to Test 1), the rate of smoke removal was higher with almost no side dispersion of smoke. However, with hot smoke tests, smoke was dispersed laterally and the rate of smoke clearance was lower. This confirms that only hot smoke tests should be used to evaluate the performance of ventilation systems.
It was concluded from the measured values for Test 2 that the ventilation system helped to control the temperatures and produce a high airflow velocity in the middle of the tunnel. However, most of the smoke was extracted through the sidewall vents. The visibility was reduced at lower elevation downstream of the fire up to a distance of about 300 m. In addition, a dense layer of smoke was observed in the evacuation path limiting its use in this scenario. Moreover, it was observed that the smoke extracted through the side vents was recirculated into the other evacuation paths downstream of the exhaust fans.
NUMERICAL SIMULATIONS
CFD models solve the complex differential equations describing the conservation of mass, momentum, enthalpy, species, etc. within the physical domain of interest. The mass and momentum equations describe the fluid dynamics, the enthalpy equation, the heat transfer and the species concentrations equations, the transport of combustion products and unburnt fuel. These models simulate the overall fire environment for a specific fire scenario including ambient conditions prior to a fire. The CFD techniques solve the underlying equations of motion and conservation for the system of several thousand small elementary control volumes within the enclosure. The space and time dimensions are discretized into finite intervals and fluid variables (such as temperature, velocity, gas composition and pressure) and are computed at a finite number of locations at the grid points as a function of time. These variables are connected with each other through algebraic equations derived from their partial differential counterparts by integration over control volumes using the finite difference technique.
A major difference between CFD models is how the viscosity used in the momentum equation is calculated. The majority of CFD models, e.g. k-ε models (Wilcox 1993), use turbulence models to approximate the turbulent energy and dissipation produced by the fire. This approach results in a
steady-state solution to an averaged version of the flow equations. An example of the CFD models that use turbulence models is SOLVENT.
On the other hand, the Large Eddy Simulation (LES) (McGrattan 2000) approach solves the large scales of motion and models the small scales that are assumed to be universal. The LES approach results in an unsteady solution to the Navier-Stockes equations. Because real turbulent flow situations are inherently unsteady, LES methods can have an advantage in modelling turbulent fire-induced flows.
FDS (McGrattan 2000), a CFD model that is based on the LES approach, solves a form of high speed filtered Navier-Stocks equations valid for low-speed buoyancy driven flow. These equations are discretized in space using second order central differences and in time using explicit, second order, predictor-corrector scheme.
The current research study employs both FDS and SOLVENT to model the fire-induced flows in road tunnels and to compare their predictions with the on-site experiments. Based on the comparisons, one model will be selected for the rest of the study. The following sections present brief descriptions of the main features of each model.
FDS
FDS solves, numerically, a form of the Navier-Stokes equations appropriate for a low-speed, thermally-driven (buoyant) flow with an emphasis on smoke and heat transport from fires. The equations allow for large variations in density but not pressure. Most of the applications of the model have been for design of smoke handling systems, sprinkler/detector activation studies, and residential and industrial fire reconstructions.
SOLVENT
SOLVENT was developed as a tunnel ventilation model that can simulate the interactive effects of a tunnel fire and the ventilation system to determine unsafe regions in the tunnel. The model is applicable to different ventilation modes, including longitudinal ventilation using jet fans, transverse ventilation and natural ventilation.
SOLVENT is based on the general-purpose CFD code COMPACT-3D (Innovative Research 1998). It employs the buoyancy-augmented k-ε model (Wilcox 1993) to represent the turbulent transport and includes component models for jet fans, ventilation galleries, fire, radiation heat transfer and smoke. The SIMPLER algorithm is used to calculate the pressure field. The algebraic equations are solved using the line-by-line TriDiagonal-Matrix Algorithm supplemented by a block-correction procedure.
The wall boundary is treated using the wall function approach. The fire is represented as a source of heat and mass. The model does not simulate the combustion process. Instead, the heat release rate, due to combustion, is prescribed as a volumetric heat source in a postulated fire region.
The boundary conditions at the tunnel portals can be specified as inflow/outflow boundaries or as "free" boundaries with known values of pressure, depending on the physical situation being modelled. At an inflow boundary, values of all variables are specified. At an outflow boundary, the diffusion flux is assumed to be zero and the normal velocity components are adjusted to ensure the overall conservation of mass. The model also has provisions for the introduction of entrance loss and differential pressures at the portals to represent wind effects.
Only the results of the simulations conducted employing SOLVENT are presented in the current paper. The following sections describe the CFD simulations conducted, using SOLVENT, to replicate the airflow and fire tests.
In the following sections, the word “bulk average” means the cross-sectional averages of a variable ( temperature, mass flow, pressure, etc.) calculated at each longitudinal cross-section. Whereas, the word “bulk” indicates the cross-sectional integrations of a variable.
Airflow Simulations: Geometry and Boundary Conditions
Only the North Roadway of the tunnel was simulated with a mesh consisting of 160,230 control volumes (545 x 21 x 14). The mesh was refined around the vents. The vents flows were adjusted to match the field-measured quantities.
CFD simulations were conducted to model the ventilation scenarios, namely: the main and secondary scenarios, in an effort to validate them against onsite flow measurements. Additional CFD simulations were conducted to examine the ability of other ventilation scenarios to clear smoke. The additional
scenarios included: the secondary scenario with fan VE253 also in supply mode (hereinafter referred to as “Scenario 3”); fan VA201 in supply mode and fans VE151, VE153, and VA103 in exhaust mode (hereinafter referred to as “Scenario 4”).
All simulations were conducted as a steady state simulation with constant air density (i.e., the energy equation was not solved – cold smoke case). Free boundaries, with the pressure equal to the static ambient pressure, were assumed at the north and south portals. A wall roughness of 0.003 was used to represent the roughness of the concrete wall surface.
Main Ventilation Scenario.
In the main ventilation scenario, fresh air was supplied through the sidewall vents of the galleries of fans VA103 and V201 and hot smoke and fire products were exhausted through the tunnel ceiling (fans VE151 and VE153).The behaviour of the airflow in the tunnel plays a major role in determining the longitudinal air velocity and, consequently, the ability of a ventilation configuration to clear the smoke and fire products. Figure 6 represents the general flow pattern in the tunnel for the main scenario. The airflow pattern is represented by streamlines of the velocity vector field. As depicted in Figure 6, the air supplied through the lower and upper side vents created regions of turbulent flow. Furthermore, the air from the larger upper vents was faster than that from the lower vents, which resulted in more air injected at the top of the tunnel. The air jets forced airflow downwards and created rotational movement of the air. As a result, only a small portion of the tunnel had a longitudinal airflow, near the two portals. These results are in agreement with the field observations that indicated low longitudinal air velocities in the middle section of the tunnel.
Figure 7 shows the bulk average flow for cross-sections along the tunnel length. The mass flow compared reasonably well with the measured results. The results indicated that there was a stagnant flow zone near the middle of the tunnel (at 708 m from the north portal).
Secondary Ventilation Scenario.
With the activation of ventilation fan VE251 in supply mode, there was a minimal modification to the flow field in the tunnel. Also, as in the case of the field measurements, the conditions at the middle of the tunnel were not significantly improved. Most of the flow supplied by VE251 was directed towards the south portal due to the relatively high positive pressure produced by fan VA201 that creates resistance to the flow at the middle of the tunnel.Figure 7 shows the bulk average flow for cross-sections along the tunnel length. Again, the values of mass flow were comparable to the measured data. With fan VE251 operating, the location of zero point velocity moved towards the fan to a location 809 m from the North portal versus 708 m for the main scenario. As a result, the mid-tunnel velocity was slightly increased.
Scenario 3.
With the activation of ventilation fan VE253 in supply mode, there was even more improvement of the airflow velocities in the mid-tunnel section.Figure 7 shows that most of the flow supplied by fans VE251 and VE253 was directed mainly towards the south portal and only a small amount was directed towards the middle of the tunnel. However, with both fans VE251 and VE253 operating in supply mode, the location of the zero point velocity moved further towards the south portal (920 m from the North portal).
Scenario 4.
For Scenario 4, the fans operated in the main scenario were activated. However, fan VA103 was activated in the exhaust mode rather than in the supply mode as in the main scenario.The bulk average flow shown in Figure 7 indicates a greatly modified flow field where the air speeds at mid-tunnel increased from almost zero (main scenario) to about 5.0 m/s providing improved smoke clearance. From Figure 7, it is observed that most of the smoke was extracted through the gallery of fan VA103. Therefore in this scenario, the VA103 gallery could not be used for evacuation purposes.
With fan VA103 operating in exhaust mode, there is a significant modification to the flow field in the tunnel. While the longitudinal air speed increased to more than 5 times that under the main scenario, the turbulent behaviour of the flow in the middle of the tunnel is still the dominant mode of transport. This scenario was further investigated to observe its effect on the rate of hot smoke clearance.
Summary of Airflow Simulations
To explore the efficiency of current EVS in clearing smoke, different ventilation scenarios were numerically tested with the main goal of increasing the mid-tunnel velocity. These scenarios involved activating fan VE253 in supply mode (Scenario 3), which further pushed the point of zero velocity towards the south portal allowing for an increase in the mid-tunnel velocity. Another scenario involved the activation of fan VA103 in exhaust mode (Scenario 4). This significantly increased the mid-tunnel velocity. However, in this case, the VA103 gallery cannot be used as an escape route as the evacuees will be exposed to smoke.
The field airflow measurements together with the results of the numerical simulations led to a better understanding of the EVS and alternative operating scenarios. This understanding, in turn, helped in the planning for the in-situ fire tests (fire source locations and possible ventilation scenarios).
Fire simulations: Geometry and Boundary Conditions
Only the North Roadway of the tunnel and its galleries (Figure 8) were simulated with a mesh consisting of 465,696 control volumes (539 x 36 x 24). The mesh was refined around the vents, exhaust fans, fire source and tunnel portals. Two simulations were conducted to represent the ventilation scenarios used for both fire tests (Figure 5). The two simulations were conducted as a steady state heat release variable density simulation. Smoke is assumed to represent the products of combustion. Smoke production rate was calculated as follows:
) s 1 ( m m fu smoke = & + & (2) Where: smoke
m& = smoke production rate
fu
m& = fuel consumption rate
s = the stiochiometric air/fuel ratio
The model represents the resulting smoke concentration in terms of mass fraction of smoke, MFS (kg smoke/kg air).
The fire was represented as a fluid region where mass, energy, and smoke sources were introduced. The model did not simulate the combustion process in the fire. A propane source, approximately, 2.0 m long, 1.5 m wide and 0.7 m high was used to simulate the experimental fire source. The fire source with a heat output of 2 MW was placed at a distance of 335 m and 687 m from the North portal for Tests 1 and 2, respectively.
Fans VA103 and VA201 were simulated as mass sources or sinks depending on the ventilation scenario. For Test 1, both fans were introduced as mass sources. In the ventilation scenario of Test 2, fan VA103 was represented as a mass sink. Free boundaries with the pressure equal to the static ambient pressure were assumed at the north and south portals. A wall roughness of 0.003 was assumed for the concrete wall surface.
Test 1 Ventilation Scenario.
The ventilation scenario of Test 1 created a similar airflow pattern to that observed for the main scenario (Figure 6). Fresh air was supplied by fans VA101 and VA201 through the glleries and entered the tunnel roadway through the side vents. Smoke and hot gases were exhausted through ceiling fans VE151 and VE153. Fresh air was also drawn through the North and South portals.Figure 9 shows the bulk average temperature rises (the fire-induced temperature – the ambient temperature, 20oC) along the tunnel roadway. Within a few meters upstream and downstream of the fire source, the temperatures were at ambient. The maximum temperature rise calculated was approximately 130oC at the fire site.
Figure 10 shows the bulk smoke fraction (kg smoke/kg air). The smoke produced at the fire location travels mainly downstream of the fire towards exhaust fans VE151 and VE153. Higher smoke concentrations were mainly located close to the fire. No smoke was observed in the galleries.
The main goal of the emergency ventilation system is to provide and maintain a smoke-free path for safe evacuation. This tunnel uses the galleries for evacuation purposes in the event of a fire. It is important, therefore, to maintain a differential pressure between the tunnel environment and the evacuation passage that will ensure a “smoke-free” escape route. Thus, the pressure inside the ventilation gallery should always be higher than that in the tunnel to force airflow from the gallery into the tunnel. Figure 11 shows the bulk average pressures across the tunnel roadway and evacuation paths (galleries). The results indicate that the bulk average pressure in the gallery is higher than the pressure in the roadway throughout the tunnel length except for a small region adjacent to the North portal. However, the air drawn into the evacuation path in this region was free of smoke. Under these conditions, it is expected that most parts of the evacuation path would be smoke-free.
Test 2 Ventilation Scenario.
The airflow pattern and the resulting bulk average flow for the Test 2 ventilation scenario is similar to that used for Scenario 4. The turbulent behaviour of the flow in the tunnel is still the dominant mode of smoke transport. The air speeds at mid-tunnel increased from almost zero (corresponding to Test 1) to more than 5.0 m/s.Most of the smoke was extracted through the gallery of fan VA103. Therefore, in this scenario, the VA103 gallery could not be used for evacuation purposes. The result also indicates that the smoke mainly moved downstream of the fire leaving half of the tunnel upstream of the fire “smoke-free” (Figure 10).
The strong turbulent nature of the airflow adversely affected the rate of smoke clearance as can be seen from Figure 10 where the smoke iso-surfaces covered half of the tunnel downstream of the fire. However, the bulk average smoke values for Test 2 were less than those in Test 1. The bulk smoke concentration in the galleries of VA103 was approximately 0.03 kg/kg.
The turbulent effects, together with the higher airflow speeds, resulted in lower bulk average temperatures, which were almost half the values observed in Test 1 at the fire location (Figure 9). This is in agreement with the measurements in the field tests.
Figure 12 shows the bulk average total pressures across the tunnel roadway and evacuation paths (galleries). The results indicate that the bulk average pressure in the gallery upstream of the fire is larger than the pressure in the roadway indicating that these evacuation paths would be smoke-free. On the other hand, in the gallery for ventilation fan VA103, the pressure was about ten times lower than the pressure in the roadway resulting in the smoke being exhausted by fan VA103. However, at a distance of approximately 200 m from the fire, the pressure in the gallery was higher than that in the adjacent roadway. As a result, the smoke in the gallery re-entered the roadway.
Comparisons.
Comparisons of numerical simulation results and field tests data of the two fire tests are presented in Tables 2 and 3.Table 2 presents the comparison of ceiling temperatures around the fire for the two tests. The maximum ceiling predicted temperature of about 50oC predicted for Test 1. The predicted temperatures for Test 2 were higher than the measured values. It is believed that this discrepancy is caused by the strong deflection of flames during the experiment as a result of higher longitudinal airflow speeds at the centre section of the tunnel.
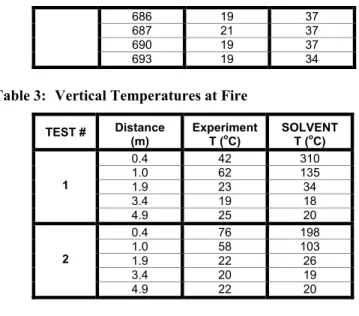
Table 3 presents the vertical centreline temperatures for both tests as predicted by SOLVENT and measured data. For Test 1 and up to a height of 2.0 m, SOLVENT predicted higher temperatures than for measured data. Above that height, there was a good comparison. The discrepancy between the predicted values and experimental data are mainly attributed to the idealization of the fire in the numerical analysis, where the fire source is modelled as a postulated volumetric heat source. During the experiments it was observed that the flames were deflected downstream of the fire by the longitudinal airflow. This pushed the higher flame temperatures downstream of the fire, away from the thermocouple tree. The vertical temperature comparisons for Test 2, show that the trend is similar to that observed for Test 1.
Table 2: Ceiling Temperatures at Longitudinal Distances from the North Portal
TEST # Distance (m) Experiment T (oC) SOLVENT T (oC) 329 37 24 331 24 24 332 34 41 334 50 44 335 25 41 338 40 28 1 341 19 19 681 21 29 683 19 29 2 684 20 36
686 19 37 687 21 37 690 19 37 693 19 34
Table 3: Vertical Temperatures at Fire
TEST # Distance (m) Experiment T (oC) SOLVENT T (oC) 0.4 42 310 1.0 62 135 1.9 23 34 3.4 19 18 1 4.9 25 20 0.4 76 198 1.0 58 103 1.9 22 26 3.4 20 19 2 4.9 22 20
CONCLUSIONS
The numerical simulations, using SOLVENT, qualitatively agree with the field measurements. The discrepancy between the predicted values and experimental data are believed to be mainly due to the modelling of the fire source as a volumetric heat source.
The results od the numerical simulations indicated that the current ventilation strategies for the two fire scenarios, close to the exhaust fans and at the middle of the tunnel, are efficient in clearing hot smoke and fire products from the tunnel.
No smoke was observed within the galleries of ventilation fans VA103 and VA201 during Test 1. The numerical simulation confirmed this observation by using the pressure differences between the roadway and the galleries.
The ventilation scenario associated with Test 2 involved the activation of fan VA103 in exhaust mode. This increased significantly the mid-tunnel velocity. However, in this case the VA103 gallery could not be used as an escape route as the evacuees would be exposed to smoke. Moreover, it was observed during the field measurements that the smoke extracted through the side vents into the gallery of fan VA103 was recirculated into the other galleries downstream of exhaust fans VE151 and VE153 preventing its use as an evacuation path.
The air velocity in the evacuation passage was 14 m/s with VA103 at maximum capacity. It might be difficult to walk against such a high airflow during evacuation. Lower velocities (11 m/s) should be used to facilitate movement in the evacuation passage (Cheung 2003).
It should be noted that the rate of smoke production for the field tests and the numerical simulation may differ. In the numerical simulations, the rate of smoke production was a function of the fuel consumption and the stoichiometric ratio (Eq. 2). Whereas, an extra source of smoke was introduced during the tests (four smoke bombs/min) for better visualization. For more meaningful quantitative comparisons between the numerical and experimental data, the extra quantity of smoke produced by the smoke bombs should be included in the simulations. However, the current qualitative comparisons are favorable.
REFERENCES
NFPA 502 2001. Standard for Road Tunnels, Bridges, and Other Limited Access Highways. NFPA, 1 Batterymarch Park, PO Box 9101, Quincy, MA 02269-9101, USA.
Lacroix, D. 1998. The New PIARC Report on Fire and Smoke Control in Road Tunnels. Third International Conference on Safety in Road and Rail Tunnels, Nice, France, p. 185-97.
Heselden, A J M. 1976. Studies of fire and smoke behaviour relevant to tunnels. Proc. Second International Symposium on the Aerodynamics and Ventilation of Vehicle Tunnels, Cambridge, BHRA, paper J1. Innovative Research, Inc./Parsons Brinkerhoff, Inc. 2000. SOLVENT Version 1.0, Innovative Research,
McGrattan, K.B., Baum, H.R. Rehm, R.G., Hamins, A. and Forney, G.P. 2000. Fire Dynamics Simulator – Technical Reference Guide. NISTIR 6467, National Institute of Standards and Technology, Gaithersburg, MD.
Kashef, A.; Bénichou, N.; Lougheed, G.D.; Debs, A. 2003. Numerical modelling of air movement in road tunnels. CFD 2003, the Eleventh Annual Conference of the Computational Fluid Dynamics, Society of Canada (Vancouver, B.C. 2003-05-28), pp. 23-30.
Kashef, A.; Bénichou, N.; Lougheed, G.D.; Debs, A. 2003. CFD simulation of in-situ airflow measurements in road tunnels. 5th International Conference Safety in Road and Rail Tunnels (Marseilles, France), pp. 609-618.
Kashef, A.; Bénichou, N.; Lougheed, G.D.; Debs, A. 2004. Application ff CFD Techniques for Modelling Fire in Road Tunnels. CFD 2004, the Twelfth Annual Conference of the Computational Fluid Dynamics, Society of Canada (Ottawa, ON).
Klote, J., and Milke, J. 2000. Principles of Smoke management. ASHRAE, Inc., 1791 Tullie Circle NE, Atlanta, GA 30329.
Innovative Research 1998 .Reference Manual for COMPACT-3D. Innovative Research, Inc., Minneapolis. Wilcox, D.C. 1993. Turbulence Modeling of CFD. DCW Industries, Inc., California 91011.
Cheung, Emil, Chan, Wilson, and Man, Richard 2003. Ventilation Scheme using Saccardo Nozzles. Tunnel Management International, 5th International Conference, Safety in Road and Rail Tunnels, Volume 6, Number 1.