Open Archive TOULOUSE Archive Ouverte (OATAO)
OATAO is an open access repository that collects the work of Toulouse researchers and
makes it freely available over the web where possible.
This is an author-deposited version published in :
http://oatao.univ-toulouse.fr/
Eprints ID : 11329
To link to this article :
DOI:10.1016/j.jnoncrysol.2014.03.016
URL :
http://dx.doi.org/10.1016/j.jnoncrysol.2014.03.016
To cite this version :
Quiroga Cortes, Luis and Lonjon, Antoine and Dantras, Eric and
Lacabanne, Colette High-performance thermoplastic composites
poly(ether ketone ketone)/silver nanowires: Morphological,
mechanical and electrical properties. (2014) Journal of
Non-Crystalline Solids, vol. 391 . pp. 106-111. ISSN 0022-3093
Any correspondance concerning this service should be sent to the repository
administrator:
[email protected]
High-performance thermoplastic composites poly(ether ketone ketone)/
silver nanowires: Morphological, mechanical and electrical properties
Luis Quiroga Cortes, Antoine Lonjon
⁎
, Eric Dantras, Colette Lacabanne
Physique des Polymères, Institut Carnot CIRIMAT, Université Paul Sabatier, Toulouse 31062, France
a b s t r a c t
Keywords: Nanowires; PEKK; Composites; Conductivity; Mechanical propertiesHigh-performance conductive thermoplastic composites poly(ether ketone ketone) (PEKK)/silver nanowires were elaborated by melt blending. Silver nanowires (AgNWs) with high aspect ratio (ξ~220) were elaborated through the polyol process in presence of poly(vinyl pyrrolidone) (PVP) and ethylene glycol. Scanning electron microscopy observations of nanowires were performed after an adapted cleaning process. The dispersion of NWs in the polymeric matrix was evaluated. A very low percolation threshold of 0.6 vol% was obtained. Electrical conductivity values obtained above the percolation threshold were among the highest measured for low-filled conductive polymer composites. The influence of AgNWs on the PEKK matrix has been investigated by differential scanning calorimetry and dynamic mechanical analyses. It is important to note that thermal and dynamic mechanical performances of the polymeric matrix were preserved in composites.
1. Introduction
Polymer composites increased their popularity in aerospace industry for their remarkable mechanical properties and low weight. Carbon fibers have a good electrical conductivity but the epoxy matrix is an insulator and reduces drastically the final electrical conductivity of the composite material. The lightning can strike sta-tistically once or twice a year a commercial plane and consequences could be hazardous for composite structures and on-board electron-ics[1,2]. It is necessary for composite structures to mitigate the effects of lightning strikes and electrostatic accumulation. Some technological solutions have been proposed to enhance the electrical conductivity of epoxy based composites parts as metal mesh placed on composites surface parts[3]. The introduction of conductive particles sounds a promising route to improve the electrical conduc-tivity of composite structures[1,4–7]. Nowadays, there is a great interest in thermoplastic polymer matrix due to high mechanical strength, high resilience and processability. The high-performance thermoplastic poly(aryl ether ketone) (PAEK) and in particular poly(ether ketone ketone) (PEKK), provides appropriate mechani-cal, chemical and thermal properties for aeronautical applications
[8–12]. The rate of filler necessary to obtain conductive composites is directly linked to the aspect ratio ξ (ratio between length to width) of conductive particles[13,14]. The filler fraction required to generate infinite continuous conductive path through a material is called the percolation threshold. Low values of percolation threshold ensure the preservation of mechanical properties of the matrix with
minimal weight increase. Previous works of conductive composites filled with CNTs exhibit a percolation threshold values near to 0.1–1 wt% with an electrical conductivity around 10−1
–10−2 S ⋅m−1
[15–17]above the percolation threshold. This level of conductivity is relatively close to carbon fiber based composites and too low for aeronautical applications. In order to increase electrical conductivity, filler particles need to have higher intrinsic conductivity. Metallic nanowires with high aspect ratio are an excellent candidate to obtain conductive polymer composites [18–20]. Thermoplastic/metallic nanowires composites provide materials with high conductivity values (102S ⋅ m−1
) for a low content of filler (≤ 5 vol%)[6,19,21, 22]. Lonjon et al. have shown the importance to introduce nanowires without oxidative layer on their surface. Conductive polymer com-posites realized with silver nanowires[18,22,23]provide the best compromise to prevent oxidative surface layer and exhibit higher conductivity with an acceptable weight increasing. Xia[24] and Sun[25]have described a polyol process where AgWs with high aspect ratio can be elaborated in large scale by using AgNO3as precursor
and PVP as capping agent in ethylene glycol.
PEKK is a high-performance thermoplastic from the PAEK family. It is a semi-crystalline aromatic polymer with high temperature sta-bility, good chemical resistance and excellent mechanical properties. Its high glass transition temperature Tg(~ 160 °C) and high melting
point Tm(~ 330 °C to 360 °C) are compatible with aeronautical
spec-ifications of the PAEK group[8–10]. PEKK KEPSTAN 6003 has a lower melting temperature (~ 303 °C) while keeping a high value of Tg.
This slight lower Tmmay facilitate composites processing. Some
works of PEKK reinforced composites had studied crystallization behavior and mechanical properties of PEKK/CF and PEKK/mica composites[8,11,26–28]. The composites properties strongly depend ⁎ Corresponding author.
E-mail address:[email protected](A. Lonjon).
on the quality of dispersion of nanowires. This work exposes a new re-liable method to elaborate low-filled conductive PEKK nanocomposites with good dispersion quality. Several methods have been developed to prepare metallic nanowires/polymer composites in order to enhance dispersion. Solvent way provides the best dispersion of high aspect ratio particles. Unfortunately, it cannot be used with PEKK due to his high solvent resistance. The melt blending method was chosen in this study. However, in twin-screw extrusion, the nanowires with high aspect ratio may be damaged by the shear stress as presented by Lin
[20]and Lonjon et al.[22]. The aim of this study is to obtain a new high-performance thermoplastic conductive composites with a low rate of filler. The best way to achieve a low rate of filler is to preserve the aspect ratio of the nanowires in homogenous dispersion using a mixing process at high temperature.
We have prepared the nanocomposites by simple melt compounding method without mechanical melt mixing. We report our results about the dependencies of electrical conductivity and percolation threshold on the Ag NWs. The influence on the thermal and dynamic mechanical properties of metallic nanowires on PEKK polymer matrix was studied by differential scanning calorimetry (DSC) and dynamical mechanical analysis (DMA).
2. Experimental section
2.1. Nanowires and nanocomposites elaboration
Silver nanowires were synthesized by reducing AgNO3with
ethyl-ene glycol in the presence of poly(vinyl pyrrolidone) (Mw= 55 000)
through the polyol process. All chemical solutions were purchased from Sigma Aldrich. They were used without further purification. The reaction was carried out at 160 °C in a round-bottom balloon for 1 h. Stirring rate was 400 rpm. This technique and the involved chemical re-actants were described by Sun et al.[25]. Only few variations in solution concentrations were made. PVP/AgNO3initial ratio was increased to
3.51 compared with previous work[22]. Sun et al.[29]and Wiley et al.[30]have established hypotheses of Ag NWs growing through this process. Growing process implies a favored reaction between [100] planes of silver multiply twined-particles and PVP. After the process reaction, silver nanowires were cleaned and separated of Ag particles by centrifugation during 2 min at 2000 rpm several times. Clean silver nanowires were stored in ethanol and dispersed using an ultrasonic bath for short time. The polyol process allows silver nano-wires gram scale synthesis required to prepare conductive polymer composites. After the cleaning process, the yield reaction was evaluated at 70 %.
PEKK KEPSTAN 6003 was supplied by Arkema France in powder form (20 μm) (Mw= 25000). Composites were processed by melt
blending without mechanical mixing. PEKK powder was mixed with clean silver nanowires previously dispersed in ethanol solution. The mixture was sonicated in order to promote the dispersion and then evaporated in a rotary evaporator at 80 °C. The volume fraction p of Ag NWs was ranging from to 0 to 5 vol%. The mixture obtained after evaporation was melted at 340 °C during 15 min. After slow cooling of about 10 °C.min−1, the bulk material obtained was cut
into very small pellets and pressed again to obtain the samples, at 340 °C during 15 min at a pressure of 3 MPa, for the DSC, DMA and conductivity measurements.
The volume fraction of AgNWs was determined by density mea-surements from the following mixture law: dcomposite= (1 − φ)
dPEKK+ φdAgNWswhere dPEKK= 1.3, dAgNWs= 10.5 and φ is the
volume ratio ranging from 0 to 5 %. 2.2. Scanning electron microscopy (SEM)
SEM analysis was carried out on a JEOL JSM 6700F instrument. Images were collected under 10 keV accelerating voltage. Nanowires
images were obtained using the secondary electron detection mode. Nanocomposites images were obtained using backscattered electron mode in order to enhance the contrast between organic matrix and me-tallic nanowires. Ag NWs were well dispersed in ethanol suspension and deposited on an SEM pin.
2.3. Differential scanning calorimetry (DSC)
Differential scanning calorimetry measurements were performed using a calorimeter 2920 from Thermal Analysis instrument. The samples weight varied from 5 to 15 mg. They were first heated in the DSC at 370 °C in order to erase the thermal history of the polymer. The cooling rate was 10 °C.min−1. The second heating was considered
for data analysis. The scanning rate was 10 °C.min−1and the
tempera-ture range 30 °C to 350 °C. The crystallinity Xcof a polymer can be
estimated with χc¼
ΔHm‐ΔHcc
ΔH100%
" 100 ð1Þ
with ∆Hmmelting enthalpy, ∆Hcccold crystallization enthalpy and
∆H100melting enthalpy of the theoretical 100 % crystalline polymer.
2.4. Dynamic mechanical analysis (DMA)
The dynamic mechanical properties of PEKK/Ag NWs composites were determined using an ARES strain control rheometer from Thermal Analysis instruments in the torsion rectangular mode. Dynamic mechanical storage modulus and loss modulus G′ and G″ of PEKK and PEKK/Ag composites were recorded as a function of temperature. The scanning rate was 3 °C.min−1between −125 °C and 165 °C. Test
were carried out over the linear elasticity range with ω = 1 rad ⋅s−1
(angular frequency) and γ = 10−1% (strain). Test samples were
parallelepiped with length between 35 and 40 mm, 10 mm width and thickness between 0.6 and 0.7 mm. Samples preparation was described earlier.
2.5. Electrical conductivity
For conductivity measurements, samples were prepared at 340 °C in disc form with 20 mm diameter and 1 mm thick. They were coated with silver paint to ensure good electrical contact with electrodes.
- Low electrical conductivity values
The electrical conductivity measurements were carried out with the Novocontrol broadband spectrometer by recording the complex conductivity σ*(ω). Measurements were performed at room temperature, covering a frequency range of 10−2
–106Hz. The
real part σ′(ω) of the complex conductivity σ*(ω) was recorded. The value of σ′(ω) at 10−2Hz was taken as dc conductivity σ
dc
according to Barrau[16].
- High electrical conductivity values
The conductivity value reach above the percolation threshold was measured by four-point probe technique. The conductivity of nanocomposites cylinders was obtained with a Keithley 2420 SourceMeter in a four-point probe configuration.
In the percolation zone, the data were fitted by a power law where the evolution of conductivity is defined by four parameters
[31,32]: σ¼ σ0ðp‐pcÞ
t
ð2Þ where σ0is a constant, p is the Ag NWs volume fraction, pcis the
Ag NWs volume fraction at the percolation threshold and t is the critical exponent depending on the network dimensionality d; t = 1.1–1.3 for d = 2 and t = 1.6–2 for d = 3.
Error bars were estimated for DSC, DMA and dc conductivity measurements with two different samples elaborated with the same volume fraction.
3. Results and discussion
3.1. Morphology of nanowires and nanocomposites
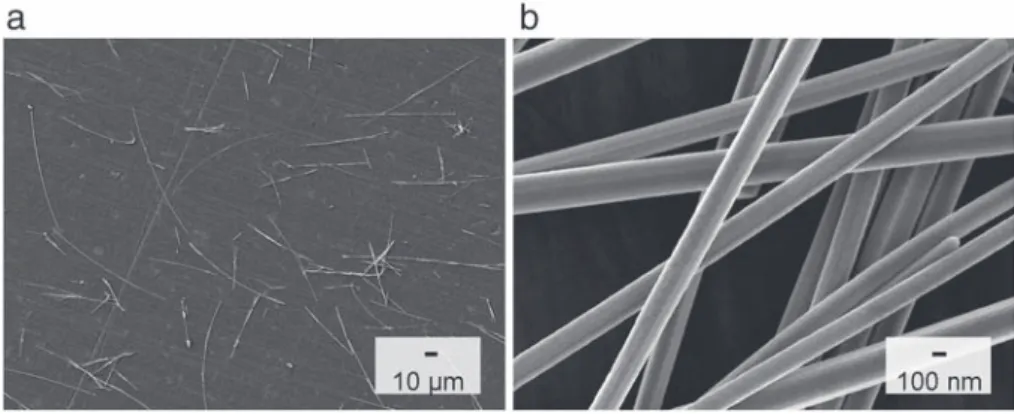
The morphology and dimensions of Ag NWs were studied by SEM. Dispersed clean Ag NWs in ethanol are shown inFigs. 1a and1b. No bundles or damage induced by sonication treatment were observed. AgNWs width ranged from 120 to 400 nm and length from 10 to 100 μm. Statistical distribution of diameters and lengths has been established to estimate the average aspect ratio of the NWs,Fig. 2. Data were extracted from hundred NWs. The mean aspect ratio deduced was LengthAgNWs
DiameterAgNWs¼
40000
180 ¼ 222. Intrinsic dc conductivity of a
single Ag NW prepared by the polyol process was measured in a pre-vious work by Sun et al.[25](0.8 × 107S ⋅m−1), close to the dc
con-ductivity of bulk Ag at room temperature (6.3 × 10⁷ S ⋅m−1).
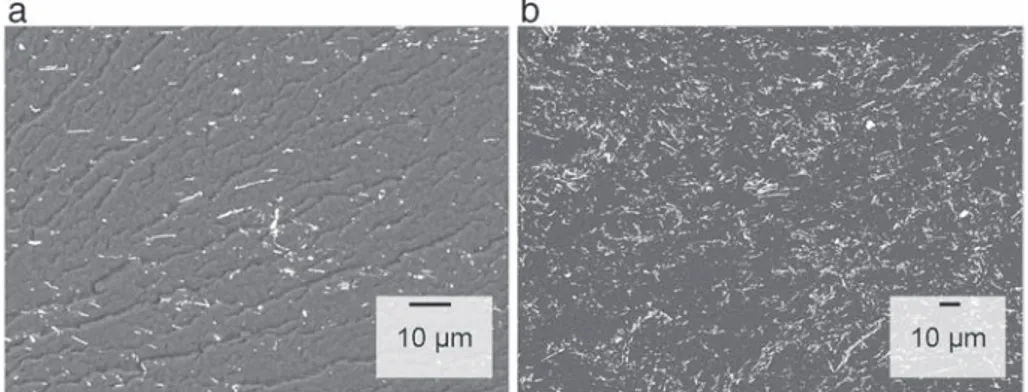
Distribution of nanowires within PEKK was studied by SEM with backscattered electron detection mode. SEM images were taken from cryo-cutted samples. The PEKK composites filled with 0.8 vol% and 3 vol% are observed onFigs. 3a and b. The bright areas in the backscattered micrographs show the nanowires dispersed in the polymer matrix. These observations confirm a homogeneous dispersion of NWs in the polymer matrix. Singles nanowires were observed. We note the presence of some bundles constituted by small aggregates of NWs with a diameter around 2 μm. Preserving the high aspect ratio of nanowires within the polymer matrix is essential to achieve a low percolation threshold.
3.2. Physical structure of the polymeric matrix
Fig. 4shows the DSC curves of PEKK KEPSTAN 6003. The scan was recorded during the second heating as described in the experimental section. PEKK has a high glass transition of Tg= 156.7 °C. The broad
exothermic peak indicates a cold crystallization at Tcc= 241 °C
(ΔHcc≈ 14.12 J.g−1). The endothermic peak indicates the melting at Tm = 300 °C (ΔHm≈16.20 J.g
−1). Data were compared with
literature where the melting temperature of PEKK was reported around 330–360 °C and the glass transition near to 153–165 °C
[8,10,33]. PEKK KEPSTAN 6003 has a lower melting temperature due to the incorporation of isophthaloyl moieties in the chain. Indeed, isophthaloyl moieties in the linear chain of PEKK create symmetry and entropy defects in the unit cell as described by Gardner et al.[33]decreasing the values of both glass transition and melting temperatures. The melting temperature decrease is
an advantage for composites processing. According with Chang et al.[9], the heat melting of PEKK (ΔH100%) considered as 100%
crystalline is approximately 130 J.g−1. The crystallinity ratio has been determined with Eq. (1) at χc(PEKKKEPSTAN6003) = 1.6%.
With such a low value, PEKK KEPSTAN 6003 is considered as a quasi amorphous polymer. Thermograms of nanocomposites filled from 0.6 vol% to 5 vol% are shown onFig. 4. The glass transition temperature Tg, the cold crystallization temperature Tccand the
melting point Tmare not affected by the presence of silver nanowires.
The cold crystallization is only affected by the volume fraction of silver nanowires and exhibits a slight decrease of ΔHcc(Fig. 5). The NWs
hinder the cold crystallization process of the polymer. This evolution can be explained by considering that this mechanism takes place in the rigid amorphous phase existing in polymers with rigid chains like polycarbonate[34]and of course poly(aryl ether ketone)s[35]. Ag NWs are spread out in the mobile but also in the rigid amorphous phase hindering the cold crystallization mechanism. However, the melting process remains constant for an increase of nanowires content,
Fig. 5. This phenomena indicates an increase of crystallinity, observed in
Fig. 6. The AgNWs act as nucleating agent in PEKK. Previous studies have suggested the role of nucleating agent of the filler in the increasing of crystallization[36,37].
3.3. Dynamic mechanical relaxation
The dynamic mechanical properties of PEKK and PEKK/AgNWs composites are representedFig. 7. Measurements were realized in the torsion rectangular mode. The storage modulus G′ was observed versus temperature. A step located at Tαcan be observed in the glass transition
region between 140 °C and 160 °C. This corresponds to the viscoelastic transition relaxation associated with the glass transition of the polymer-ic matrix. On the vitreous plateau, the storage modulus G′ of nanocom-posites increases with the incorporation of AgNWs until 2 vol%. The modulus G′ is strongly dependent upon the filler content. The presence of Ag NWs induces a stiffening of the polymer matrix. This increase of G′ modulus is ascribed to an effective load transfer from the matrix to the filler. This classical behavior has been reported also for PEKK/mica[27, 28]and PEEK/CNTs composites[38]. To highlight the evolution of the modulus with the increase of Ag NWs volume fraction, the G′ values of composites were studied as function of the AgNWs volume fraction and normalized to the G′ value of the pure PEKK, insert onFig. 7. The values of G′ were taken at Tg-55 °C. Composites filled at 3 and 5 vol%
exhibit a non linear behavior of the increase of G′ modulus rather than composites filled at 0.5, 1 and 2 vol%,Fig. 7. For higher content of NWs, G′ decreases. This phenomenon could be ascribed to the presence of small aggregates observed by SEM. This result has been observed by Lonjon et al.[22], Diez-Pascual et al.[38]and Sender et al.[39], where a non linear evolution with the content of filler was ascribed
to aggregates of CNT, limiting the interfacial area for load transfer from the matrix to the filler.
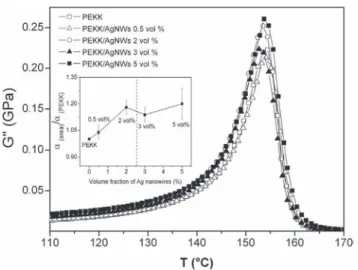
Fig. 8shows the temperature variation of the loss modulus G″ of PEKK/ AgNWs composites between 130 °C and 170 °C, in the α relax-ation region. As observed on DSC thermograms for Tg, the filler
con-tent does not affect Tα. However, a slight broadening of the α mode
with the filler content is observed. The evolution of the peak area of the α mode of composites was compared to peak area of the ma-trix for each volume fraction of AgNWs insert onFig. 8. A slight increase around 1.2 factor is observed. This could be ascribed to the heterogeneity of amorphous phase due to the presence of the NWs content. Similar behavior was observed by Lonjon et al.[40]
in P(VDF-TrFE)/nickel nanowires conductive composites. The peak area could be directed linked to the dissipation energy. The widening
of the α mode could be associated to energy losses from polymer/filler interfaces as suggested by Capsal et al.[41]. Moreover, this behavior can be ascribed to an improvement in the anelastic damping ability of the composites. However, the α peak area increase has to be consid-erate with the concomitant increase of the storage modulus G′. The be-havior is not linear for higher content filler due to the presence of small aggregates.
3.4. Electrical percolation
The electrical conductivity of PEKK and PEKK/Ag NWs nanocompos-ites was plotted at room temperature versus volume fraction,Fig. 9. PEKK dc conductivity is close to 10−12S⋅m−1. The dc conductivity
in-creases drastically by 14 decades from 10−12to 102S ⋅m−1between
unloaded PEKK and 5 vol% loaded composite; the values are listed in Fig. 2. AgNWs lengths and diameters from SEM statistical analysis.
Fig. 3. (a, b) SEM images of the fracture surface of PEKK/AgNWs composites at 0.8 vol% and 3 vol%.
Fig. 4. Non isothermal DSC scans at a rate of 10 °C.min−1for PEKK/AgNWs with different AgNWs contents.
Fig. 5. Evolution ofΔHccand ΔHmvalues measured by DSC of PEKK/AgNWs composites versus the AgNWs volume fraction (vol%). Dotted lines are a guide for the eyes.
Table 1. The experimental data above the percolation threshold were fitted with the percolation law Eq.(2)and with a linear function, insert inFig. 9. As seen isFig. 9, the significant variation of dc conductivity indicates the electrical percolation of the composites. Experimental results are in agreement with theoretical law. Best fitted values were pc= 0.59 vol%, σ0= 0.2 × 10⁶S⋅m−1and t = 2.06 ± 0.26. The critical
exponent t value is in the range of the universal value for three dimensional percolation systems, which is equal to 1.94. Lonjon et al.[6]obtained 1.57 with metallic NWs, and Carponcin et al.[15]
obtained t = 2.46 with CNTs. The conductivity values obtained above the percolation threshold are higher than those measured for polymer nanocomposites (~ 20 S ⋅m−1
) filled with Ag and Cu nanowires performed by solvent way and melt mixing[21,42]. However, results are in accordance with measured values obtained with almost the same type of NWs in other matrix by Lonjon et al.
[6,19,22,23]. The percolation threshold fitted (0.59 vol%) is very low in comparison with values measured in literature. Pcis largely
lower than for dispersed silver particles (pc= 12 vol%)[23]and for
copper particles (pc=10 vol%)[42,43]but closer to values with good
dispersion achieved[22]. The difference with metallic particles highlights the role of aspect ratio of silver nanowires. A high aspect ratio is effectively required to achieve low volume fraction percolation
threshold as mentioned by Balberg et al.[44]. The percolation model in a three-dimensional stick system, proposed by Balberg et al.[44], shows that the percolation threshold is directly linked to the aspect ratio and the anisotropy of sticks through their excluded volume Vex.
In this case, the nanowires are good candidates to illustrate capped cylinders with L/r N N 1, and the associated critical excluded volume could be expressed by:
Vcrex¼L
rVNWNc¼
L
rfc¼ 1:6 % 0:2 ð3Þ
where VNWis the nanowire volume, and Ncand fcare the silver
nano-wire critical concentration and critical volume fraction for percolation. According to Eq.(3), the theoretical aspect ratio calculated for AgNWs dispersed in the polymer matrix with pc = 0.59 is Lr¼ 271 % 33.
This value is coherent with the aspect ratio deduced from the SEM observations inFig. 1.
This study proposes an effective method to prepare nanocomposites with homogenous dispersion where the high aspect ratio of Ag NWs is preserved despite the presence of few aggregates. Above the percolation threshold, the dc conductivity of nanocomposites reaches 102S ⋅m−1. This value is in the range of dc conductivity for
Fig. 6. Crystallinity evolution χcof PEKK/AgNWs composites versus the AgNWs volume fraction (vol%). Values were determined with Eq.(1). The dotted line is a guide for the eyes.
Fig. 7. Storage modulus G′ versus temperature at 1 rad⋅ s−1for the PEKK/AgNWs composites with different AgNWs contents. The insert shows the variation of G′PEKK/AgNWs/G′PEKKat Tg-55 °C.
Fig. 8. Loss modulus G″ versus temperature at 1 rad⋅s−1for the PEKK/AgNWs composites with different AgNWs content. The insert shows the variation α(PEKK/AgNWs)area/α(PEKK)area.
Fig. 9. DC conductivity (σdc) versus the silver nanowires volume fraction, p, at 25 °C, for the PEKK/AgNWs composites. (□) Conductivity measurements measured by DDS and (■) conductivity measurements obtained by four-point probe technique. (–) corresponds to the best fitted line of the Percolation law. The insert shows the variation of log σdcversus log(p-pc) with the linear fit of data.
well-dispersed metallic particles systems according to literature[19, 23,43,45]. Optimal dispersion is achieved under 4% vol regardless of the small aggregates formation observed in SEM. Conductivity values obtained are in accordance with the level of electrical conductivity targeted for EM shielding[5].
4. Conclusion
PEKK/Ag NWs composites with various silver nanowires contents were prepared and characterized with complementary techniques. Silver nanowires with high aspect ratio have been elaborated by the polyol process in large scale with high yield. Composites have been successfully prepared by simple melt blending without mechanical shear stress. Homogenous dispersion has been achieved: SEM observa-tions show homogenous distribution within the matrix. The high aspect ratio of AgNWs permits to reach a very low electrical percolation threshold (0.59 vol%). The high level of conductivity (~ 102S ⋅m−1)
reached above the percolation threshold is comparable with homoge-neous dispersed composites elaborated by solvent way. The SEM obser-vations of composites and the very low value of pcare evidences of the
good dispersion and maintenance of the AgNW high aspect ratio. DSC analyses have not revealed any significant evolution of glass transition, melting or cold crystallization temperatures. Slight modifications of the crystallization phenomena have been revealed by a weak increase of crystallization rate with AgNWs volume fraction. The AgNWs act as nucleating agent on the crystallization process of the PEKK. DMA exper-iments indicate a linear increase of G′ for very low filled composites. At higher concentration, a non-linear behavior has been observed due to the presence of small aggregates observed by SEM. It is important to note that the mechanical performances of the matrix were preserved. A slight increase of the magnitude of the α relaxation suggests an improvement of anelastic damping.
Acknowledgments
This work was supported by DGCIS and Conseil Régional de la Région Midi-Pyrénées in the framework of the COSMIC program. The authors greatly acknowledge Arkema for providing well characterized PEKK. References
[1] G. Gardiner, High Perform. Compos. (2006) 44–49.
[2] J.A. Plumer, J.D. Robb, IEEE Trans. Electromagn. Compat. 24 (1982) 158–172.
[3] W.Y. Ng, B. Ploss, H.L.W. Chan, F.G. Shin, C.L. Choy, 12th IEEE International Sympo-sium on Applications of Ferroelectrics (ISAF 2000) (2001) 767–770.
[4] A. Lonjon, P. Demont, E. Dantras, C. Lacabanne, J. Non-Cryst. Solids 358 (2012) 1859–1862.
[5] M. Kilbride, R.A. Pethrick, Proc. Inst. Mech. Eng. L J. Mater. Des. Appl. 226 (2012) 252–264.
[6] A. Lonjon, L. Laffont, P. Demont, E. Dantras, C. Lacabanne, J. Phys. Chem. 113 (2009) 12002–12006.
[7] R.K. Goyal, S.D. Samant, A.K. Thakar, A. Kadam, J. Phys. D-Appl. Phys. 43 (2010).
[8] I.Y. Chang, SAMPE Q. 19 (1988) 29–34.
[9] I.Y. Chang, B.S. Hsiao, 36th Int. SAMPE symp, 1991, pp. 1587–1601.
[10] R.L. Mazur, E.C. Botelho, M.L. Costa, M.C. Rezende, Polim. Cienc. Tecnol. 18 (2008) 237–243.
[11] J.-M. Bai, D. Leach, J. Pratte, JEC Compos. 15 (2005) 64–66.
[12] L.A. Pilato, M.J. Michno, Advanced Composite Materials, Springer-Verlag, Heildelberg, 1994.
[13] V. Favier, R. Dendievel, G. Canova, J.Y. Cavaille, P. Gilormini, Acta Mater. 45 (1997) 1557–1565.
[14] J. Li, P.C. Ma, W.S. Chow, C.K. To, B.Z. Tang, J.-K. Kim, Adv. Funct. Mater. 17 (2007) 3207–3215.
[15] D. Carponcin, E. Dantras, G. Aridon, F. Levallois, L. Cadiergues, C. Lacabanne, Compos. Sci. Technol. 72 (2012) 515–520.
[16] S. Barrau, P. Demont, A. Peigney, C. Laurent, C. Lacabanne, Macromolecules 36 (2003) 5187–5194.
[17] W. Bauhofer, J.Z. Kovacs, Compos. Sci. Technol. 69 (2009) 1486–1498.
[18] I. Moreno, N. Navascues, S. Irusta, J. Santamaria, Int. Conf. Struct. Nano Compos. 40 (2012) 012001.
[19] A. Lonjon, L. Laffont, P. Demont, E. Dantras, C. Lacabanne, J. Phys. D Appl. Phys. 43 (2010) 345401.
[20] B. Lin, G.A. Gelves, J.A. Haber, P. Poetschke, U. Sundararaj, Macromol. Mater. Eng. 293 (2008) 631–640.
[21] G.A. Gelves, B. Lin, U. Sundararaj, J.A. Haber, Adv. Funct. Mater. 16 (2006) 2423–2430.
[22] A. Lonjon, I. Caffrey, P. Demont, E. Dantras, C. Lacabanne, J. Non-Cryst. Solids 376 (2013) 199–204.
[23] A. Lonjon, P. Demont, E. Dantras, C. Lacabanne, J. Non-Cryst. Solids 358 (2012) 3074–3078.
[24] Y.N. Xia, P.D. Yang, Y.G. Sun, Y.Y. Wu, B. Mayers, B. Gates, Y.D. Yin, F. Kim, Y.Q. Yan, Adv. Mater. 15 (2003) 353–389.
[25] Y.G. Sun, Y.D. Yin, B.T. Mayers, T. Herricks, Y.N. Xia, Chem. Mater. 14 (2002) 4736–4745.
[26] B.S. Hsiao, I.Y. Chang, B.B. Sauer, Polymer 32 (1991) 2799–2805.
[27] D.J. Gan, S.Q. Lu, C.S. Song, Z.J. Wang, Macromol. Mater. Eng. 286 (2001) 296–301.
[28] D.J. Gan, S.Q. Lu, C.S. Song, Z.J. Wang, Mater. Lett. 48 (2001) 299–302.
[29] Y.G. Sun, B. Mayers, T. Herricks, Y.N. Xia, Nano Lett. 3 (2003) 955–960.
[30] B. Wiley, Y.G. Sun, Y. Xia, Acc. Chem. Res. 40 (2007) 1067–1076.
[31] S. Kirkpatrick, Rev. Mod. Phys. 45 (1973) 574–588.
[32]D. Stauffer, Introduction to Percolation Theory, Taylor & Francis, London and Philadelphia, 1985.
[33] K.H. Gardner, B.S. Hsiao, R.R. Matheson, B.A. Wood, Polym. Phys. 33 (1992) 2483–2495.
[34] C. Schick, A. Wurm, A. Mohammed, Colloid Polym. Sci. 279 (2001) 800.
[35]A. Leonardi, E. Dantras, J. Dandurand, C. Lacabanne, J. Therm. Anal. Calorim. 111 (2013) 807–814.
[36] G. Boiteux, C. Boullanger, P. Cassagnau, R. Fulchiron, G. Seytre, Macromol. Symp. 233 (2006) 246–253.
[37] Y. Lee, R.S. Porter, Polym. Eng. Sci. 26 (1986) 633–639.
[38]A.M. Diez-Pascual, M. Naffakh, M.A. Gomez, C. Marco, G. Ellis, M.T. Martinez, A. Anson, J.M. Gonzalez-Dominguez, Y. Martinez-Rubi, B. Simard, Carbon 47 (2009) 3079–3090.
[39] C. Sender, E. Dantras, L. Dantras-Laffont, M.H. Lacoste, J. Dandurand, M. Mauzac, J.L. Lacout, C. Lavergne, P. Demont, A. Bernes, C. Lacabanne, J. Biomed. Mater. Res. Part B 83B (2007) 628–635.
[40] A. Lonjon, P. Demont, E. Dantras, C. Lacabanne, J. Non-Cryst. Solids 358 (2012) 236–240.
[41] J.-F. Capsal, C. Pousserot, E. Dantras, J. Dandurand, C. Lacabanne, Polymer 51 (2010) 5207–5211.
[42] G.A. Gelves, U. Sundararaj, J.A. Haber, Macromol. Rapid Commun. 26 (2005) 1677–1681.
[43] M.P. Alvarez, V.H. Poblete, M.E. Pilleux, V.M. Fuenzalida, J. Appl. Polym. Sci. 99 (2006) 3005–3008.
[44] I. Balberg, C.H. Anderson, S. Alexander, N. Wagner, Phys. Rev. B 30 (1984) 3933–3943.
[45] R.J. Forster, L. Keane, J. Electroanal. Chem. 554 (2003) 345–354.
Table 1
Experimental σdcvalues with random errors.
AgNWs vol% σdc(S/m) Δσdc(S/m) 0 3.00E−12 7.50E−13 0.50 3.00E−12 7.50E−13 0.60 2.00E−04 2.25E−04 0.65 0.20 0.02 0.70 1.07 0.11 1 0.75 0.07 1.25 15.16 1.59 1.50 3.27 0.34 2 105 63 3 58 54 5 199 28