Recent investigations on composite sway frames
9
0
0
Texte intégral
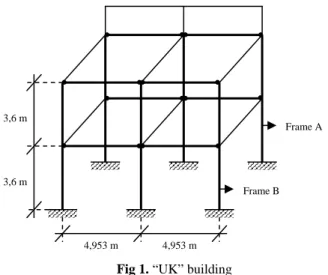
(2) 2. Studied structures. 2.2. 2.1. The “Bochum” structure is a 2-D full-scale structure tested in Bochum (Germany) under static loading [6]. Tests on joints in isolation have been performed so as to get their actual properties in terms of moment-rotation curves. The structure has been designed at Liège University in kind collaboration with Bochum University so as to fail by global in-plane instability [7]. The “Bochum” building (Fig 3) is a two-bay twostorey frame. The total height is 4,99 m and the total width is 9,76 m.. “UK” building. 2,49 m. 2,50 m. The “U.K.” building has been tested at BRE (Building Research Establishment), U.K. The test report is well documented (yield strengths, dimensions, type of loading); in particular, the behavioural curves of the structural joints are given (see [4] and [5]). This building is the one used in § 3 as a benchmark for the validation of the FINELG software, as both detailed data and test results are available. The structure (Fig 1) is composed of two parallel two-storey two-bay main frames (namely “Frame A” and “Frame B”) connected by secondary beams. The bare steel columns support composite floors made of steel beams connected at their upper flange, by shear studs, to a reinforced concrete slab.. “Bochum” frame. 3,6 m. Frame A. 5,87 m. 3,89 m. . Fig 3. General layout of the “Bochum” frame test. 3,6 m. Frame B. 4,953 m. 4,953 m. Fig 1. “UK” building. In Frame A, all the columns are bent about their major axis, while they are about their minor axis in Frame B. Both frames are subjected to concentrated loads F applied at one third and two thirds of each beam span (Fig 2). These ones are proportionally increased (λ load factor) until failure is reached, except for the lower right beam where these loads are kept constant as equal to “F”. λF. λF. λF. λF. λF. λF. F. F. Fig 2. Applied loading. Columns A and C are made of HEB260 profiles and column B of a HEB280 one. The IPE300 beams have their upper flange connected to the composite slab by means of shear studs. According to the draft European standard prEN1994-1-1, still available for confidential use only, all the joints are classified as semi-rigid and partialstrength. In accordance with the experimental facilities at Bochum University, the applied “service” loads on the frame are as follows: • a load of 400 kN applied at the top of each column; it is supposed to represent the gravity loads transmitted by the upper storeys; • uniform and concentrated gravity loads as indicated in Fig 4; • horizontal loads of 50 kN applied at both floor levels. For testing, the loading sequence was the following: all the gravity loads are first increased up to their nominal values; they are then kept constant while the horizontal loads are progressively magnified by a load factor λ till failure (see Fig 4). This loading sequence is also the one used for the numerical analysis (§ 4.3). More details about this structure are given in [6]..
(3) 400. 15. 15. 400. 50λ 3,5 kN/m. 3,5 kN/m. Horizontal load. 50λ. λu. curves (mid-span) for the lower floor beam of Frame B are given in Fig 5. Total load on the beam [kN]. 400. 450 400 350 300 250. Aachen Pisa Liège Test. 200 150 100 50 0 0. 10. 20. 30. 40. 50. 60. 70. 80. Relative mid-span deflection [mm] Fig 5. Frame B: lower beam load-deflection curves 1262 kN. Vertical load Fig 4. Loading conditions & loading sequence for the “Bochum” frame (kN). 3. Validation of the FINELG software In this section, a benchmark study aimed at validating the use of several finite element software for the numerical simulation of the non-linear behaviour of composite sway structures is described. More details may be found in [8]. The European project partners involved in the numerical studies are the following: • RWTH Aachen (Germany) – DYNACS software; • Pisa University (Italy) – ADINA 7.5 software; • Liège University (Belgium) – FINELG software. FINELG is a geometrically and materially non-linear finite element software developed at Liège University (M&S Department) and especially used for research purposes [9]. It enables to follow the behaviour of a structure under increasing loading up to the ultimate and even beyond. The reference structure for the benchmark study is the “U.K.” building (§ 2.1) because both the detailed data and test results were available ([4] and [5]). The validation is subordinated to a successful comparison of the results obtained numerically by the above partners with the ones recorded during the tests. Though the reports [4] and [5] are well documented, some data are nevertheless missing; therefore reasonable assumptions [10] have been agreed on so as to ensure a complete similarity of the data used by the above partners when performing their respective numerical simulations. The loading of the structure is given in Fig 2. Some partners carried out non–linear FEM analyses, with due account taken of second-order effects and material non-linearities. Frames A and B (Fig 1) have been modelled as plane frames and investigated separately up to collapse so as to get the ultimate load factor, the corresponding failure mode as well as loaddeflection curves. A detailed comparison of the results may be found in [8]; as an example, the load-deflection. Through this benchmark study, it is seen that the simulations conducted with different software show a reasonably good agreement with tests. More especially, the validity of the FINELG software has been demonstrated, what justifies its further use when investigating sway composite frames. 4. Numerical investigations 4.1. Introduction. Numerical investigations have been performed at Liège University using FINELG software [11]. The present paragraph introduces the numerical investigations carried out on the “Bochum” frame presented in § 2.2 and loaded as specified in Fig 4. A 2-D frame modelling of this structure is adopted. The different types of analysis which have been performed are first described in § 4.2. Then, the results are discussed in § 4.3. 4.2. Types of analysis. Different types of analysis have successively been performed for the studied frame; there are briefly presented below: • Elastic critical analysis: this analysis is achieved so as to derive the elastic critical load factor λcr that corresponds to the first mode of global instability. According to Eurocode 3 [12], this value is used through the evaluation of the λSd/λcr ratio - λSd being the design applied load factor - to determine whether a frame is laterally rigid or, in contrast, prone to sway. When this ratio is lower than 0,1, the frame is said rigid, otherwise it is sway. • First-order rigid-plastic analysis: this calculation results in the first-order rigid-plastic load factor λp; the latter is often called the first-order “limit” load factor. It can be obtained easily by hand-calculation, or by using appropriate software. The FINELG software requires the use of a trick for the computation of λp as it always accounts for the second-order effects; this trick consists simply in.
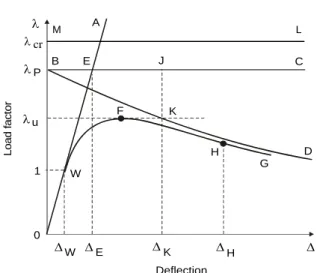
(4) increasing sufficiently the flexural stiffness of all the constitutive frame elements so as to avoid significant sway displacements. The first-order rigid-plastic load factor is required, for instance, to apply the simplified design method known as the MerchantRankine approach (§ 5.3). Second-order rigid-plastic analysis: this analysis differs from the previous one by the fact that equilibrium equations are now expressed with reference to the deformed frame configuration. It gives an indication on how second-order effects develop once the first-order rigid-plastic mechanism is formed and how much they affect the post-limit resistance. Because second-order effects are without significant influence on the plastic beam mechanisms, the second-order rigid-plastic response curve will not diverge notably from the one obtained from first-order rigid-plastic analysis. In contrast, for panel and combined beam-panel plastic mechanisms, the larger the sway displacement, the more the second-order rigid-plastic load factor is reduced when gravity loads increase. Non-linear analysis: in this type of analysis, all the geometrical and material non-linearities are considered: realistic material stress-strain curves, semi-rigid response of the joints and second-order effects induced by frame and element geometrical imperfections. The initial deformation of the buildings is evaluated in accordance with Eurocode 4 [3]. Such an analysis enables an accurate estimation of the actual ultimate load factor λu. Overview of the considered frame analyses: in Fig 6, the results of the different analyses described in this paragraph are qualitatively illustrated. This figure shows how the sway displacement Δ influences the value of the load factor λ got from the several types of analysis.. •. •. •. λ M λ cr. Load factor. λP. A. B. L. J. E. F. λu. C. K. D. H 1. 0. W. ΔK. ΔH. 4.3. Numerical results. The elastic critical analysis on the “Bochum” frame gives the load factor λcr = 9,42, so that λsd/λcr = 0,11. The latter value is just slightly larger than 0,1 with the result that it corresponds to the sway/non-sway boundary in the criterion introduced in § 4.2. A first-order rigid-plastic analysis has also been performed. When conducting hand calculations, the following basic independent plastic mechanisms must first be considered prior to their possible further combination: • panel mechanisms; • plastic beam mechanisms. The latter may however be disregarded as the vertical loads, once applied, are kept constant (Fig 4). The minimum value of λp corresponding to panel and combined beam/panel mechanisms are listed in Table 1. Table 1. Results from a first-order rigid-plastic analysis. Type of mechanism Panel mechanism (minimum value obtained for global panel mechanism) Combined mechanism. G. ΔW ΔE. load factor λcr. The first-order rigid-plastic analysis is represented by the curve “OBC”; when the firstorder rigid-plastic load factor λp is reached (in “B”), the failure develops under constant load (“BC” line). The behaviour got from the second-order rigidplastic analysis is represented by the “OBD” curve: when the rigid-plastic load factor λp is reached (in “B”), its value decreases with an increasing transverse displacement (“BD” curve). The “OFG” curve results from a non-linear analysis; it is likely to reflect the “actual” frame behaviour. The ultimate load factor λu corresponds to the peak ordinate of the load-displacement curve (in “F”). If, at λu, the failure of the structure is due to the formation of a full plastic mechanism, the “actual” behavioural curve “OFG” obtained through the non-linear analysis and the line “OBD” relative to the second-order rigidplastic analysis join at point “F”, in this particular case, point “F” should correspond to point “K” in Fig 6. If a global frame instability occurs before the development of a plastic mechanism, the “actual” curve remains below the second-order rigid-plastic one “OBD” and point “F” differs from point “K”. This situation is the one illustrated in Fig 6.. Δ. Deflection. Fig 6. Graphical representation of the results obtained through the different structural analyses. The line “OA” corresponds to a purely elastic firstorder analysis. The result of the elastic critical analysis is given by the horizontal line “ML”, the ordinate of which corresponds to the elastic critical. λp 1,82 9,42. Clearly, in accordance with the first-order rigidplastic analysis, the failure of the structure is due to the formation of a global panel mechanism. That is in accordance with the FINELG computation. A computerised non-linear analysis provides an ultimate load factor λu = 1,41 to which corresponds a top sway displacement of 85 mm. The structural loaddisplacement curve (Fig 7) starts at an abscissa which.
(5) Load factor λ. represents the initial out-of-plumb of the frame. The general shape of this curve, especially the descending branch in the post-limit regime, indicates that failure results from an instability and, in this specific case, from a global frame instability. Fig 8 shows that the number of plastic hinges at failure is smaller than the one required to form a full plastic mechanism (7 hinges instead of 8). The elastic load factor λe, corresponding to the formation of a first plastic hinge is equal to 1,26. λu = 1,41. 1.6 1.4 1.2 1 0.8 0.6 0.4 0.2 0. λe = 1,26. 0. 0.03 0.06 0.09 0.12 0.15 0.18 0.21 Horizontal top displacement [m]. Fig 7. Total horizontal load - top displacement curve for the “Bochum” structure. corresponding failure load is not, strictly speaking, associated to a full plastic mechanism with eight plastic hinges That is due to the fact that: i) only one plastic hinge at one beam end (right handside of the left upper beam) is missing before a global panel mechanism is formed, and ii) the bending moment in this cross-section when the last hinge (the seventh) forms is only 10% lower than the plastic moment resistance of the cross section (Fig 8). Finally, an elastic critical analysis is performed on the frame in which seven perfect plastic hinges are introduced at the beam ends and located as shown in Fig 8. This corresponding elastic critical load is seen to amounts 95 percent of the total applied vertical loads (see Fig 4). This last analysis confirms the above prediction that failure is due to a global frame instability subsequently to the development of a seventh plastic hinge in the frame. This failure mode is also the one that has actually been observed during the test carried out in Bochum. 5. Applicability of simplified analytical methods 5.1. Fig 8. Location of the plastic hinges at failure for the “Bochum” structure. As yet said in § 4.2, panel mechanisms are significantly influenced by second-order effects. A second-order rigid-plastic analysis is conducted in order to evaluate the influence of the geometrical nonlinearities on the value of the first-order rigid-plastic load factor λp. The relevant results are given in Fig 9. 2 λp = 1,82. Introduction. Several simplified analytical methods for frame analysis and design exist and some of them are proposed in Eurocode 3 [12]. The objective here is to investigate whether and how these design procedures can be generalised to composite sway frames. Two of these methods are focused on in the following paragraphs: the amplified sway moment method and the MerchantRankine approach. Investigations on the applicability of these two methods have already been performed on sway composite structures with satisfying results ([11], [13] and [14]). In the following paragraphs, these two methods are applied to the Bochum structure; an alternative procedure is described for the Merchant-Rankine approach as this method is based on the assumption of a proportional loading (§ 5.3), which is not the case for the studied structure (Fig 4). 5.2. Amplified sway moment method. Load factor. 1.6 1.2 λu = 1,41 0.8 0.4. Non-linear analysis Second-order rigid-plastic analysis First-order rigid-plastic analysis. 0 0 0.02 0.04 0.06 0.08 0.1 0.12 0.14 0.16 0.18 0.2. Horizontal top displacement [m] Fig 9. Second-order rigid-plastic analysis for the “Bochum” structure. The descending branch of the frame response obtained from a non-linear analysis is below but quite close to the one deduced from the second-order rigidplastic analysis even if, as shown in Fig 8, the. In this method, a first-order linear elastic analysis is first carried out; then, the resulting internal forces are amplified by a “sway factor” so as to ascertain for secondorder sway effects. Finally, the design load resistance of the frame is derived by computing the load at which a first plastic hinge develops in the frame. This method permits a direct comparison with the elastic load factor λe evaluated numerically. The steps to be crossed when applying this elastic design procedure are as follows: • A first-order elastic analysis is performed on the frame fitted with horizontal supports at the floor levels; it results in a distribution of bending moments in the frame and reactions at the horizontal supports..
(6) •. •. Then, a second first-order elastic analysis is conducted on the initial frame subjected to the sole horizontal reactions obtained in the first step; the resulting bending moments are the so-called “sway moments”. Approximate values of the “actual” second order moments result from the summing up of the moments obtained respectively in the two frame analyses, after having amplified the sole sway moments by means of the sway factor: 1 Vsd 1Vcr. (1). where: o Vsd is the resultant of all the gravity design loads; o Vcr is the lowest elastic critical load associated to a global sway instability. • The maximum elastic resistance of the frame is reached as soon as the first plastic hinge forms. Above design procedure is rather simple, as it only requires first-order elastic analyses. Also the principle of superposition remains applicable, what is especially useful when having to combine several individual loading cases. According to Eurocode 3 [12], the amplified sway moment method is restricted to structures characterized by Vsd/Vcr ranging from 0,1 to 0,25; this condition is met for the “Bochum” frame examined within the present paper. The application of this method to the “Bochum” frame gives an elastic load multiplier λe = 1,2. A comparison to the result obtained through a full nonlinear analysis described in § 4.3 (load factor λe = 1,26 corresponding to the formation of a first plastic hinge) gives a difference of 4,9 % (on the safe side). It may be concluded to a pretty good agreement between the two results; this confirms what has already been observed through previous investigations on other sway composite frames ([11] and [14]). 5.3. Merchant-Rankine approach. The Merchant-Rankine method is a second-order elasto-plastic approach, which was developed for bare steel frames; it allows to assess the ultimate load factor through a formula that takes account of interactions between plasticity (λp) and instability (λcr) in a simplified and empirical way. A direct comparison with the ultimate load factor λu got through the numerical investigations may be achieved. The Merchant-Rankine basic formula (MR) writes:. 1. λu or:. =. 1. λcr. +. 1. λp. (2). λu =. λp 1 + (λ p / λcr ). >/ λ p. (3). Should the frame be very stiff against sway displacements, then λcr is much larger than λp with the result of a low λp/λcr ratio: a minor influence of the geometrical second-order effects is expectable and the ultimate load is therefore close to the first-order rigidplastic load. In contrast, a flexible sway frame is characterised by a large value of the λp/λcr ratio. It shall collapse according to a nearly elastic buckling mode at a loading magnitude, which approaches the elastic bifurcation load. Strain hardening tends to raise plastic hinge moment resistances above the values calculated from the yield strength. Therefore most practical frames with only a few storeys in height attain a failure load at least equal to the theoretical rigid-plastic resistance. When the ratio λcr/λp is commonly greater than 10, the effects of material strain hardening more than compensate those of changes in geometry. Sometimes, additional stiffness due to cladding is sufficient to compensate such changes. To allow, in a general treatment for the minimum beneficial effects to be expected from both strain hardening and cladding, Wood suggested a slightly modified Merchant-Rankine formula (MMR):. λu =. λp 0.9 + (λ p / λcr ). >/ λ p. (4). in the range λcr/λp ≥ 4. He recommended not to use it in practice when λcr/λp < 4 but to carry a second-order elastic-plastic analysis in this range. When λp/λcr ≤ 0.1, λu is limited to λp, what means that the frame can be designed according to the simple first-order plastic hinge theory. A clear and direct relationship may be established between this criterion and the one, which enables, according to Eurocode 3 [12], to classify steel frames as sway (VSd / Vcr > 0,1) or rigid (VSd / Vcr ≤ 0,1). Similarly, the limitation of the field of application of the amplified sway moment method to Vsd/Vcr values lower than 0,25 is seen to be strongly related to the here-above expressed λcr/λp ≥ 4 range of application of the modified Merchant-Rankine formula. The use of Formula (4) is commonly restricted to frames in buildings, in which: 1) the frame is braced perpendicular to its own plane; 2) the average bay width in the plane of the frame is not less than the greatest storey height; 3) the frame does not exceed 10 storeys in height; 4) the sway at each storey, due to non-factored wind loading, does not exceed 1/300 of the storey height; 5) λcr/λp ≥ 4. From complementary studies carried out at Liège University [15], the MMR approach is seen to exhibit a different degree of accuracy according to the type of firstorder rigid-plastic failure mode which characterises the frame under consideration:.
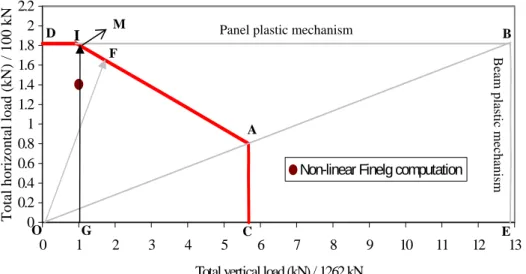
(7) • • •. safe for beam plastic mechanisms; adequate for combined plastic mechanisms; unsafe for panel plastic mechanisms. As a result, the application of the MMR approach to structures exhibiting a first-order panel plastic mechanism should therefore be prohibited. In [15], the scope of the MMR formula is extended to structures with semi-rigid and/or partial-strength joints and its applicability to composite steel-concrete structures is contemplated. The MMR approach cannot be applied to composite construction in a straightforward way. It has been developed for sway steel building frames where the loss of stability is related to the onset of plastic hinges. Another source of deformability exists in composite structures, concrete cracking, which develops well before the formation of the first plastic hinge. This effect, which is specific to composite construction, tends to increase the lateral deflection of the frame, amplifies consequently the second-order effects and so reduces its ultimate resistance. In other words, for a same number of hinges formed at a given load level in a steel frame and in a composite frame respectively, larger sway displacements are reported in the composite one. In order to incorporate this detrimental effect into the MMR approach, it is suggested in [13] to substitute the critical “uncracked” instability load factor λcr,uncracked by a “cracked” one, noted λcr,cracked. The validity of the so-obtained MMR approach for composite structures (CMMR approach) has been investigated in [14] and satisfactory results have been obtained. According to the MR approach, this method can not be applied here as it is based on the concept of “proportional loading”, what is not the case for the “Bochum” structure (Fig 4). Nevertheless, an alternative method is presented herein which anyway enables to estimate the ultimate load factor of this structure through the modified Merchant-Rankine approach for composite structure (CMMR approach). This alternative method consists: in deriving a CMMR interaction curve in a “V – H” • diagram (Fig 10), V and H being respectively the total vertical and horizontal applied loads at failure; in reporting in this diagram the actual loading path • followed during the test (Fig 4); in defining the failure load at the intersection • between the CMMR interaction curve and the one representing the actual loading path. This approach is based on the assumption that the ultimate load factor of a structure is independent of the loading history; this is not theoretically exact but it usually appears as acceptable. In practice, the CMMR interaction curve is obtained as follows: first, the V and H loads in Fig 10 are normalised by • dividing them by their values Vserv and Hserv at serviceability limit state, respectively 1262,4 kN and 100 kN (see § 2.2);. •. in a second step, different load combinations between Vserv and Hserv are considered (i.e. 0,5 Vserv + Hserv or Vserv +0,5 Hserv or ...); for each particular load combination, the • corresponding vertical and the horizontal service loads are then assumed to be proportionally increased until failure (load factor λprop); through this assumption, the critical load factor (λprop,cr) and the first-order rigid-plastic load factor (λprop,p) are computed and an estimation of the ultimate load factor (λprop,u) is derived, for each load combination, by means of the CMMR approach; finally, the ultimate load factors are reported in the • “V – H” diagram so as to obtain the CMMR interaction curve. The CMMR interaction curve computed for the “Bochum” structure is presented in Fig 10 (curve “DIAC”). The curve “DBE” corresponds to the first-order rigid-plastic resistance interaction curve; the horizontal line “DB” relates to the development of a first-order panel plastic mechanism (λprop,p only depends on the horizontal loads) and the vertical line “BE” to the development of a beam plastic mechanism in beam A (Fig 3) (λprop,p only depends on the vertical loads). In Fig 10, the diagram is seen to be separated in two zones by the line “OAB”: development of a first-order rigid-plastic panel • mechanism for load combinations relative to the upper part of the diagram; development of a first-order rigid-plastic beam • mechanism in beam A for load combinations relative to the lower part of the diagram. Fig 10 shows that no combination of V and H leads to the development of a combined plastic mechanism, as far as the “Bochum” structure is concerned. The shape of the CMMR interaction curve presented in Fig 10 can be explained as follows. When no vertical loads are applied to the structure, • the ultimate load factor λprop,u corresponds to the development of a panel plastic mechanism (point “D”); no instability phenomena occur as no vertical loads are applied. In this case, λpropr,u is equal to 1,82 (H = 182kN), which is equal to the first-order rigidplastic load factor λp computed in § 4.3 (Table 1). For small vertical loads, a panel plastic mechanism • still appears at failure (line “DI”). This indicates that second-order effects are quite negligible in this loading range. Beyond point “I”, second-order effects can no more • be neglected and the CMMR computed values λprop,u reduce when the importance of the vertical loads in the load combinations increases. At point “I”, the ratio λcr,cracked /λp is equal to 10. When no horizontal loads are applied to the • structure, the first-order rigid-plastic load factor corresponds to the development of a beam mechanism (λprop,p = 12,88); the CMMR ultimate load factor λprop,u, which is equal to 5,68, takes into.
(8) Total horizontal load (kN) / 100 kN. O. 0. M. I. Panel plastic mechanism. B. F. Beam plastic mechanism. 2.2 2 D 1.8 1.6 1.4 1.2 1 0.8 0.6 0.4 0.2 0. A. Non-linear Finelg computation. G. 1. C. 2. 3. 4. 5. E. 6. 7. 8. 9. 10. 11. 12. 13. Total vertical load (kN) / 1262 kN Fig 10. CMMR interaction curve for the “Bochum” structure. account the interaction between the plasticity and the instability phenomena under high vertical loads. The value λprop,u is constant and equal to 5,68 when • the first-order rigid-plastic mechanism is a beam one (vertical line “CA” of the CMMR interaction curve) as, in this specific case, λp, and therefore the CMMR load factor, are strictly depending on the vertical loads. For the “Bochum” structure, if the service loads were proportionally increased (loading path “OF”), an ultimate load factor λprop,u = 1,66 would be found by means of the CMMR approach (V = 2095,6 kN and H = 166 kN). But, as stated in Fig 4, this is not the case and therefore the λprop,u = 1,66 load factor can not be compared with the one (λu = 1,41) obtained in § 4.3 by means of FINELG; indeed, the latter has not been computed with a proportional loading, but with the actual one. The actual loading path is represented in Fig 10 by the arrow “OGM”. At its intersection with the interaction curve, a CMMR estimated failure load multiplier λu = 1,8 is derived, which may be now compared to the FINELG numerical result. The difference between the two approaches is equal to 22 % and the analytical predicted value is seen to be quite unconservative. Such a conclusion has already been drawn (see § 5.3) from previous studies on steel structures characterised by the development of a first-order rigid-plastic panel mechanism. Furthermore, the fact that “M” is very close to “I” in Fig 10 confirms the importance of the sway effects in the “Bochum” frame (in accordance with the numerical results where it is observed that only one plastic hinge is missing to form a full panel plastic mechanism at failure, see § 4.3 - Fig 8). Complementary studies are presently in progress at Liège University in order to investigate how the modified Merchant-Rankine basic approach could be improved in order to fit better to numerical computations for structures characterised by a the first-order rigid-plastic mechanism.. Obviously, as already said before, the application of this design method to such structures could be simply prohibited. For steel structures, this limitation of the field of application is not very restrictive as steel frames exhibiting a first-order rigid-plastic mechanism are usually not fulfilling the drift requirements under service loads. But for composite structures, in which the stiffness and resistance properties in bending of the composite beams are rather high in comparison to those of the steel or even composite columns, a satisfactory lateral response of the structure under service loads may be combined with the development of a panel yield mechanism in a first-order rigid-plastic analysis. As a consequence, further studies are therefore carried out with the objective to derive an amended CMMR approach in which the nature of the first-order rigid-plastic mechanism would be explicitly taken into consideration. 6. Conclusions. In the last years, the construction of taller buildings and larger industrial halls without wind bracing systems tends to make global instability a relevant failure mode, which is not yet covered by Eurocode 4. For three years, an European project, in which Liège University has been deeply involved, was funded by the European Commission for Steel and Coal (ECSC), so as to investigate the behaviour of such buildings. In the paper, numerical and analytical investigations performed on composite sway frames at Liège University, as part of the above-mentioned European project, are presented. The validity of the homemade FEM software FINELG for the numerical simulation until failure of composite structures has been shown through a benchmark study; then, a detailed numerical study of a composite sway frame tested in Bochum (Germany) has been achieved, and interesting phenomena have been identified. Finally, the applicability to the “Bochum” frame of two simplified design analytical methods known as the “Amplified sway moment method” and the “Merchant-.
(9) Rankine approach”, respectively based on elastic and plastic design philosophies, has been investigated. An alternative method for the application of the “MerchantRankine” approach to non-proportionally loaded frames has been followed so as to enable the comparison between numerical and analytical results. The accuracy of the “Amplified sway moment method” has been demonstrated and improvements of the “Merchant-Rankine” approach are presently in progress at Liège University. References 1. Eurocode 8. Design of structures for earthquake resistance. Part 1: General rules, seismic actions and rules for buildings. European Prestandard, ENV 1998-1, CEN, Brussels, 2003. 2. J. S. Hensman. Investigation of the wind-moment method for unbraced composite frames. Ph.D. thesis, Nottingham University (U.K.), January 1998. 3. Eurocode 4. Design of Composite Steel and Concrete Structures. Part 1.1: General Rules and Rules for Buildings. European Prestandard, ENV 1994-1-1, CEN, Brussels, 1992. 4. T. Q. Li, D. B. Moore, D. A. Nethercot & B. S. Choo. The experimental behavior of a full-scale, semi-rigidly connected composite frame: overall considerations. Journal of Constructional Steel Research, Vol. 39, 1996, pp. 167191. 5. T. Q. Li, D. B. Moore, D. A. Nethercot & B. S. Choo. The experimental behavior of a full-scale, semi-rigidly connected composite frame: detailed appraisal. Journal of Constructional Steel Research, Vol. 39, 1996, pp. 193-220. 6. M. Kraus. Applicability of composite structures to sway frames – Annual report 2002. Report for the ECSC project 7210-PR-250 “Applicability of composite structures to sway frames”, Bochum University, 2002.. 7. J.F. Demonceau & J.P. Jaspart. Applicability of composite structures to sway frames. Technical annual report 2002. Report for the ECSC project 7210-PR-250 “Applicability of composite structures to sway frames”, Liège University, January to December 2002. 8. J.F. Demonceau & J.P. Jaspart. Validation of the FEM technique for the numerical simulation of the response of composite building frames. Common report on a Benchmark study. Report for the ECSC project 7210-PR-250 “Applicability of composite structures to sway frames”, Liège University, March 2003. 9. FINELG User’s manual. Nonlinear finite element analysis program. 7th up-date, Liège University and BEG Design Office, July 1999. 10. J.F. Demonceau & J.P. Jaspart. Applicability of composite structures to sway frames. Technical annual report 2001. Report for the ECSC project 7210-PR-250 “Applicability of composite structures to sway frames”, Liège University, January to December 2001. 11. J.F. Demonceau, J.P. Jaspart & R. Maquoi. Design of composite sway building frames for global instability. ASCE journal of engineering mechanics, Special issue on advances in the stability of framed structures, to be published. 12. Eurocode 3. Design of Steel Structures. Part 1.1: General Rules and Rules for Buildings. European Prestandard, ENV 1993-1-1, CEN, Brussels, February 1992. 13. S. Majkut. Extension of Eurocode 4 to the computation of composite sway buildings. Diploma work (2000 – 2001), Liège University, M&S Department (in French). 14. E. Pecquet. Contribution to the development of computation rules for steel-concrete sway composite buildings. Diploma work (2001 – 2002), Liège University, M&S Department (in French). 15. R. Maquoi & J.P. Jaspart. A simple approach for the design of steel and composite frames accounting for effective overall stability. Festschrift Prof. Richard Greiner, Graz University, Austria, October 2001..
(10)
Figure


+2
Documents relatifs
100 de protéines provenant exclusivement d’une farine de hareng de Norvège, et additionnées d’un mélange d’acides aminés sous forme libre, il a été montré que
100 Lysine (treatment II), the growth rate and food efficiency were significantly higher than those of the animals fed with diets at o.8g p. On an average, daily
Globalement, l’efficacité alimentaire est meilleure chez les femelles mais l’absence d’interac- tion significative sexe X taux de thréonine ne permet pas de conclure à
accroît légèrement l’intervalle entre mise bas ainsi que le nombre total de porcelets nés et sevrés.. - Chaque jour de retard à la première mise bas augmente l’âge
important role of the wall temperature for some of the heating systems used (floor a r 5 o watts » versus floor « 25 o watts !!). However, in our experimental
sur l’importance de la régulation de la température des locaux de sevrage très précoce (io-i jours).. du
puberty, ovulation rate at the first oestrus and reproductive performances at 30 days of gesta- tion (animals mated at the first oestrus). The first experiment was made
Existence of statistical relationships between some criteria of productivity in sows (weaning- conception interval, prolificacy) and various parameters measured during
