UNIVERSITÉ DU QUÉBEC
DISTRIBUTION SPATIALE DES ASSEMBLAGES DE DINOKYSTES DANS LES SÉDIMENTS DE SURFACE ET ÉVOLUTION DES CONDITIONS
PALÉOCÉANOGRAPHIQUES RÉCENTES DANS LA FOSSE DU MACKENZIE, MER DE BEAUFORT (CANADA)
MÉMOIRE PRÉSENTÉ À
L'UNIVERSITÉ DU QUÉBEC À RIMOUSKI
Comme exigence partielle de la Maîtrise ès Sciences en Océanographie
PAR
UNIVERSITÉ DU QUÉBEC À RIMOUSKI Service de la bibliothèque
Avertissement
La diffusion de ce mémoire ou de cette thèse se fait dans le respect des droits de son auteur, qui a signé le formulaire « Autorisation de reproduire et de diffuser un rapport, un mémoire ou une thèse ». En signant ce formulaire, l’auteur concède à l’Université du Québec à Rimouski une licence non exclusive d’utilisation et de publication de la totalité ou d’une partie importante de son travail de recherche pour des fins pédagogiques et non commerciales. Plus précisément, l’auteur autorise l’Université du Québec à Rimouski à reproduire, diffuser, prêter, distribuer ou vendre des copies de son travail de recherche à des fins non commerciales sur quelque support que ce soit, y compris l’Internet. Cette licence et cette autorisation n’entraînent pas une renonciation de la part de l’auteur à ses droits moraux ni à ses droits de propriété intellectuelle. Sauf entente contraire, l’auteur conserve la liberté de diffuser et de commercialiser ou non ce travail dont il possède un exemplaire.
REMERCIEMENTS
Enfin, depuis le temps que je le dis, c'est fini!!! Il aura fallu le temps, mais le bout a été atteint. Le voyage fut long, mais il n'a pas été solitaire et je voudrais remercier tout ceux qui m'ont accompagné.
Tout d'abord mon directeur André Rochon. Sans lui pas de projet, pas de voyage. C'est lui qui m'a donné ma chance pour ma première véritable expérience dans le domaine de la recherche scientifique. Il a su se montrer patient avec un total néophyte de la palynologie: ou comment sensibiliser un biologiste à la géologie, tout un exploit. Il a su être disponible pour prendre le temps de regarder tous les machins et les bidules que je pouvais prendre en photo et qui n'avaient rien à voir avec des palynomorphes. Et surtout il était là pour réfléchir avec moi, pour me guider dans les interprétations, pour m'apprendre à écrire comme un scientifique et non comme un littéraire. Bref, merci André pour avoir parfaitement su m'encadrer dans cette maîtrise.
Je remercie Dominique Hamel pour m'avoir tenue compagme durant les longues heures passées au microscope. Pour ces longues conversations sur tout et rien qui faisaient passer le temps. Pour m'avoir ainsi un peu mieux sensibilisé à la culture québécoise et à sa musique. Et aussi pour m'avoir aidé à résoudre les interrogations de mon quotidien au labo.
Une part importante de tout ceci a été rendue possible par les encouragements de ma famille. Malgré l'éloignement ils sont toujours restés présents avec moi. Après une année à
sais qu'ils sont heureux pour moi et je regrette juste que mon père nous ait quitté avant la fin.
Enfin, je voudrais aussi remercier les amis. Les anciens comme les nouveaux, ceux du Québec et de Rimouski, comme ceux de France et d'ailleurs qui ont gardé le contact malgré les kilomètres et les décalages horaires.
RÉSUMÉ
Les dinoflagellés sont des algues microscopiques unicellulaires et biflagellées. Ce groupe comprend des espèces toxiques qui peuvent être responsables de « marées rouges » toxiques pour les organismes des milieux exposés. Il existe un stade de donnance dans le cycle de vie de ces algues, au cours duquel elles produisent un kyste (=dinokyste) résistant et qui se retrouve dans le sédiment. Lorsque les conditions du milieu sont adéquates (lumière, nutriments, température, oxygène ... ), il y a exkystement. Le kyste, du fait de la composition de sa membrane, est préservé dans le sédiment. Chaque kyste est caractéristique d'une espèce de dinoflagellé et différents assemblages de ces microalgues sont caractéristiques des conditions du milieu au moment de la fonnation du kyste.
À l'été 2004, Lors de la mission CASES (Canadian Shelf Exchange Study) dans la mer de Beaufort, 34 échantillons de sédiments de surface ont été récoltés sur la platefonne du Mackenzie et dans le golfe d'Amundsen. À partir de l'analyse de ces échantillons de sédiments de surface, nous avons pu détenniner les assemblages modernes de kystes de dinoflagellés qui caractérisent cette zone. Nous trouvons deux assemblages principaux. Le premier assemblage, constitué de 3 sous-assemblages, délimite la platefonne du Mackenzie et le sud du golfe d'Amundsen. Alors que l'influence fluviale diminue et l'influence marine augmente, les kystes de taxa autotrophes sont plus abondants dans la caractérisation de cet assemblage. Le deuxième assemblage est caractérisé presque essentiellement par des espèces de taxa autotrophes et délimite la zone de la polynie du Cap Bathurst dans le nord du golfe d'Amundsen.
Les comptages des dinokystes récoltés pour chaque station lors de cette étape du projet ont été introduits dans la base de données du GEOTOP à Montréal (n=1171). À l'aide de fonctions de transfert utilisant la méthode des meilleurs analogues, cette base de données servira à la reconstruction des conditions paléocéanographiques (température et salinité d'été et d'hiver des eaux de surface, durée du couvert de glace, production primaire).
Lors de la mission, 3 carottes par boîte ont été prélevées dans la fosse du Mackenzie, à l'embouchure du fleuve, selon un transect nord-sud. L'échantillonnage a été fait au centimètre, mais les comptages microscopiques ont été réalisés selon un intervalle de 2 cm. Les vitesses de sédimentation pour chaque carotte ont été estimées grâce à la mesure de l'activité du 210Pb et nous avons détenniné une chronologie pour chacune des 3 carottes. Nous avons observé la succession de 2 assemblages de dinokystes sur une période de ~ 1000 ans pour notre zone d'étude. Un assemblage fossile caractérisé principalement par des espèces de taxa hétérotrophes et un assemblage récent caractérisé principalement par des espèces de taxa autotrophes. Nous avons reconstitué les conditions paléocéanographiques récentes pour chaque carotte. Nous avons pu caractériser un
TABLE DES MATIÈRES
REMERCIEMENTS ... '" ... .ii RÉSUMÉ ... iv
TABLE DES MATIÈRES ... v
LISTE DES TABLEAUX ... viii LISTE DES FIGURES ... ix
INTRODUCTION GÉNÉRALE ... 1
CHAPITRE 1 Distribution of dinoflagellate cysts in surface sediments of the Mackenzie Shelf and Amundsen Gulf, Beaufort Sea (Canada). Thomas Richerol, André Rochon, Steve Blasco, Dave B. Scott, Trecia M. Schell and Robbie 1. Bennett ABSTRACT ... 5
1.1 Introduction ... 6
1.2 Environmental Setting ... 8
1.3 Materials and Methods ... 11
1.3.1 Sampling ... 11 1.3.2 Sieving ... Il 1.3.3 Chemical processing ... 12 1.3.4 Palynomorph counts ... 12 1.3.5 Statistics ... 13
1.3.6 Environmental data ... 14 1.4 Results and Discussion ... 16
1.5 Conclusion .... 33
CHAPITRE 2 Évolution des conditions des eaux de surface au cours des derniers 1000 ans dans la fosse du Mackenzie, mer de Beaufort (Canada) 2.1. INTRODUCTION ... 35 2.2 MATÉRIELS ET MÉTHODES ... 37 2.2.1 Échantillonnage ... 37 2.2.2 Tamisage ... 38 2.2.3 Traitements Chimiques ... 39 2.2.4 Comptage des Palynomorphes ... .40 2.2.5 Mesures de l'activité du 2JOPb ... 41 2.3 RÉSULTATS ... 43 2.3.1 Chronologie ... 43 2.3.2 Stratigraphie des séquences sédimentaires ... 46
2.3.3 Assemblages fossiles de dinokystes ... 47 2.3.4 Flux de palynomorphes ... 49 2.3.4.1 La période pré-LIA (-1000 à 1550AD) .................. 53 2.3.4.2 La période du LIA (-1550 à 1850 AD) ........ 54
2.3.5.1 La période pré-LIA (~1000à 1550AD) ............. 57
2.3.5.2 La période du LIA (~1 550 à 1850 AD) ... 58
2.3.5.3 L'Ère Industrielle (~1850 à 2004 AD) ... 59
2.3.6 Test de validation des Fonctions de Transfert ... 60
2.4 DISCUSSION ... 63
2.5 CONCLUSION ... 76
CONCLUSION GÉNÉRALE ... 78
RÉFÉRENCES ÉLECTRONIQUES ... 81
Table 1
Table 2
Table 3
LISTE DES TABLEAUX
Geographical coordinates, water depth (in meters), number of cysts counted,
cyst concentrations (cyst/g) and hydrographie data for samples shown in Fig. 2. Temperature and Sali nit y are in oC and psu (practical salinity units) respectively. Ice is the number of months with more than 5/1 0 sea-ice coverage ... 15
List of dinoflagellate taxa present in our sampi es, and their code name ... 18
LISTE DES FIGURES
CHAPITRE 1
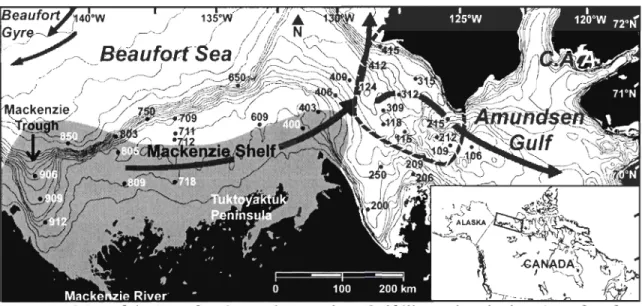
Figure 1 Map of the Beaufort Sea and Amundsen Gulf illustrating the location of surface
sediment samples used in our study. The thick arrows represent surface currents, the grey area represents the maximum extent of the Mackenzie River plume and the da shed line indicates the extent of the Cape Bathurst Polynya. 8
Figure 2 Distribution map of dinocyst concentrations (cyst/g) in the study area. The
Figure 3
Figure 4
dashed line illustrates the maximum ex te nt of the Mackenzie River plume. 16
Relative abundance of selected dinoflagellate cyst taxa, sea surface parameters (temperature and sea ice cover) and hierarchical clustering of sediment
samples used to determine dinocyst assemblages. 21
Graph of the Canonical Correspondence Analysis (CCA) between the dinocyst species and the sea-surface parameters. Tfeb
=
sea-surface temperature of February; Taug = sea-surface temperature of August; Ice = sea-ice coverduration. 23
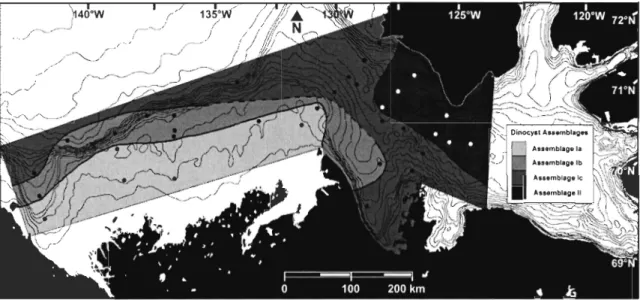
Figure 5 Surface distribution of dinocyst assemblages in the study area. The dashed lines indicate uncertainties in defining assemblage zones. 24
Figure 6 Figure 7 Figure 8 Figure 9 Figure 10 Figure Il
Distribution map of the relative abundance of Islandinium minutum s.l. in
surface sediments from the study area. 25
Distribution map of the relative abundance of Brigantedinium spp. in surface sediments from the study area. The thin dashed lines indicate uncertainties in defining percentage zones, and the thick dashed line indicates the maximum
extent of the Mackenzie River plume.
26
Distribution map of the relative abundance of Polykrikos arctic/quadratus in surface sediments from the study area. The dashed lines indicate uncertainties
in defining percentage zones.
26
Distribution map of the relative abundance of Operculodinium centrocarpum s.l. in surface sediments from the study area. The dashed lines indicate
uncertainties defining percentage zones. 27
Distribution map of the relative abundance of Pentapharsodinium dalei in surface sediments from the study area. The thin dashed lines indicate uncertainties defining percentage zones, and the thick da shed line indicates the maximum extent of the Mackenzie River plume. 28
Distribution map of the relative abundance of Spiniferites elongatus/frigidus in surface sediments from the study area. The dashed lin es indicate
Figure 12 Distribution map of the Autotrophic/Heterotrophic ratio. 30
CHAPITRE 2
Figure 1 Carte de la mer de Beaufort depuis la fosse du Mackenzie jusqu'au golfe
d'Amundsen : courants de surface et hydrographie de la région. La zone en violet représente la zone d'influence de la plume du fleuve Mackenzie et la ligne pointillée délimite la zone de la polynie du Cap Bathurst. Les points nOIrs représentent la localisation des 3 stations où les carottes ont été prélevées. 37
Figure 2 Courbes de l'activité totale du 210Pb dans les sédiments (dpm), du logarithme du
210Pb en excès et des années en fonction de la profondeur (cm) dans chacune des
trois carottes de sédiment. La deuxième courbe donne accès aux vitesses de
sédimentation (cm/an). 45
Figure 3 Détermination des assemblages de dinokystes fossile et moderne pour les 3
séquences sédimentaires à partir des abondances relative des principales espèces. La zone en gris foncé délimite l'Assemblage 1. Pour la séquence 912A
la zone en gris clair délimite les 4 profondeurs considérées comme « stériles»
après le comptage. 48
Figure 4 Flux des 5 principaux palynomorphes comptés, en fonction de la profondeur (cm),
pour chaque carotte de sédiment: dinokystes (cysts/cm2/an), palynomorphes terrestres (grains/cm2/an), Halodinium spp. (grains/cm2/an), réseaux organiques de
foraminifères (réseaux/cm2/an) et palynomorphes remaniés (grainslcm2/an). Les
courbes en couleur représentent la tendance moyenne. La zone dite
«
stérile» pour la carotte 912A délimite les 4 profondeurs avec des faibles comptages dedinokystes. 50
Figure 5 Comparaison entre le débit annuel du fleuve Mackenzie (m3/s) entre 1935 et 2005, et les flux de Halodinium spp. mesurés (grains/cm2/an) pour la même
période, à partir de la carotte 906B. Les données de débit du fleuve proviennent du site d'Environnement Canada, de la base de données HYDAT. 52
Figure 6 Comparaison de l'évolution dans le temps des flux de dinokystes (cysts/cm2/an),
des pourcentages de kystes de dinoflagellés autotrophes et hétérotrophes et des 3 paramètres reconstitués pour les 3 carottes de sédiments: la température de surface du mois d'août (oC), la salinité de surface du mois d'août et la durée du couvert de glace (mois/an). Les courbes en couleur représentent la tendance moyenne. Pour chaque paramètre reconstitué, la ligne verticale indique la valeur moderne du paramètre. La zone dite « stérile» pour la carotte 912A délimite les 4 profondeurs avec des faibles comptages de dinokystes. La zone grise représente le Petit Âge Glaciaire (Little !ce Age - LIA, 1550-1850 AD). La ligne horizontale noire sur la courbe des flux de dinokystes sépare l'assemblage 1 fossile de l'assemblage II
Figure 7 Représentation graphique du test de validation des Fonctions de Transfert pour les paramètres Température des eaux de surface du mois d'Août (oC), Salinité des
eaux de surface du mois d'Août et durée du couvert de glace (mois/an). 62
Figure 8 Évolution dans l'espace et dans le temps de 4 paramètres, (A) le pourcentage de taxons autotrophes et de taxons hétérotrophes, (B) les températures des eaux de surface reconstituées pour le mois d'août en oC, (C) les salinités des eaux de
surface reconstituées pour le mois d'août, (D) la durée du couvert de glace
reconstituée en mois/an. Les courbes en couleur représentent la tendance moyenne. Pour chaque paramètre reconstitué, la ligne verticale indique la valeur
moderne du paramètre. La zone dite « stérile» pour la carotte 912A délimite les 4 profondeurs avec des faibles comptages de dinokystes. La zone grise
représente le Petit Âge Glaciaire (Little Ice Age - LIA, 1550-1850 AD). La ligne noire en pointillée représente l'évolution dans l'espace et dans le temps
INTRODUCTION GÉNÉRALE
Au cours du demier siècle écoulé, les scientifiques ont observé un réchauffement des conditions climatiques globales, particulièrement dans l'Arctique. Un amincissement (~0.1 rn/an au cours de la demière décennie) et une réduction du couvert de glace pluriannuelle ont été mesurés (Rothrock et al., 1999; Dumas et al., 2005). Pour bien comprendre ce phénomène il faut le mettre en perspective avec les événements climatiques dans un contexte géologique récent (les demiers 10000 ans). De cette manière nous serons capables d'appréhender l'impact de tels changements et leur possible évolution future.
En effet, ce phénomène a de graves conséquences aussi bien localement que globalement. Le couvert de glace influe sur les échanges gazeux et de chaleur entre l'océan et l'atmosphère, ainsi que sur la pénétration de la lumière et donc la production primaire. Certaines espèces animales et végétales (phoques, ours polaires, algues de glace ... ) ont besoin de la glace pour se reproduire et vivre. Ainsi une réduction du couvert de glace pourrait entraîner un déplacement des populations animales. Par extension, les populations humaines locales se retrouveraient privées d'une source de nourriture et devraient revoir entièrement leur mode de vie. Une réduction du couvert de glace pourrait également entraîner à plus ou moins long terme l'ouverture de l'océan Arctique et ainsi y permettre la navigation et son exploitation.
de l'océan Arctique et les changements observés dans les écosystèmes locaux, pourraient refléter le réchauffement global et les effets des gaz à effet de serre d'origine anthropogénique. Des données provenant des sédiments marins d'autres régions de l'Arctique ont montré que de grands changements se sont produits par le passé, comme des périodes sans glace et des changements dans la circulation océanique de l'Arctique. C'est pourquoi, la validation de modèles sur le forçage océan-atmosphère dans l'Arctique requiert des indicateurs géologiques pour détenniner une valeur initiale réaliste dans le cadre d'un scénario de réchauffement. Des études précédentes sur la distribution des dinokystes des régions arctiques et sub-arctiques ont montré qu'ils sont présents dans la majorité des sédiments de surface des mers arctiques et de leurs estuaires (Rochon et al., 1999 ; Mudie et Rochon, 2001 ; Voronina et al., 2001 ; Kunz-Pirrung, 2001 ; Gf0sfjeld et Harland, 2001 ; Boessenkool et al., 2001 ; Radi et al., 2001). L'utilisation des dinokystes comme traceurs micropaléontologiques pennet d'établir la reconstitution des conditions paléocéanographiques récentes du milieu (température, salinité, durée du couvert de glace de mer, productivité primaire de l'écosystème) (de Vernal et al., 2001). Lors de cette mission, des échantillons de sédiment de surface ont été prélevés sur la platefonne du Mackenzie et dans le golfe d'Amundsen afin de documenter les assemblages modernes de dinokystes de cette région de l'Arctique caractéristiques des conditions actuelles (Richerol et al., 2007 soumis). Ces assemblages ont été ajoutés à une base de données de référence d'assemblages modernes de dinokystes (n= 1171) qui est gérée par le GEOTOP à Montréal.
En combinant cette base de données avec les fonctions de transfert du programme «R », dél1Vé du programme « 3PBase » (Guiot et Goeury, 1996), une interpolation des meilleurs
analogues actuels et fossiles pennettra d'évaluer et de comprendre les changements climatiques pré-industriels et post-industriels.
Dans un premier temps, nous avons établi la répartition spatiale des assemblages de kystes de dinoflagellés et lié cette distribution aux paramètres environnementaux. Des cartes de répartition spatiale établies pour les principales espèces de dinokystes fournissent des infonnations sur les relations entre ces derniers et les paramètres des masses d'eau de surface (température et salinité d'hiver et d'été, durée du couvert de glace de mer, productivité primaire de l ' écosystème).
Dans un deuxième temps, nous avons détenniné la nature des assemblages fossiles de dinokystes puis réalisé la reconstitution des conditions passées à partir des données fournies par trois carottes à boîte prélevées selon un transect Nord-Sud dans la fosse du Mackenzie. Cette fosse, située à l'embouchure du fleuve Mackenzie, possède les plus forts taux de sédimentation de toute la zone d'étude. Ainsi nous pouvons remonter jusqu'à ~200, ~450 et ~ 1000 ans dans le passé. Ces carottes, de part leurs dispositions, nous pennettent alors de visualiser plus précisément la période post-industrialisation (~1800 à 2004 AD), le Petit Âge Glaciaire (LIA, ~ 1550-1900 AD) et le dernier millénaire avec une résolution variant de pluriannuelle à décennale.
Par rapport à d'autres séquences sédimentaires plus étendues, les séquences récoltées au cours de cette mission pennettent de mettre l'accent sur la tendance climatique actuelle depuis l'intervention significative de l'homme avec le début de l'ère industrielle et nous pennettent une comparaison avec des conditions passées « naturelles ».
CHAPITRE 1
Distribution of dinoflagellate cysts in surface sediments of the
Mackenzie
Shelf and Amundsen Gulf, Beaufort Sea (Canada).
Thomas Richerol, André Rochon, Steve Blasco, Dave B. Scott, Trecia M. Schell and Robbie 1. Bennett
Accepté pour publication dans la revue Journal of Marine Systems, sous réserve de corrections modérées, le 28 Juin 2007.
ABSTRACT
ln order to document long-term climate cycles and predict future climate trends for the Arctic, we need to look at the geological record to establish the link between historical and pre-historical sea surface parameters. Dinoflagellate cysts (dinocysts) are used as proxy indicators of sea surface parameters (temperature, salinity, sea-ice cover, primary productivity) jointly with transfer functions and a modem dinocyst reference database, to reconstruct the evolution of sea surface conditions at decadal and millennial timescales. Here we present the surface distribution of recent dinocyst assemblages from 34 surface sediment samples collected on the Mackenzie Slope/ Amundsen Gulf during the 2004 CASES (Canadian Arctic ShelfExchange Study) cruise. Dinocyst concentrations in surface sediments are relatively high outside the Mackenzie plume area and increase gradually eastward toward Amundsen Gulf. The cysts of autotrophic dinoflagellates are dominant throughout the study area, while the maximum abundance of heterotrophic taxa is found within the Mackenzie plume. Hierarchical clustering analyses allowed defining two dinocyst assemblages. Assemblage 1 is located on the Mackenzie Slope and southem Amundsen Gulf, while assemblage II is located within the Cape Bathurst Polynya area in northem Amundsen Gulf. Both assemblages are dominated by Operculodinium centrocarpum, but are distinguished on the basis of the relative abundance of Islandinium minutum, a taxon generally associated with sea ice. Islandinium minutum is found in lower
1.1 Introduction
Concerns have been raised during the past few decades about the future of our environment. Notable changes are already being observed and measured throughout the Arctic regions, but their extent and duration are still poorly understood. To achieve a better understanding of this global phenomenon, scientists tend to study those systems that have historically proven to be sensitive to variations in climate, with the goal of predicting the course that the climate of our planet will take in the years to come. One of these indicators of the planet's "pulse" is the Arctic ecosystem- more specifically, its ocean and its ice coyer. A thinning of the multi-year ice coyer (of approximately 0.1 mlyear for the past ten years) and a decline in the area that it covers have been observed over the last few decades (Rothrock et al., 1999; Dumas et al., 2005).
Previous studies on the distribution of dinoflagellate cysts have shown that they are present in the overwhelming majority of surface sediments on the Arctic seas and their estuaries (Rochon et al., 1999; Mudie and Rochon, 2001; Voronina et al., 2001; Kunz-Pirrung, 2001; Gmsfjeld and Harland, 2001; Boessenkool et al., 2001; Radi et al., 2001). The use of micropalaeontological markers, such as dinoflagellate cysts (i.e. dinocysts), allows for the reconstruction of recent paleoceanographic conditions (temperature, sali nit y, duration of the sea ice coyer, primary production of the ecosystem) (de Vernal et al., 2001).
The study of dinocyst assemblages collected from surface sediments of the Beaufort Sea
during Leg 8 of the CASES (Canadian Arctic Shelf Exchange Study) cruise in the summer of 2004 allows us to determine the assemblages characteristic of the CUITent modem
conditions. These assemblages will be added to a reference database of modem dinocyst assemblages that is managed by GEOTOP (de Vernal et al., 2001).
The primary objective of this article is to establish the spatial distribution of dinoflagellate cyst assemblages and to assess their relationships with environmental parameters. Samples were collected on the shelf and slope of the Mackenzie Shelf (Beaufort Sea, Canada) and Amundsen Gulf; the y fill a gap in the CUITent dinocyst database. Maps of spatial distribution for major dinocyst species provide information on their relationships to one another and the sea-surface parameters.
1.2 Environmental Setting
The Mackenzie Shelf is a coastal region of the Beaufort Sea located along the Arctic Ocean's Canadian coast, between Point Barrow in northern Alaska and the western part of the Canadian Arctic Archipelago (C.A.A.) (Mudie and Rochon, 2001; Wang et al., 2005). It is approximately 100 km wide, representing less th an 2% of the total coast of the Arctic Ocean, and covers an area of approximately 64 000 km2 (to the 200 f i isobath) (Stein and Macdonald, 2004; O'Brien et al., 2006). The shelf is bordered to the west by the Mackenzie Trough and to the east by Amundsen Gulf (Fig. 1).
Figure 1. Map of the Beaufort Sea and Amundsen Gulf illustrating the location of surface sediment samples used in our study. The thick arrows represent surface currents, the grey area represents the maximum extent of the Mackenzie River plume and the dashed line indicates the extent of the Cape Bathurst Polynya.
The ice cover varies greatly from year to year. In general, the ice begins to form in mid-October and begins to break up at the end of May (Wang et al., 2005; O'Brien et al.,
2006). If the winds allow, the shelf may be ice-free as early as mid-July. In the winter,
landfast ice forms near the coast, beyond the 20 m isobath, and the stamukhi (i.e. a field of ice fragments), which contains ice and sediment mixed together, forms on the outer edge of the land fast ice. Beyond the stamukhi, one can observe a zone where the ice breaks up, with flaw lead forming intermittently across the pack ice, which tends to be moved westward by the Beaufort Gyre (Macdonald et al., 1995; O'Brien et al., 2006). To the east, near Amundsen Gulf, the ice-free zone forms part of the Cape Bathurst Polynya (Arrigo and van Dijken, 2004). Polynyas are ice-free zones in the middle of the landfast ice, in both the Arctic and the Antarctic, that form in the win ter under the action of winds, CUITents and upwellings of warmer water. They form every year at approximately the same location and
are, in general, areas of high productivity.
The Mackenzie is the third largest Arctic river in tenns of flow of fresh water, with an
average flow of 4 000 m3/s (Melling, 2000; Dumas et al., 2005). It is also the largest in
terms of sediment discharge, with approximately 127.106 Mt/year, which exceeds the total
sediment discharge of all the other great Arctic rivers together (Macdonald et al., 2004;
Stein and Macdonald, 2004; O'Brien et al., 2006). The Mackenzie River drainage basin,
which is the source of the sediment and other materials caITied by the river, covers a vast
are a (1.8 x 10⁶ km2) (Hill et al., 2001; Wang et al., 2005; Abdul Aziz and Bum, 2006). This basin drains the northem Rockies Mountains through the Athabasca and Peace rivers, and
dates from the end of the Wisconsinian Glaciation and results from eroslOn by the Laurentide Ice Sheet, which shifted the eastward-flowing drainage system toward the north. The main part of the delta fills a glacial valley that runs the width of the Mackenzie Trough. This trough is composed of more than 200 m of glacial sediments from the end of the Pleistocene, covered with deltaic deposits from the end of the Pleistocene and the Holocene (Blasco et al., 1990; Hill, 1996; Hill et al., 2001).
The Mackenzie River flows into the Beaufort Sea. The oceanic circulation of the Beaufort Sea is dominated by the anticyclonic Beaufort Gyre, which pushes the currents along the continental shelf. AlI along the coast, the currents are influenced by the wind direction, which altemates between eastward in the Canadian Archipelago and westward beyond the Mackenzie Trough (Vilks et al., 1979; Mudie and Rochon, 2001). The transport of suspended sediments within the plume of the Mackenzie can be affected by the ice cover, winds and currents (Fig. 1). In winter, the river carries sediments on a shorter distance, and its flow rate is reduced near the coast, below the landfast ice (Macdonald et al., 1995). In summer, the plume's position is greatly affected by the winds. Those coming from the northeast push the plume along Tuktoyaktuk Peninsula (Giovando and Herlinveaux, 1981), while the winds from the southeast push the plume westward, beyond the Mackenzie Trough (MacNeill and Garrett, 1975). As a result, the highest rates of accumulation are found in the Mackenzie Trough and on the nearby continental slope. As we move farther to the east, the rates of accumulation decline up to Amundsen Gulf, where sediment hardly accumulates at all (Hill et al., 1991; Macdonald et al., 1998; Blasco Unpublished result).
1.3 Materials and Methods
1.3.1 Sampling
Sampling in the Beaufort Sea and Amundsen Gulf was carried out in the summer of 2004 during Leg 8 of the CASES (Canadian Arctic Shelf Exchange Study) cruise. A series of 34 surface samples were collected using a boxcorer, and the first 5 mm of the sediment's
surface were collected. Each sample was then processed according to the standard palynological method described by Rochon et al. (1999).
1.3.2 Sieving
Approximately 5 cm3 were taken from each sample and the volume measured in a graduated cylinder by water displacement. The weight (in gram) of this 5 cm3 of sediment is also measured. A tablet of Lycopodium clavatum spores of known concentration (12100
spores/tablet) is added to each sample. They serve as a palynological marker that enables us to calculate the concentration of palynomorphs in each sample. In order to determine the percentage of water in our samples, a small amount of sediment was collected and weighted before and after a period of at least 12 h in an incubator (60°C). Sieving was performed
clay. The fraction between 10 !lm and 100 !lm was preserved in a conical tube with a few drops of phenol for subsequent chemical processing.
1.3.3 Chemical processing
The IO!lm to 100 !lm fraction was processed with repeated treatments of hydrochloric acid (4 treatments with 10% HCI) and hydrofluoric acid (3 treatments, one of which was performed ovemight, with 49% HF) in order to dissolve carbonates and silicates, respectively. These acid treatments were performed with heat in order to increase the rate of reaction. The remaining fraction was rinsed with distilled water to eliminate traces of acid before a final sieving at 10 !lm that was performed to remove fluorosilicates and fine particles. The sample was mixed in the Vortimixer, and a few drops of the supematant were drawn off and added to glycerin jelly to be mounted between slide and coyer slip.
1.3.4 Palynomorph counts
Palynomorphs (pollen, spores, dinoflagellate cysts, acritarchs, and freshwater palynomorphs) were counted using an optical microscope (Nikon Eclipse I-80) under transmitted light, with magnification factors ranging from 200x to 400x. A minimum of 300 dinoflagellate cysts were counted in most samples, with the exception of two samples
for which the counts were of 148 and 256 individuals. This method glves a sufficient representation of aIl the taxa present in the sample. The dinocyst concentration per unit of dry weight (cysts/g) and the relative abundance of each species (% dinocyst sp.) were calculated for each sample. The spatial distribution maps are obtained by linear interpolation between stations.
The dinocyst nomenclature is conformed to that of Rochon et al. (1999); Head et al. (2001) and the index of Lentin and Williams (Fensome and Williams, 2004). With respect to Echinidinium spp., there were only few specimens in sorne slides and they were not identified at the species level.
1.3.5 Statistics
The sampling sites were arranged in a hierarchical clustering according to the dinocyst assemblages that characterizes them. We used the software PRIMER v5 (Plymouth Routines In Multivariate Ecological Research; Clarke and Gorley, 2001). The analysis was based on the non-transformed values of the dinocyst concentrations per dry weight (cysts/g). First, the program organized our data in a similarity matrix based on a measure of Euclidean distance. N ext, a cluster was built on the basis of this matrix.
We then performed a Canonical Correspondence Analysis (CCA) to establish the relationships between the dinocyst species and the sea-surface parameters. The same data
used for the hierarchical clustering was used in the CCA, in addition to environrnental data from Table 1.
1.3.6 Environrnental data
The hydrographic data collected during the CASES croise represent only a limited survey of the conditions on the Mackenzie Shelf. We used surface temperature and salinity data from the World Ocean Atlas (2001) of the National Oceanographic Data Center (NODC) in order to obtain a multi-year representation of data, without any transformation (Table 1). When there were no data for a site, we used the NOAAZ interpolation grid built from NOAA 2001 (National Oceanic and Atmospheric Administration). The ice cover data cornes from the National Climate Data Center in Boulder (NeDC) and cover the years 1953-2000. These data are an annual average of environrnental conditions; thus the impact of the year-to-year variability in the area is reduced (de Vernal et al., 2001; de Vernal et al., 2005).
Table 1 Geographical coordinates, water depth (in meters), number of cysts counted,
cyst concentrations (cyst/g) and hydrographie data for samples shown in Fig. 2.
Temperature and Salinity are in oC and psu (practical salinity units) respectively. Ice is the
number of months with more than 5/1 0 sea-ice coverage.
Station number 2004-804-106 2004-804-109 Lab number 140.5 140.3 Latitude Longitude 70°. 36.0N 122°. 37.8W 70°.39.600N 123°. 25.824W Water
Count Concentration T Feb S Feb TAlIg S Allg Ice depth 122 301 4645 0.4 31.8 5.3 28.0 8.8 569 300 7352 0.3 31.9 5.2 27.0 8.8 2004-804-115 139.6 70°.50.910N 125°.03.010W 352 314 308 311 303 319 312 354 306 319 389 360 333 312 310 314 301 332 334 256 318 335 326 310 305 304 307 148 301 301 303 304 305 2873 3191 5255 3319 3910 3590 6563 6303 3237 6541 6292 7018 1029 1399 5508 4869 4457 4058 1857 4529 2194 3488 2593 1784 2720 2626 2118 -0.1 32.5 6.7 28.7 8.6 2004-804-118 139.5 70°.56.64N 125°.51.02W 388 2004-804-124 2004-804-200 2004-804-206 2004-804-209 2004-804-212 2004-804-215 2004-804-250 2004-804-309 2004-804-312 2004-804-315 2004-804-400 138.1 71°. 23.368N 126°.43.112W 442 139.2 70°.02.7N 126°. 17.8W 236 139.3 70°.19.248N 124°.50.320W 95 139.4 70°. 32.319N 124°.21.95W 241 140.1 70°.45.429N 123°. 53.429W 430 140.2 70°. 58.450N 123°. 24.900W· 297 140.4 70°. 27.095N 125°.25.386W 193 NO; ~ 138.5 71°.07.52N 125°.50.0IW 397 138.6 71°. 18.11. 5N 125°. 11.534W 307 139.1 71°.29.155N 124°.32.583W 224 137.4 70°. 54.991N 128°. 55.987W 36 2004-804-403 137.5 71°.06.777N 128°. 18.302W 59 2004-804-406 2004-804-409 2004-804-412 2004-804-415 2004-804-609 2004-804-650 2004-804-709 2004-804-71 1 2004-804-712 2004-804-718 2004-804-750 2004-804-803 2004 -8 04 -8 0 5 2004-804-809 2004-804-850 2004-804-906 2004-804-909 2004-804-912 137.6 71°. 18.66N 127°.41.9IW 179 138.2 7Io.30.70N 127°.05.53W 387 138.3 71°. 41.992N 126°.28.649W 390 138.4 137.2 137.1 135.6 71°. 54.455N 125°. 52.092W 70°.56.58N 130°.31.38W 71°. 18.558N 131°. 37.148W 70°. 57.811N 133°. 47.025W 56 44 241 87 135.5 70°.49.427N 133°.48.199W 77 135.4 70°.41.37N 133°.40.84W 70 135.3 70°. 10.196N 133°.32.047W 45 137.3 71°.20.753N 134°.08.609W 1087 135.2 70°.38.169N 135°.55.04IW 237 133.6 70°.23.57IN 135°.25.214W 66 135.1 70°.05.7N 135°.20.48W 42 133.4 70°. 32.889N 137°.36.00W 1071 133.3 70°.01.145N 138°.35.817W 272 133.2 69°.45.16N 138°.16.296W 169 133.1 69°.29.25N 137°. 56.43W 54 609 2821 2959 2496 964 -0.1 32.5 6.6 28.3 8.6 -1.4 32.7 4.5 -0.4 32.5 6.2 0.1 32.4 5.9 0.1 32.4 5.3 0.3 31.9 5.4 0.331.94.2 0.1 32.4 3.7 -0.1 32.5 6.3 0.331.96.0 0.3 31.9 2.9 -1.4 30.4 5.3 28.1 9.8 27.8 8.6 26.8 8.6 27.0 8.6 27.9 8.6 28.2 8.8 28.2 8.6 28.5 8.6 28.3 8.6 27.9 8.6 26.1 8.9 -1.6 32.5 4.8 27.0 8.9 -1.6 32.7 4.3 -1.6 32.7 3.3 -1.4 32.7 3.2 -1.4 32.7 -1.4 30.4 -1.4 31.3 -1.5 30.7 3.0 5.3 4.1 5.2 -1.5 30.7 5.8 -1.5 30.7 6.0 -1.5 30.7 6.3 -1.6 30.8 2.7 -1.4 30.4 5.9 -1.4 30.4 6.3 -1.4 30.4 6.5 -1.2 30.3 4.9 -1.5 30.3 4.4 -0.7 30.0 4.9 -0.7 30.0 5.6 28.4 8.9 28.7 9.8 28.5 9.8 28.3 9.8 26.1 8.9 27.0 8.9 21.6 8.9 21.9 8.9 21.4 8.9 19.8 8.9 19.2 10.0 19.2 10.0 18.2 10.0 18.1 10.0 18.9 9.6 17.8 . 9.0 15.2 9.0 15.1 9.0
1.4 Results and Discussion
Figure 2. Distribution map of dinocyst concentrations (cyst/g) in the study area. The dashed line illustrates the maximum extent of the Mackenzie River plume.
The region of the Mackenzie Shelf shows a concentration of dinocysts between 600 and 7000 cysts/g, with an average of about 3681 cysts/g. The smallest concentrations (between 600 and 1860 cysts/g) are found in the plume are a of the Mackenzie River (Fig. 2). The concentrations increase toward the slope and to the east in Amundsen Gulf,
where the highest concentrations (between 6300 and 7000 cysts/g) are recorded. Using the 210Pb measurements performed on short sediment cores from the Mackenzie Trough (Richerol et al., Unpublished data) and the data from Cochrane and Amiel (2006, personal communication) on the Mackenzie Shelf and Slope, we can estimate a sediment accumulation rates for our region, which range between 0.011 and 0.119 cm/year (0.051 cm/year on average) for the Mackenzie Shelf, and up to 0.226 cm/year (average of 0.081 cm/year) for the Mackenzie Trough, and a range between 0.004 and 0.037 cm/year (0.023
cmlyear on average) for Amundsen Gulf. This enables us to estimate average dinocyst
fluxes on the order of 60 cysts/cm2/year on the Mackenzie Shelf (~75 cysts/cm2/year for the
Mackenzie Trough) and 58 cysts/cm2/year in Amundsen Gulf. The Labrador Sea and Gulf
of St. Lawrence are considered as high dinoflagellate productivity area, and the estimated
dinocyst fluxes for these regions vary between 10 and 100 cysts/cm2/year (de Vernal and
Giroux, 1991; Rochon and de Vernal, 1994). In contrast, the dinocyst fluxes in central
Baffin Bay and south-central Labrador Sea are very low, less than 1 cyst/cm2/year (Rochon
and de Vernal, 1994). Therefore, the dinocyst fluxes from our study area are amongst the
higher in the Arctic and Subarctic areas. Moreover, the study area is dominated by the cysts
of autotrophic dinoflagellates. The maximum abundance of cysts of heterotrophic dinoflagellates is found on the Mackenzie River Plume.
As for reworked palynomorphs, the highest concentrations are found in Amundsen
Gulf (~221 reworked palynomorphs/g), primarily in the area of Cape Bathurst Polynya
(~251 reworked palynomorphs/g). On the Mackenzie Shelf (~179 reworked
palynomorphs/g), the concentrations gradually increase from the coast to the slope.
Nonetheless, relatively high values (~178 reworked palynomorphs/g) are found in
Table 2. List of dinoflagellate taxa present in our sampi es, and their code name.
Dinocyst name
Ataxiodinium choane Brigantedinium spp.
Brigantedinium cariacoense Brigantedinium simplex Echinidinium spp.
'lmpagidinium pallidum lslandinium minutum
lslandinium minutum var. cezare
Nematosphaeropsis labyrinthus Operculodinium centrocarpum
Operculodinium centrocarpum short spines Operculodinium centrocarpum var. arctic Pentapharsodinium dalei
Polykrikos spp.
Polykrikos var. arctic Polykrikos quadratus Polykrikos schwartzii
Protoperidinium americanum
'Sele~opemphix quanta Spinifèrites spp.
Spinifèrites elongatus Spiniferites frigidus Spinifèrites ramosus Votadinium spp. Code name Acho Bspp Bspp Bspp Espp Ipall Imin lmic Nlab Ocen Ocen Ocen Pdal Pspp Parc Parc Psch Parne Squa Sspp Selo Selo Sram Yspp
A total of 24 dinocyst taxa were identified in the samples (Table 2). Yet, 6 taxa make
up more than 95% of the total dinocyst counts (Table 3, Fig. 3): Operculodinium
centrocarpum s.l., Pentapharsodinium dalei, Spiniferites elongatus/frigidus, Islandinium
minutum s.l., and Brigantedinium spp. We have combined them in the same way than the
dinocyst database of the GEOTOP. Operculodinium centrocarpum s.l., includes 0.
centrocarpum sensu Wall and Dale 1966, 0. centrocarpum short spines (with short,
truncated processes), and 0. centrocarpum var. arctic, according to de Vernal et al. (2001).
Of the three morphotypes, 0. centrocarpum sensu Wall and Dale 1966 was the most
distribution, S. frigidus being the most abundant. Moreover the y seem to show a
morphological gradation (the flange between the processes is more developed in S.
frigidus). Islandinium minutum s.1. includes the varieties minutum and cezare, the latter being the less abundant. Brigantedinium spp. includes B. simplex and B. cariacoense, two
species that are distinguishable by the shape of the archeopyle, in addition to specimens of round brown cysts for which the archeopyle was not visible on the slides.
Table 3 Relative abundance (%) of dinoflagellate cyst taxa in our samples.
Aeho Ipall Nlab Oeen Pdal Sram Selo Sspp' Imin Imie Espp Pame Bspp Squa Vspp Parc Psch Pspp Station nwnber
2004-804-106 0.0 0.0 0.0 20.9 71.8 0.0 0.7 0.0 2.0 0.3 0.0 0.0 2004-804-109 0.0 0.0 0.0 36.3 51.3 0.0 3.0 0.0 1.0 1.0 0.0 0.0 2004-804-115 0.0 0.0 0.0 56.7 26.8 0.0 ' 2.9 0.0 4.5 1.0 0.0 0.0 2004-804-118 0.0 0.0. 0.0 66.9' 18.2 0.3 2004-804-124 0.0 0.0 0.0 39.2 29.9 0.3 2004-804-200 0.0 0.0 0.0 50.5 33.0 0.0 2004-804-206 0.0 0.0 0.0 48.9 36.4 0.0 5.2 0.0 1.3 1.0 0.0 4.5 0.0 10.0 11.9 0.0 4.6 0.0 3.3 1.0 0.0 2.5 0.0 2.5 1.6 0.0 2004-804-209 0.0 2004-804-212 0.0 2004-804-215 0.0 2004-804-250 0.0 2004-804-309 0.0 2004-804-312 0.0 2004-804-315 0.0 2004-804-400 0.0 2004-804-403 0.0 2004-804-406 0.0 2004-804-409 0.0 2004-804-412 0.0 2004-804-415 0.0 2004-804-609 0.0 2004-804-650 0.0 2004-804-709 0.0 2004-804-711 0.0 0.0 0.0 57.7 25.0 0.0 3.8 0.0 2.6 2.9 0.0 0.0 48.9 35.9 0.0 2.3 0.0 4.2 2.3 0.7 0.0 46.4 33.0 0.0 0.0 0.0 39.2 24.5 0.0 0.0 0.0 47.3 33.2 0.0 0.0 0.3 53.3 29.7 0.3 0.0 0.0 63.7 21.3 0.0 7.8 0.0 3.3 1.3 2.2 0.3 8.2 3.8 4.1 0.0 7.2 1.5 2.8 0.3 5.8 1.4 8.1 0.0 3.0 0.6 0.0 0.0 20.2 55.4 0.0 0.6 0.0 0.0 37.7 19.4 0.0 . 3.5 0.0 0.0 33.4 37.9 0.0 : 3.5 0.3 0.0 48.5 23.9 0.0 3.3 0.3 0.0 41.3 36.4 0.0 3.6 0.0 16.0 3.5 0.0 16.8 9.7 0.0 Il.5 4.8 0.0 13.0 5.0 0.0 9.9 3.3 0.0 0.0 54.2 25.7 0.3 6.0 0.0 5.7 1.5 0.0 0.0 46.1 23.4 0.0 4.7 0.0 0.0 31.4 44.0 0.0 ' 4.1 0.0 0.0 39.1 26.9 0.0 5.1 0.0 7.0 3.1 0.0 5.0 6.0 0.3 17.0 1.8 0.0 0.0 37.7 19.0 0.0 2.8 0.0 18.4 4.3 2004-804-712 0.0 0.0 0.0 39.7 21.9 0.0 2004-804-718 0.0 0.0 0.0 40.7 34.8 0.0 2004-804-750 0.0 0.3 0.0 37.5 22.0 0.0 2004-804-803 0.3 0.3 0.0 50.5 19.2 0.0 2004-804-805 0.0 0.7 r 0.0 40.5 27.0 0.0 2004-804-809 0.0 0.0 0.0 39.9 18.3 0.0 2004-804-850 0.0 0.0 0.0 46.8 21.6 0.0 2004-804-906 0.0 0.0 0.3 47.2 34.3 0.0 2004-804-909 0.0 0.0 0.0 49.0 23.4 0.0 2004-804-912 0.0 0.0' 0.0 45.1 21.4 0.0 3.5 0.0 17.1 2.3 3.3 0.0 6.2 ' 2.3 5.6 0.0 15.8 3.9 2.6 0.0 9.8 5.5 4.1 0.0 8.1 2.7 2.7 1.7 21.3 1.7 2.7 0.3 15.6 6.6 1.3 0.7 9.6 1.7 3.9 0.0 8.6 3.9 1.6 2.0 18.1 1.6 0.0 0.0 0.0 0.3 0.0 0.0 0.0 0.0 0.0 0.0 0.0 0.0 0.9 0.0 0.0 0.0 0.0 0.0 0.0 0.0 0.0 0.0 0.0 0.0 0.0 0.0 0.0 0.0 0.3 0.3 0.0 0.0 0.3 0.0 0.0 0.0 0.0 0.0 0.0 0.6 0.0 0.0 0.0 0.0 0.0 0.0 0.0 0.0 0.0 0.0 0.0 0.3 1.4 0.0 0.0 0.0 0.0 0.0 4.3 0.0 0.0 0.0 0.0 0.0 5.0 0.0 0.0 1.7 0.7 0.0 5.4 0.0 0.0 2.9 0.0 0.0 5.5 2.6 6.3 7.5 0.0 0.0 0.0 0.0 0.0 0.0 0.0 0.0 6.4 0.0 3.1 0.0 4.6 0.0 18.5 0.0 4.9 0.0 3.9 0.0 2.1 0.0 4.2 0.0 8.4 0.0 6.1 0.0 5.0 0.0 3.3 0.0 4.8 0.0 0.0 0.0 0.0 0.0 0.0 0.0 0.0 0.0 0.0 0.0 0.0 0.0 0.0 13.7 0.0 0.0 8.2 0.0 0.0 8.1 0.0 0.0 15.6 0.0 0.3 12.6 0.0 0.0 12.5 0.0 0.0 13.5 0.0 0.0 10.4 0.0 0.0 14.2 0.0 0.0 14.6 0.0 0.0 5.6 0.0 0.0 5.0 0.0 0.0 10.5 0.3 0.0 9.2 0.0 0.0 1.6 0.6 1.0 0.6 1.3 1.1 2.3 2.8 1.3 1.9 0.6 0.0 1.9 0.6 0.3 1.2 0.9 1.6 0.3 0.6 1.8 2.9 0.3 1.3 0.7 1.4 0.0 0.3 0.0 0.3 0.3 0.0 0.6 0.0 0.0 0.3 1.7 0.7 0.3 0.0 0.3 0.3 0.0 1.9 0.3 0.3 0.0 0.0 0.4 0.6 1.2 0.0 0.0 0.0 0.0 0.3 0.0 0.0 0.3 0.0 0.0 0.3 0.0 0.0 0.0 0.0 0.0 0.3 0.0 0.0 0.5 0.0 0.3 0.0 0.0 1.9 0.3 0.6 0.0 0.0 0.3 0.0 0.0 0.0 0.0 0.0 0.0 0.0 0.0 0.0 0.0 0.0 0.3
1/) c:: o ;::; rc ",.
l
fi. ",'Ii ... 0 ~ <J'h.
l
'&~ ~o <J::; ~ d~ :~~fF 912 '403 '718 609'Cjii._ 8051
250 711m~
750 909 803 650 '406 412 118 115 ,209 '906 '200 206 415 ..-c::==-124 409 106 109
lË5
==r-m~ 309 215 312 ~ :§ ~
l
'&~ ",0 ,§ ~ ~ ~ ~ ::;'" .~ ~{iJ § ::;" ~ ~()j ~o lb lb" ... ",.l
;;' ~ 9' ~ .~ § ~ .",Ib .~ ~ c:;f
l
'&~ ,§' ~ ~ ~"
qj ~()j ~ ~ ~ ::;'l> >..I:i-~ /:! 'l> ~ ~ ~ ~ ct :~ ~ ~l
Ji ~ .~ ~ ~ Q.0 Sea·ice Coyer Temperature (OC) (months/year) -2 0 2 4 6 8 8 ~'" m ""'" =:. 0....-"""";-
.
~-~ ~- Oi...: 0 . . . - '"----9 10 0 Euclidean Distance ûi tU >.-U-OgE
.- <Il O V ) V)«
2000 4000 6000la
~Ib
le
Il
Figure 3 Relative abundance of selected dinoflagellate cyst taxa, sea surface parameters (temperature and sea ice cover)
Statistical analysis with PRIMER vS enabled us to detennine the presence of two main assemblages and three sub-assemblages (Fig. 3). The first assemblage (1) includes the
stations of the Mackenzie Shelf and Slope, with some stations in Amundsen Gulf. It is
made up of three sub-assemblages (la, lb, le). The abundances of Operculodinium
centrocarpum s.l. and Pentapharsodinium dalei are the highest in this first assemblage, but
it is mostly characterized by the onshore-offshore decrease of Islandinium minutum s.l. and
Brigantedinium spp. abundances. Assemblage la includes the stations located near the
coast, which are under the influence of the river's plume. It is characterized primarily by
the maximum abundance of 1 minutum s.l. and Brigantedinium spp. Assemblages lb and le
consist of the stations for which the plume's influence is lower and in which marine
influence is dominant. Assemblage lb is characterized by the species 1 minutum s.l.,
Brigantedinium spp. and a highest abundance of Polykrikos sp. Arctic morphotype 1 and II
(quadratus) sensu de Vernal et al., 2001. We distinguish the Arctic morphotypes 1 and II
(quadratus) by the shape of the cyst, the latter being characterized by a thinning in the
equatorial area and by processes concentrated at the polar extremities of the cyst. The
Assemblage le is characterized by a lower abundance of 1 minutum s.l. and Brigantedinium
spp. and an increase in the abundance of 0. centrocarpum s.l., P. dalei and Polykrikos var.
arctic/quadratus. The second assemblage (II) consists of the stations in Amundsen Gulf,
which are more specifically located in the Cape Bathurst Polynya. We found the highest
abundances of 0. centrocarpum s.l., P. dalei, Spiniferites elongatus/frigidus and Polykrikos
schwartzii in this second assemblage. It is characterized by the lowest abundance of 1
The latter is distinguished from other Polykrikos species by having more developed and evenly distributed processes.
le
..
Polykrikos schwarlzlf
;
Spfnlfrultes e/ongiJtusHrigidus
i  , , i Pentapharsodlnium da/el - - - --,...=-=-c- - - --- ----Tfeb
..
Brigantedinium .pp. Polylu
..
ilcosvar. arcticJquadratus
Taug
1.5~----~---+----~---~----~
Figure 4 Graph of the Canonical Correspondence Analysis (CCA) between the dinocyst species and the sea-surface parameters. Tfeb = sea-surface temperature of February; Taug =
sea-surface temperature of August; !ce = sea-ice coyer duration.
The distribution of dinoflagellate cyst assemblages is closely linked to that of sea surface parameters (Fig. 3-4). For instance, for Assemblage II, which is located in the Cape Bathurst Polynya (Fig. 5), the surface temperatures in February are >O°C, which is not the case for the other assemblages. A few other stations in Assemblage Ic (118, 115, 209 and 206) and one station in Assemblage lb (250) are also characterized by temperatures above the freezing point in winter (February) and lie at the southem limit of the polynya. Likewise, these stations and those of Assemblage II show the lowest sea ice duration
The CCA (Fig. 4) illustrates a positive correlation between the abundance of Islandinium minutum s.l. and the sea-ice cover. This correlation is weaker with Brigantedinium spp., which have a worldwide distribution and is not directly influenced by the presence of sea ice. Their association with sea ice in this particular situation is most likely due to the relationship between its food source (e.g. ice algae) and sea ice. The decrease of these two groups of dinocyst is consistent with a decrease of sea-ice cover and increased February temperatures (Fig. 3).
Figure 5. Surface distribution of dinocyst assemblages in the study area. The dashed lines indicate uncertainties in defining assemblage zones.
The distribution of the cysts of heterotrophic taxa is shown in Figs. 6-7-8.
Islandinium minutum s.l. is the most abundant on the Mackenzie Shelf, mostly on the slope,
and at the mouth of Amundsen Gulf (~16.5% relative abundance), with a maximum relative
abundance of 26.5%. The lowest abundances are recorded along the Tuktoyaktuk Peninsula
Brigantedinium spp. (-18.5%) is found under the influence of the Mackenzie River plume. Polykrikos var. arctic/quadratus is found throughout the study area, but presents a very low abundance (maximum of -2.9%).
Figure 6. Distribution map of the relative abundance of Islandinium minutum s.l. ln
Figure 7. Distribution map of the relative abundance of Brigantedinium spp. in surface sediments from the study area. The thin dashed lines indicate uncertainties in defining percentage zones, and the thick da shed line indicates the maximum extent of the Mackenzie River plume.
Figure 8. Distribution map of the relative abundance of Polykrikos arctic/quadratus in surface sediments from the study area. The dashed lines indicate uncertainties in defining percentage zones.
The cyst distribution of the autotrophic taxa is shown in Fig. 9-10-11.
Operculodinium centrocarpum s.l. has a maximum abundance (~66.9%) in Amundsen
Gulf, in the area of the Cape Bathurst Polynya. Its minimum abundance is approximately 20.2% in the central part of Amundsen Gulf and along the slope, just outside Amundsen Gulf. Pentapharsodinium dalei seems to have a distribution that depends primarily on
distance from the coast. The lowest abundances (~23.3%) are recorded near the coast and
under the influence of the Mackenzie River plume. The highest abundance (~71.8%) is
found in the central and innermost part of Amundsen Gulf. The species S.
elongatus/frigidus are present in low abundance throughout the study are a (~3.6%), and are
found mostly along the shelf edge in Amundsen Gulf with maximum values of more than 5% in the polynya.
Figure 9. Distribution map of the relative abundance of Operculodinium centrocarpum
s.l. in surface sediments from the study area. The dashed lines indicate uncertainties
Figure 10. Distribution map of the relative abundance of Pentapharsodinium dalei in surface sediments from the study area. The thin dashed lines indicate uncertainties defining percentage zones, and the thick dashed line indicates the maximum extent of the Mackenzie River plume.
Figure Il. Distribution map of the relative abundance of Spiniferites elongatus/frigidus in
surface sediments from the study area. The dashed lines indicate uncertainties defining percentage zones.
In general, the abundance of autotrophic taxa is higher than that of the heterotrophic taxa throughout the study area. A closer examination of the distribution of the
Autotrophic/Heterotrophic (AlH) ratio (Fig. 12) indicates that it increases away from the
mouth of the Mackenzie River. On the Mackenzie Shelf, the AlH ratio is approximately 3;
it is greater than 5 in Amundsen Gulf, with a maximum of 14 in the Cape Bathurst Polynya. In this area, the reduced sea-ice cover and upwelling of warrner water stir up the nutrients that have precipitated onto the bottom. This phenomenon promotes the development of
phytoplankton blooms, including autotrophic dinoflagellates (Arrigo and van Dijken,
2004). Because of the competition between diatoms and autotrophic dinoflagellates,
polynyas are usually characterized by the dominance of heterotrophic dinoflagellates (Lewis et al., 1990; Hamel et al., 2002; Radi and de Vernal., 2004; Radi et al., 2007).
However, in sorne polynyas, like that of Cape Bathurst, blooms occur in cold water and
there is a decrease of the grazing rate due to the low temperatures and the food-web is
predominantly under "bottom-up" control. So, the productivity of the polynya is controlled
by the resource limitation (the nutrients), which results in the dominance by autotrophic
dinoflagellates and consequently, their cysts (Arrigo and van Dijken, 2004). Although
dominant throughout the area, the autotrophic taxa have the highest abundance in Amundsen Gulf, in the Cape Bathurst Polynya, where the annual ice cover is the lowest and
turbidity is minimum. The productivity of the polynya varies from year to year (between 90
and 175 g C/m2/year for the years from 1998 to 2002); however, it can be ranked among the
Figure 12. Distribution map of the Autotrophic/Heterotrophic ratio.
The distribution of nutrients on the Mackenzie Shelf varies substantially from season to season, as do es productivity. The main source of nutrient influx in the area is the Mackenzie River. During the winter, because of the ice cover, the nutrients carried by the river lie under the ice, at the mouth of the river, and are used primarily by ice algae, which grow on the underside of the ice (Carmack et al., 2004). In spring and summer, the main primary producers are diatoms and flagellates (e.g. Etlglena sp., Chlamydomonas sp.; Hsiao and al., 1977; Hill et al., 2005), while dinoflagellates account for only 5% of the total primary production (Homer, 1984). A relatively important primary production by marine diatoms was measured at the mouth of the Mackenzie River (~1 0 mgC/m3/h) in early June after the ice melted (Parsons et al., 1989). Diatoms are mostly found in the nutrient-rich
surface waters near the mouth of the river. This productivity decreases with increasing distance from shore. In addition, the turbidity of the plume interferes with the penetration of light for autotrophic species, thus creating conditions that tends to favor the heterotrophic
dinoflagellate speCles. For example, Brigantedinium.spp. is a group of ubiquitous, and probably opportunistic, species from epicontinental environments (de Vernal et al., 2001).
That may explain why their greatest abundance (~18.5%; Fig. 7) is under the influence of
the Mackenzie River plume where they can feed. Heterotrophic dinoflagellates feed primarily on diatoms and other dinoflagellates (Hsiao et al., 1977; Subba Rao and Platt,
1984; Jacobson and Anderson, 1986; Parsons et al., 1988; Parsons et al., 1989; Jacobson and Anderson, 1992). Therefore, the productivity from diatoms (~50 g C/m2; Macdonald et al., 1998) would provide an easily accessible food supply for them. A similar situation was also observed in the Laptev Sea in the western Arctic (Cremer, 1998; Kunz-Pirrung, 2001). After the ice melt, nutrients carried by the river are in surface waters, within the plume, and they gradually become trapped below the thermocline further offshore (Hsiao and al.,
1977). So, productivity from diatoms occurs after the ice melt, near the surface, but decrease offshore where the nutrients are not availables below the thermocline and the
euphotic zone.
Macdonald et al. (1998) estimated the burial of organic carbon within the Mackenzie ShelfiSlope sediments. They showed that less than 10% of the annual production of the delta and ~2% of that of the shelf are incorporated in the sediment. The rest is either
recycled within the water column or in the sediment, or exported offshore in the deeper part of the basin. Even though dinoflagellates contribute only a minor fraction to the organic carbon flux toward the sediment, they constitute a relatively important fraction of the organic carbon preserved in marine sediments (Parsons et al., 1984; Hillaire-Marcel et al.,
polymer. As such, the y constitute an important indicator of primary production and will prove extremely helpful in future works on the recent paleoceanography and paleoproductivity of the area.
1.5 Conclusion
The study of assemblages of dinocysts from 34 samples of surface sediments on the Mackenzie Shelf and in Amundsen Gulfhas produced the following information:
- The highest concentrations of dinocysts are found in Amundsen Gulf and mcrease gradually away from the Mackenzie River plume.
- Two main assemblages were identified statistically:
- Assemblage l, which is located on the Mackenzie Shelf and in southern Amundsen Gulf, displays the maximum abundance of heterotrophic taxa. Their abundance decreases gradually away from the plume, along a South to North and West to East gradient.
- Assemblage II, which is characterized by the maximum abundance of autotrophic taxa, is located in the Cape Bathurst Polynya, which is characterized by a lower sea ice cover and a higher productivity.
- The dinocysts of autotrophic taxa are dominant throughout the study area. Nevertheless, the maximum concentration of heterotrophic taxa is observed in the area influenced by the Mackenzie River plume, where turbidity interferes with light penetration for autotrophic taxa and diatoms released by the ice melting increases feeding opportunities for heterotrophic taxa.
CHAPITRE 2
Évolution des conditions des eaux de surface au cours des
derniers 1000 ans dans la fosse du Mackenzie, mer de Beaufort
(Canada).
Soumis en anglais et accepté pour publication dans le numéro spécial Dinocysts de la revue Marine Micropaleontology, sous réserve de corrections majeures, le 12 Octobre 2007.
2.1. INTRODUCTION
Les récents changements climatiques observés dans le monde ont poussé l 'homme à
s'interroger sur l'impact de ses actions. Dans le but de mesurer cet impact, les scientifiques
se sont penchés sur l'étude d'indicateurs naturels des conditions climatiques. Afin d'avoir
un point de comparaison, ils ont cherché à reconstituer les climats passés. Ces études ont
permis de mettre en évidence des cycles climatiques que l'on comprend encore mal à
l'heure actuelle. Plus on récoltera de données sur les cycles climatiques passés, plus leur
compréhension sera à notre portée.
L'étude des variations climatiques dans l'Arctique canadien, à des échelles de temps comprises entre 10 et 10 000 ans était l'un des objectifs de la Mission CASES (Canadian
Shelf Exchange Study) à l'été 2004. Pour cela, la reconstitution des conditions des masses
d'eau de surface basée sur les assemblages de kystes de dinoflagellés (=dinokystes), qui
sont d'excellents indicateurs des conditions de surface (température, salinité, couvert de
glace, productivité primaire), a été utilisée. Les dinoflagellés sont un groupe d'algues
unicellulaires microscopiques biflagellées dont certaines, à l'origine de marées rouges,
peuvent être toxiques. Dans leur cycle de vie, certaines de ces algues possèdent une phase
de dormance pendant laquelle elles s'enkystent. Elles produisent un kyste, sorte de
« coquille» dont la membrane est composée d'un polymère très résistant la dinosporine,
L'objectif principal de cet article est la reconstitution des conditions passées de
température et salinité des eaux de surface et de la durée du couvert de glace à partir des
assemblages de dinokystes déterminés dans trois séquences sédimentaires prélevées selon
un transect Nord-Sud dans la fosse du Mackenzie. Cette fosse, située à l'embouchure du
fleuve Mackenzie, possède les plus forts taux de sédimentation de toute la zone d'étude,
permettant des reconstitutions de -200 à -1000 ans dans le passé. La chronologie de nos
carottes permet la reconstitution des changements climatiques pour la période
post-industrialisation (de 1850 à 2004 AD (Anno Domini = après Jésus Christ)), le Petit Âge
Glaciaire (Little Ice Age - LIA, -1550-1850 AD) et le dernier millénaire. Ces séquences
sédimentaires nous donnent donc un aperçu plus précis de la période temporelle pendant laquelle l'action de l'homme s'est fait le plus sentir et nous pennettent une comparaison
avec des conditions passées « naturelles» (sans intervention humaine). Elles permettent
ainsi de mettre l'accent sur la tendance climatique actuelle depuis l'intervention significative de l'homme au début de l'Ère Industrielle, de même que les changements climatiques associés au Petit Âge Glaciaire.
2.2 MATÉRIELS ET MÉTHODES
....
• 1
, , 1
o
100 200 kmFigure 1 Carte de la mer de Beaufort depuis la fosse du Mackenzie jusqu'au golfe d'Amundsen : courants de surface et hydrographie de la région. La zone en violet représente la zone d'influence de la plume du fleuve Mackenzie et la ligne pointillée délimite la zone de la polynie du Cap Bathurst. Les points noirs représentent la localisation
des 3 stations où les carottes ont été prélevées.
2.2.1 Échantillonnage
L'échantillonnage en mer de Beaufort a eut lieu à l'été 2004 lors du Leg 8 de la mission CASES. Les 3 séquences sédimentaires ont été prélevées à l'aide de tubes de pvc
(chlorure de polyvinyle) enfoncés dans la benne du carottier à boîte. La carotte
2004-804-912A (latitude 69° 29.25N, longitude 137° 56.43W, profondeur 54m, longueur 39cm) a été prélevée le plus près de la côte, la carotte 2004-804-909B (latitude 69° 45.16N, longitude
et la carotte 2004-804-906B (latitude 70° 01.145N, longitude 138° 35.817W, profondeur 272m, longueur 34cm) a été prélevée la plus au large (Fig. 1). Par la suite, les 3 carottes ont été décrites et échantillonnées en continu selon un intervalle de 1 cm au Bedford Institute of Oceanography à Dartmouth en Nouvelle-Écosse. Les analyses palynologiques ont été réalisées selon un intervalle de 2 cm. Cependant, l'échantillonnage pour le comptage de Halodinium sp. a été pratiqué au centimètre, pour les huit premiers centimètres de la carotte 906B. Chaque échantillon a ensuite été traité selon la méthode palynologique standard décrite par Rochon et al. (1999). Pour les reconstitutions les kyste de dinoflagellés ont été utilisés (i.e. dinokystes) comme indicateurs des conditions paléocéanographiques (température et salinité de surface pour l'été et l'hiver, durée du couvert de glace). Les dinokystes sont très utiles, particulièrement dans les environnements marins des hautes latitudes. En effet, la membrane des kystes est composée d'un polymère hautement résistant, la dinosporine, qui leur permet une bonne préservation dans les sédiments affectés par la dissolution, contrairement aux microfossiles siliceux (e.g. diatomées) ou carbonatés (e.g. coccolithes) (de Vernal et aL, 2001).
2.2.2 Tamisage
Pour chaque échantillon 5cm3 sont mesurés par déplacement d'eau dans un cylindre gradué, pesés puis versés dans un bécher. Une pastille de spores de Lycopodium clavatum de concentration connue (12100 spores) est ajoutée dans chaque bécher. Les spores