O
pen
A
rchive
T
oulouse
A
rchive
O
uverte (
OATAO
)
OATAO is an open access repository that collects the work of Toulouse researchers and
makes it freely available over the web where possible.
This is an author-deposited version published in:
http://oatao.univ-toulouse.fr/
Eprints ID:
3871
To link to this article:
doi:10.1088/0957-4484/20/43/434001
URL:
http://dx.doi.org/10.1088/0957-4484/20/43/434001
To cite this version: Lamprecht, C. and Liashkovich, I. and Neves, V. and
Danzberger, J. and Heister, E. and Rangl, M. and Coley, H M. and
McFadden, J. and Flahaut, Emmanuel and Gruber, H J. and Hinterdorfer, P.
and Kienberger, F. and Ebner, A. ( 2009) AFM imaging of functionalized
carbon nanotubes on biological membranes. Nanotechnology, vol.
20
(n° 43). ISSN 1361-6528
Any correspondence concerning this service should be sent to the repository
administrator:
[email protected]
AFM imaging of functionalized carbon
nanotubes on biological membranes
C Lamprecht
1, I Liashkovich
2, V Neves
3, J Danzberger
1,
E Heister
3, M Rangl
1, H M Coley
3, J McFadden
3, E Flahaut
4,5,
H J Gruber
1, P Hinterdorfer
1, F Kienberger
1,6and A Ebner
1 1Institute of Biophysics, J Kepler University, Altenberger Straße 69, 4040 Linz, Austria 2Institute of Physiology II, Westfaelische Wilhelms-University, Robert-Koch-Strasse 27b 48149, Muenster, Germany3Faculty of Health and Medical Sciences, University of Surrey, Guildford GU2 7XH, UK 4CNRS, Institut Carnot Cirimat, 31062 Toulouse, France
5Universit´e de Toulouse, UPS, INP, Institut Carnot Cirimat, 118, route de Narbonne, 31062 Toulouse cedex 9, France
6Agilent Laboratories Linz, Aubrunnerweg 11, 4040 Linz, Austria E-mail:ferry [email protected]@jku.at
Abstract
Multifunctional carbon nanotubes are promising for biomedical applications as their nano-size, together with their physical stability, gives access into the cell and various cellular
compartments including the nucleus. However, the direct and label-free detection of carbon nanotube uptake into cells is a challenging task. The atomic force microscope (AFM) is capable of resolving details of cellular surfaces at the nanometer scale and thus allows following of the docking of carbon nanotubes to biological membranes. Here we present topographical AFM images of non-covalently functionalized single walled (SWNT) and double walled carbon nanotubes (DWNT) immobilized on different biological membranes, such as plasma membranes and nuclear envelopes, as well as on a monolayer of avidin molecules. We were able to visualize DWNT on the nuclear membrane while at the same time resolving individual nuclear pore complexes. Furthermore, we succeeded in localizing individual SWNT at the border of incubated cells and in identifying bundles of DWNT on cell surfaces by AFM imaging.
(Some figures in this article are in colour only in the electronic version)
1. Introduction
Multifunctional carbon nanotubes (CNT) are promising for biomedical applications [1–3]. They can be used for biosensing [4] or act as nano-heaters [5, 6], temperature sensors [7] and drug-carrier systems for therapy and diagnosis at the cellular level [8, 9]. Functionalization of the outer surface of CNT with biomolecules such as nucleic acids, proteins, peptides and polymers leads to their specific internalization into the cell [10–14]. However, the exact uptake mechanism remains a controversial issue as it may well depend on cell type, bio-functionalization scheme, size of the nanotube and other factors [15–17]. In the cited publications, several uptake pathways have been discussed, such as needle-like penetration of the cell membrane, passive
diffusion across the lipid bilayers, and energy-dependent endocytosis or phagocytosis. Experiments addressing the uptake of carbon nanotubes into cells usually comprise fluorescent labeling of carbon nanotubes and subsequent detection of the dyes by means of fluorescence microscopy. Label-free observation of carbon nanotube uptake has been achieved by transmission electron microscopy (TEM) [18]. The latter data support a passive diffusion mechanism, as well as the internalization via endocytotic and phagocytotic pathways. Another technique capable of resolving details of cellular surfaces at the nanometer scale is atomic force microscopy (AFM) which has the advantage of being able to operate in liquid [19], allowing for measurements under near physiological conditions [20]. In a previous publication we have presented AFM as a useful tool for a simple and
direct assessment of CNT surface bio-functionalization [21]. Here, we report high-resolution topographic AFM images of functionalized single walled carbon nanotubes (SWNT) and double walled carbon nanotubes (DWNT) immobilized on various relevant biological membranes, including nuclear membranes and cell surfaces.
2. Materials and methods
2.1. DWNT functionalization with bovine serum albumin (BSA) and RNA
Purified DWNT [22] and BSA (Roche) were mixed with deionized water at a concentration of 0.25 mg ml−1 and
1.0 mg ml−1, respectively. The mixture was sonicated for 45 min (Bandelin Sonoplus GM70 tip sonicator, MS 73 microtip, at 20% power) under cooling in an ice bath. The DWNT BSA suspension was then filtered through centrifugal filters (nanosep, 300 kD cutoff, Pall) at around 5500 g (Eppendorf Centrifuge 5417C) and washed 5 times with deionized water to remove unbound excess BSA. After resuspension in deionized water, the concentration of DWNT was estimated to be 0.05–0.1 mg ml−1, due to losses of material at the sidewall of the filtration device and the filter membrane. The suspension was stored at 4◦C and used within 3 days. For functionalization of DWNT with RNA, purified DWNT and yeast RNA (Roche) were mixed in water with respective concentrations of 0.25 and 0.5 mg ml−1. Sonication and filtration were performed as stated above. The RNA– DWNT conjugates were resuspended in deionized water and stored at 4◦C until usage.
2.2. Functionalization of DWNT with biotinylated BSA
Biotin–BSA was prepared according to Kamruzzahan et al [23]. 5 mg (77 nmol) BSA (Roche Diagnostics) was dissolved in 0.5 ml buffer (100 mM NaCl, 35 mM boric acid, pH adjusted to 8.5 using NaOH) and 5 μl of 66 mM biotin– cap–NHS [24] in DMSO was slowly added with gentle vortexing. After 30 min reaction (with occasional gentle vortexing), the biotinylated BSA was purified by gel filtration. Functionalization of DWNT with biotinylated BSA was done with the same procedure as described for BSA–DWNT. The filtered and washed functionalized DWNT were resuspended in a 1/10 PBS solution.
2.3. Functionalization of SWNT with RNA
SWNT functionalized with RNA were prepared by adding an RNA solution to commercial SWNT (Sigma) resulting in a final concentration of 2.5 mg l−1SWNT and 2.5 mg l−1RNA. Tip sonication of the mixture was carried out six times at intervals of 10 s and followed by extensive sonication in a water bath for 1–2 h. The suspension was then centrifuged at 16 000 g (Eppendorf Centrifuge 5415R) for 50–90 min to remove impurities and large nanotube bundles. The supernatant was subsequently collected and filtered through centrifugal filters (nanosep 100 kD cutoff, Pall) to remove excess RNA molecules. The RNA–SWNT conjugates were
Figure 1. Specific immobilization of biotin–BSA-functionalized DWNT on a dense layer of avidin on mica. (a) A small scan-size topographic image of an individual biotin–BSA–DWNT specifically bound to the avidin layer is shown. White arrows mark
corresponding positions in the cross-section profile (b) below. Insets: (a) a rectangular hole was scratched into the avidin layer to expose bare mica. (b) From the cross-section profile the layer height was determined to be∼1.5 nm.
resuspended in deionized water. The final concentration of the RNA–SWNT suspension was determined by UV–vis analysis [25].
2.4. Preparation of an avidin layer and incubation with biotin–BSA–DWNT conjugates
Freshly cleaved muscovite mica was mounted in a commercial AFM fluid cell prior to AFM imaging and immersed with an avidin solution [24, 26]. The avidin solution was prepared by diluting an avidin stock solution (1 mg ml−1in PBS) with a 9:1 mixture of water and PBS (PBS*) to a final avidin concentration of 0.1 mg ml−1. The avidin molecules were immobilized onto mica via electrostatic adsorption due to their positive net charge [24]. After 20 min, the mica substrate was thoroughly rinsed with PBS*. For incubation with biotin BSA– DWNT, the fluid cell was filled with 600μl of a biotin–BSA– DWNT suspension in PBS* at a concentration of 0.2 mg ml−1 for 20 min. Before AFM imaging, the CNT containing buffer suspension was replaced by PBS*.
2.5. Preparation of nuclear membrane samples and incubation with RNA–DWNT conjugates
Preparation of nuclear envelopes was performed as described previously [27]. Briefly, oocytes were obtained by surgery of Xenopus laevis females. Stage VI oocytes were used
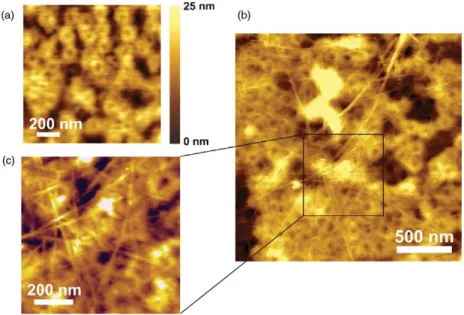
Figure 2. Topographical images of RNA-coated DWNT on nuclear envelope obtained by contact mode imaging in air. (a) Topographical image of nuclear pore complexes embedded in the nuclear membrane. (b) and (c) Medium-scale image and zoom-in of nuclear membrane covered with a net of RNA–DWNT.
for nucleus extraction. For this purpose, the oocytes were placed in nuclear isolation medium (NIM) (90 mM KCl, 26 mM NaCl, 5.6 mM MgCl2, 1.1 mM EGTA, 1.5% w/v
polyvinylpyrrolidone (PVP), 10 mM HEPES pH 7.4) and the nuclei were dissected with a pair of sharp tweezers. Nuclei were further purified from the remaining yolk by washing two times in NIM. A 200 μl drop of PVP-free NIM-buffer was placed on ethanol-cleaned glass slides. The nuclei were transferred into the drop, opened and prepared with the cytoplasmic side up using sharp needles. The samples were thoroughly washed with deionized water and air dried. For imaging of the DWNT on the surface of the nuclear envelope, 1μl of the RNA–DWNT suspension in deionized water was placed on a dry nucleus sample and the liquid was allowed to evaporate.
2.6. Delivery of RNA–SWNT conjugates to mammalian cells
HeLa cells (human cervical carcinoma cells) were cultured in 35 mm plates containing poly-L-lysine-coated cover slips using
Eagle’s minimal essential medium (MEM) containing 2 mM
L-glutamine, 0.1 mM non-essential amino acids, 10% fetal
bovine serum, and penicillin/streptomycin (100 units ml−1 penicillin and 100 μg ml−1 streptomycin in the final formulation). The medium is formulated for use with 5% CO2
in air atmosphere. When the cells reached 80% confluence, they were incubated for 3 h with RNA-functionalized SWNT diluted in medium at a concentration of ∼50 μg ml−1. After these 3 h, the medium was removed from the cells and the cells were washed several times with PBS buffer. The cells were subsequently fixed at 4◦C with 4% (v/v) paraformaldehyde in buffer (caution: as a formaldehyde releasing agent, paraformaldehyde is a suspected carcinogen) overnight. Before proceeding with AFM measurements, the cover slips were rinsed several times with PBS and air dried.
2.7. Delivery of BSA–DWNT conjugates to mammalian cells
ECV 304 cells (human urinary bladder carcinoma cells) were cultured in RPMI 1640 medium (E15-848), containing 10% fe-tal calf serum, supplemented with 1% penicillin/streptomycin and 1% 1 M HEPES (all: PAA Laboratories, Vienna, Aus-tria). Cells were passaged twice a week using a dilution of 1:2 and were maintained under air atmosphere with 5% CO2
at 37◦C. For AFM experiments, cells were seeded on cleaned (with ethanol and sterile water) glass cover slips (22×22 mm2)
with a dilution of 1:80 to obtain 50% confluence after 2 days. For imaging of DWNT on the surface of ECV cells, two dif-ferent approaches were used. (a) Cells were fixed with 4% paraformaldehyde in PBS over a period of 30 min. After wash-ing with PBS, the cells were exposed to RNA-functionalized DWNT diluted in HBSS at a concentration of∼100μg ml−1 for several hours to allow for sedimentation of DWNT on the fixed cells. Prior to AFM imaging the DWNT solution was replaced by plain HBSS. (b) After having reached 60% conflu-ence, the cells were incubated for 3 h with RNA–DWNT conju-gates diluted in medium at a concentration of∼100μg ml−1. Subsequently, the cells were washed several times with PBS buffer, fixed with 4% paraformaldehyde for 30 min, washed again, and kept in HBSS for AFM imaging.
2.8. MAC mode AFM imaging of avidin layer
Topographical imaging of biotin–BSA–DWNT incubated on an avidin layer was carried out in PBS buffer (phosphate buffered saline) at room temperature with a PicoPlus atomic force microscope (Agilent Technologies, Chandler, AZ) equipped with a conventional fluid cell. Images were acquired in magnetically driven dynamic mode (MACmode, Agilent Technologies, Chandler, AZ). AFM tips with a magnetic coating (Agilent Technologies, Chandler, AZ) and a nominal
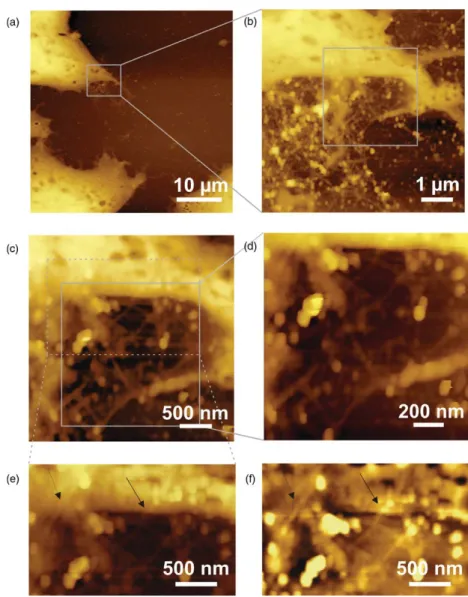
Figure 3. Topographic AFM images (logarithmic contrast) of RNA–SWNT incubated HeLa cells acquired with contact mode AFM in air. (a)–(e) Stepwise zooming-in on the border of a cell reveals a network of tangled SWNT. The image displayed in (f) shows the same region as image (e) after subtraction of a polynomial background. Black arrows mark RNA–SWNT partially extending on the cell surface.
spring constant of 0.1 N m−1 were used. The measurement frequency was set to 20% below the resonance frequency. Scanning was done with the feedback adjusted to 40% amplitude reduction at a lateral scan frequency of 1.0 Hz with 512 scan lines per image.
2.9. Contact mode imaging of nuclear membrane and cells
Topographical imaging of RNA–DWNT on a dried nuclear membrane sample was performed with a PicoPlus AFM (Agilent Technologies, Chandler, AZ) operated in contact mode at room temperature with a lateral scan rate of 1–1.5 Hz at 512 lines. AFM cantilevers with a nominal spring constant of 0.03 N m−1 (Veeco) were used. Contact mode imaging of fixed ECV cells was performed in physiological buffer (Hank’s buffered salt solution). Contact mode imaging of HeLa cells was done with a Digital Instruments dimension 3100 atomic force microscope (Veeco) under dry conditions with a lateral
scan rate of 2 Hz at 265 sample lines using cantilevers with a nominal spring constant of 0.03 N m−1.
3. Results and discussion
The goal of this study was to achieve high-resolution imaging of CNT on the surfaces of cells and organelles. In preliminary test series, the soft cell surface was mimicked by an ultraflat support to which CNT were firmly attached. For this purpose, CNT were functionalized with biotin residues and then bound to a dense monolayer of avidin (a biotin-binding protein) which had been formed on freshly cleaved mica. Spontaneous formation of avidin monolayer on mica is due to the positive net charge of avidin and the negative charge of mica at neutral pH [23]. The intactness of the avidin layer was proven by scratching a small rectangular area (200 nm×200 nm) with high force (10 nN) in order to expose bare mica (figure1(a) inset). Cross-section analysis (figure 1(b) inset) revealed a layer height of ∼1.5 nm and a surface roughness of less
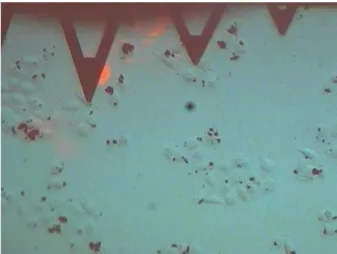
Figure 4. Camera snapshot showing nanotube incubated ECV cells on a glass support and AFM cantilevers in the upper part of the picture (triangular levers).
than 0.5 nm. Functionalization of CNT with biotin residues was achieved by irreversible adsorption of biotinylated BSA (biotin–BSA–DWNT). Figure1(a) shows a topographic image of a biotin–BSA–DWNT on a dense layer of avidin as typically obtained by dynamic mode AFM imaging. The height profile along the DWNT (figure 1(b)) shows several peaks most likely reflecting adsorbed BSA molecules. The method presented here provides optimal conditions for imaging of bio-functionalized carbon nanotubes in a (near-) physiological environment without tip-induced displacement and with the highest possible resolution.
In contrast to an artificial membrane, native biological membranes are less homogeneously structured and show significantly higher roughness. Here, the nuclear envelope presents an interesting biological membrane which, in addition, can be prepared in the form of rather flat patches. Furthermore, Porter et al [18] recently provided direct evidence that SWNT translocated across the nuclear membrane and could be found in the nucleus. Since the transport of biomolecules, such as regulatory proteins, rRNA, or mRNA into the nucleus is governed by the nuclear pore complexes (NPC) it is of particular interest to visualize binding of individual CNT to these NPCs. Figure 2shows topographic AFM images of the cytoplasmic side of the nuclear membrane recorded in contact mode under dry conditions. In figure2(a) the typical ring structures of the NPC embedded in the nuclear membrane is visible with a high density of NPCs. The inner diameter of a single NPC is about 40 nm; the outer diameter measures 120 nm. Figures 2(b) and (c) show the nuclear membrane with tightly packed NPC and a net of individual DWNT and smaller bundles lying across the NPC. Around 10– 20% of the imaged nuclear envelope surface was covered with DWNT. With the membrane preparation method implemented here it was possible to obtain very flat nuclear membrane patches. The average roughness of the underlying NPC area was 4–5 nm, while the height of individual DWNT ranged from 2 to 4 nm and the height of bundles from 6 to 15 nm. In this way the visualization of single DWNT on the nuclear
membrane was achieved while, at the same time, resolving individual nuclear pore complexes.
For transport of CNT to the nucleic region of a cell and into the nucleus, the nanotubes first have to bind to the cell surface followed by internalization. Having a possibility to observe the binding of individual CNT to the cell directly, could provide further insight into the uptake pathway of bio-functional CNT for therapeutic applications. To visualize CNT immobilized on a cell surface, HeLa cells were imaged after incubation with RNA-coated SWNT under dry conditions. Figure3shows topographic images captured in contact mode. When gradually zooming-in on the border of an isolated cell, the images showed tangled single nanotubes in close proximity to the cell border. At the edge (figure 3(e)) of the cell, some of the SWNT are found to partially extend onto the cell surface. In order to improve the visibility of the SWNT, a polynomial background was subtracted in figure3(f) in order to level the steep edge of the cell and the underlying glass slide. Furthermore, when imaging directly on the cell surface, no RNA–SWNT were observed. Scanning of several live and fixed HeLa cells showed that these cells generally grow in a rather compact form and exhibit a very soft surface. This softness obviously impairs the detection of individual CNT on top of the cell.
To meet the particular challenge of imaging small diameter CNT on cell surfaces, it is important to use flat cells which exhibit a low surface roughness and form widespread flat regions. We conducted systematic investigations on different cell lines (EAhy, DU-145 and MyEnd cells) via topographic AFM imaging of live and fixed mammalian cells to find a suitable cell line. ECV cells, a derivative of human urinary bladder carcinoma cells, grow in culture as an adherent monolayer. AFM imaging revealed the typical sizes of ECV cells in the range of 50–80μm. The nucleus region has a height of ∼3μm while the surrounding cytoplasmic area is rather flat, with a surface roughness of∼50 nm. Figure4shows a glass slide with cells at about 40–50% confluence, which were incubated with BSA-coated CNT. The triangular AFM cantilevers are visible in the upper part of the picture. The black spots are BSA–CNT aggregates and lumps. Interestingly, most lumps are located on the cells, while the bare glass seems to be free of CNT aggregates. For successful imaging, the AFM cantilever was positioned on cells without CNT aggregates to allow for imaging of individual CNT.
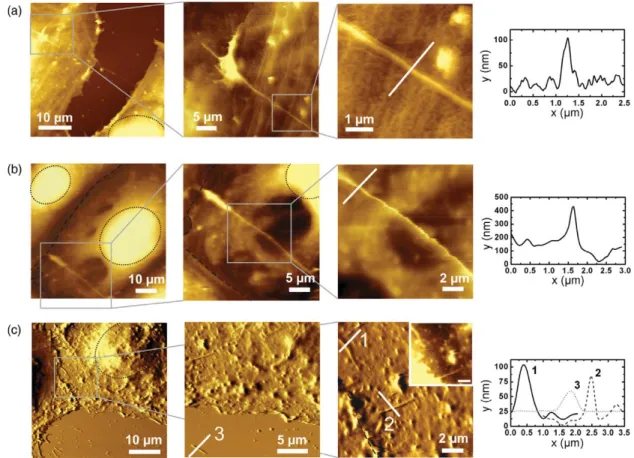
Contact mode AFM images of ECV cells incubated with BSA–DWNT acquired under near physiological conditions in buffer solution are shown in figure5. Larger bundles of CNT were typically observed on the cell surfaces. In figure5(a), a long straight structure lies atop the cell surface, with a height of about 80 nm, probably representing a bundle of DWNT. Beneath the bundle, filamentous cellular substructures can be observed (medium-scale scan) which appear in the small scan-size image as an interlaced network. The filaments range in height between a few nanometers and 50 nm, causing an average roughness valley depth of 14.5 nm and an average roughness peak height of 14.4 nm. When comparing these values to the typical dimensions of a BSA-coated DWNT with roughly 5–12 nm in height, it appears difficult to discriminate
Figure 5. Contact mode AFM images of fixed ECV cells captured in buffer solution revealing DWNT bundles on cell surfaces.
Corresponding cross-section profiles indicate the size of observed DWNT bundles. Cell nuclei are marked with black dotted lines (· · · ·), cell–cell contact regions are marked by black dashed lines (- - - -). (a) Topographic images of fixed ECV cells which were exposed to BSA–DWNT after fixation. (b) Topographic images of ECV cells which were incubated with BSA–DWNT over a period of 3 h prior to fixation. (c) Deflection images of BSA–DWNT incubated fixed ECV cells. In the medium-scale image, bundles of DWNT are visible on the cells surfaces and on the glass support lying next to the cells borders.
subcellular structures as filaments from individual carbon nanotubes.
Further examples of DWNT bundles on cell surfaces are displayed in figures5(b) and (c). In figure 5(b), a bundle of DWNT can be seen in the lower left part of the large-scale image. The bundle exhibits a height of 250–300 nm. The two bright round regions encircled in the upper left corner and in the right part of the large-scale image correspond to the nuclei of two ECV cells with a height of around 3μm. In figure5(c), the deflection images of two ECV cells are shown (nuclei and contact region of the cells are marked). In the lower part, the underlying cover slip is visible where several shorter rather straight features are observed. A zoom-in on the glass cover slip beside the cell border and flat parts of the cells between the nuclei reveals DWNT with a height of 30–80 nm. In contrast to the images in figures5(a) and (b), here the CNT bundles appear to be sticking in the cell surface which suggests a possible internalization of BSA–DWNT bundles.
4. Conclusions
We presented a method for high-resolution topographical imaging of bio-functionalized DWNT in buffer solution.
Stable immobilization of CNT on an ultraflat support was achieved by functionalization of CNT with biotinylated BSA and of mica with electrostatically bound avidin. Furthermore, we showed for the first time high-resolution topographical AFM images of DWNT on the nuclear membrane while resolving individual nuclear pore complexes. This demonstrates the potential for monitoring the transport of individual CNT through single nuclear pore complexes into the cell nucleus with the AFM, allowing for time-resolved studies with high lateral resolution. For such an experiment, an NPC transport protein, e.g. importinβ, is needed as a bio-functional coating for CNT to study the binding to an individual NPC structure in comparison with a control sample of CNT coated with a non-binding protein [28].
Our experiments with biological cells showed great differences depending on the measurement conditions, cell line and the type of functionalized carbon nanotubes. On HeLa cells, SWNT could only be seen near the cell border and lack of detection of CNT in the center region was attributed to the surface topology. In contrast, DWNT were well detectable on ECV cells, yet here only large bundles of CNT could be identified with certainty because individual DWNT could not unequivocally be discriminated from filaments of the cytoskeleton which consist of microtubules (∼25 nm
diameter), intermediate filaments (roughly 10 nm) and actin filaments (∼10 nm). For comparison, individual SWNT and DWNT have diameters ranging between 1–3 nm and 2–4 nm, respectively (without bio-functionalization). Accordingly, it was only possible to observe and identify larger bundles of CNT with diameters of 50 nm up to several hundreds of nanometers lying across cell surfaces. Although these preliminary experiments indicate certain limitations for the AFM to study binding of individual carbon nanotubes to cells and their uptake into the cell, complementary techniques may prove promising. The combination of fluorescence microscopy and AFM imaging [29] as well as simultaneous topographical and recognition imaging (TREC) [30, 31] with a ligand-functionalized AFM tip could facilitate the localization of functionalized carbon nanotubes on the cell surface and time-resolved uptake studies.
Acknowledgments
We thank Dr Kai Kr¨amer and Arthur Taylor for helpful discussions and Bettina Kenda-Nistelberger and Dr Linda Wildling for generous support with the cell culture (ECV, MyEnd, DU-145, EAhy cells). This work was supported by EC grant Marie Curie RTN-CT-2006-035616, CARBIO ‘Carbon nanotubes for biomedical applications’, by the Austrian Science Foundation ‘Doktorratskolleg FWF 01201004’ and the International Graduate School at the Westf¨alische Wilhelms-Universit¨at M¨unster (GRK 1409/1) ‘Molecular Interactions of Pathogens with Biotic and Abiotic Surfaces’.
References
[1] Bianco A, Kostarelos K and Prato M 2008 Opportunities and challenges of carbon-based nanomaterials for cancer therapy
Expert Opin. Drug Deliv.5 331–42
[2] Lacerda L, Bianco A, Prato M and Kostarelos K 2006 Carbon nanotubes as nanomedicines: from toxicology to
pharmacology Adv. Drug Deliv. Rev.58 1460–70
[3] Portney N G and Ozkan M 2006 Nano-oncology: drug delivery, imaging, and sensing Anal. Bioanal. Chem.384 620–30 [4] Wang J and Lin Y H 2008 Functionalized carbon nanotubes
and nanofibers for biosensing applications TRAC Trends
Anal. Chem.27 619–26
[5] Kam N W S, O’Connell M, Wisdom J A and Dai H J 2005 Carbon nanotubes as multifunctional biological transporters and near-infrared agents for selective cancer cell destruction
Proc. Natl Acad. Sci. USA102 11600–5
[6] Gannon C J et al 2007 Carbon nanotube-enhanced thermal destruction of cancer cells in a noninvasive radiofrequency field Cancer110 2654–65
[7] Vyalikh A et al 2008 A carbon-wrapped nanoscaled thermometer for temperature control in biological environments Nanomedicine3 321–7
[8] Prato M, Kostarelos K and Bianco A 2008 Functionalized carbon nanotubes in drug design and discovery Acc. Chem.
Res.41 60–8
[9] Liu Z et al 2008 Drug delivery with carbon nanotubes for
in vivo cancer treatment Cancer Res.68 6652–60 [10] Kam N W and Dai H 2005 Carbon nanotubes as intracellular
protein transporters: generality and biological functionality
J. Am. Chem. Soc.127 6021–6
[11] Pantarotto D, Briand J P, Prato M and Bianco A 2004 Translocation of bioactive peptides across cell membranes by carbon nanotubes Chem. Commun.16–7
[12] Nakayama-Ratchford N, Bangsaruntip S, Sun X M,
Welsher K and Dai H J 2007 Noncovalent functionalization of carbon nanotubes by fluorescein-polyethylene glycol: supramolecular conjugates with pH-dependent absorbance and fluorescence J. Am. Chem. Soc.129 2448–9
[13] Kam N W S, Liu Z A and Dai H J 2006 Carbon nanotubes as intracellular transporters for proteins and DNA: an investigation of the uptake mechanism and pathway Angew.
Chem. Int. Edn45 577–81
[14] Lu Q et al 2004 RNA polymer translocation with single-walled carbon nanotubes Nano Lett.4 2473–7
[15] Becker M L et al 2007 Length-dependent uptake of
DNA-wrapped single-walled carbon nanotubes Adv. Mater. 19 939
[16] Kostarelos K et al 2007 Cellular uptake of functionalized carbon nanotubes is independent of functional group and cell type Nat. Nanotechnol.2 108–13
[17] Lacerda L, Raffa S, Prato M, Bianco A and Kostarelos K 2007 Cell-penetrating CNTs for delivery of therapeutics Nano
Today2 38–43
[18] Porter A E, Gass M, Muller K, Skepper J N, Midgley P A and Welland M 2007 Direct imaging of single-walled carbon nanotubes in cells Nat. Nanotechnol.2 713–7
[19] Marti O, Drake B and Hansma P K 1987 Atomic force microscopy of liquid-covered surfaces—atomic resolution images Appl. Phys. Lett.51 484–6
[20] Engel A and Muller D J 2000 Observing single biomolecules at work with the atomic force microscope Nat. Struct. Biol. 7 715–8
[21] Lamprecht C et al 2009 AFM imaging of functionalized double-walled carbon nanotubes Ultramicroscopy 109 899–906
[22] Flahaut E, Bacsa R, Peigney A and Laurent C 2003 Gram-scale CCVD synthesis of double-walled carbon nanotubes Chem.
Commun.1442–3
[23] Kamruzzahan A S M et al 2006 Antibody linking to atomic force microscope tips via disulfide bond formation
Bioconjug. Chem.17 1473–81
[24] Wilchek M and Bayer EA 1990 Biotin-containing reagents
Methods Enzymol.184 123–38
[25] Jeynes J C G, Mendoza E, Chow D C S, Watts P C R, McFadden J and Silva S R P 2006 Generation of chemically unmodified pure single-walled carbon nanotubes by solubilizing with RNA and treatment with ribonuclease A
Adv. Mater.18 1598–602
[26] Ebner A, Hinterdorfer P and Gruber H J 2007 Comparison of different aminofunctionalization strategies for attachment of single antibodies to AFM cantilevers Ultramicroscopy 107 922–7
[27] Kramer A, Ludwig Y, Shahin V and Oberleithner H 2007 A pathway separate from the central channel through the nuclear pore complex for inorganic ions and small macromolecules J. Biol. Chem.282 31437–43
[28] Rangl M et al 2009 Stable non-destructive immobilization of native nuclear membranes to micro-structured PDMS for single molecule force spectroscopy ChemPhysChem 13 1553–8
[29] Madl J et al 2006 A combined optical and atomic force microscope for live cell investigations Ultramicroscopy 106 645–51
[30] Ebner A et al 2008 Determination of CFTR densities in erythrocyte plasma membranes using recognition imaging
Nanotechnology19 384017
[31] Tang J L et al 2008 High-affinity tags fused to S-layer proteins probed by atomic force microscopy Langmuir24 1324–9