Predicting gene essentiality from expression
patterns in Escherichia coli
Alexandre Irrthum2 and Louis Wehenkel1,2 1 Department of Electrical Engineering and Computer Science
2 GIGA-Research, University of Li`ege, B4000 Belgium
Abstract. Essential genes are genes whose loss of function causes lethal-ity. In the case of pathogen organisms, the identification of these genes is of considerable interest, as they provide targets for the development of novel antibiotics. Computational analyses have revealed that the posi-tions of the encoded proteins in the protein-protein interaction network can help predict essentiality, but this type of data is not always avail-able. In this work, we investigate prediction of gene essentiality from expression data only, using a genome-wide compendium of expression patterns in the bacterium Escherichia coli, by using single decision trees and random forests. We first show that, based on the original expression measurements, it is possible to identify essential genes with good accu-racy. Next, we derive, for each gene, higher level features such as average, standard deviation and entropy of its expression pattern, as well as fea-tures related to the correlation of expression patterns between genes. We find that essentiality may actually be predicted based only on the two most relevant ones among these latter. We discuss the biological meaning of these observations.
1 Introduction
Robustness or fault-tolerance is one of the defining qualities of biological organisms. For example, genome-scale gene deletion studies in yeasts and bacteria have demonstrated that most of the genes are not essential for their growth and reproduction. The identification of the essential genes is of great theoretical and practical interest. From a theoretical standpoint, these studies are necessary for the identification of the “minimal genome”, the smallest set of genes that allows an organism to survive and reproduce. From a more practical point of view, the identification of essential genes in pathogen micro-organisms is a useful first step in the development of novel antibiotics.
Because the experimental identification of these genes is a costly and time-consuming process, methods for their computational identification have been proposed. Most notably, it has been shown that the positions of the encoded proteins in the protein-protein interaction network are good
predictors of essentiality, with “hub” and “bottleneck” proteins being more often essential [8][12]. In another study, reduced stochastic fluctua-tion of expression has been associated with essential genes [6]. Finally, the importance of gene sequence features has also been demonstrated [11].
In this work, we investigate if essentiality can be predicted from gene expression data only, in the bacterium Escherichia coli.
2 Data and Methods
2.1 Data
A gene expression dataset for the bacterium Escherichia coli was ob-tained from the Many Microbes Database (http://m3d.bu.edu, [4]). This dataset contains expression data for 4217 genes across 305 experiments corresponding to various growth conditions and mutations. Some of the experiments were replicated, giving a total of 612 expression values for each gene. We also obtained gene essentiality data from the Keio Collec-tion of E. coli gene knockouts [1]. In this experiment, 4288 genes were targeted and 303 were identified as essential.
We work with the 4217 genes that are represented in both datasets, out of which 289 are labeled essential.
2.2 Feature generation
In addition to directly using the expression vectors for classification, we extracted 38 higher level features for each gene in the dataset. Features F1 to F4 are based on the expression patterns of genes considered indi-vidually, while features F5-F38 are based on the similarities between the expression patterns of a gene and other genes in the dataset.
Individual features
F1: Mean gene expression level across n = 305 experimental condi-tions mean = ¯x = 1 n n X i=1 xi,
where xi is the average expression level of the gene over the repeated
experiments of condition i.
F2: Standard deviation of gene expression level across n = 305 exper-imental conditions std = v u u t 1 n − 1 n X i=1 (xi−x)¯ 2.
F3: Shannon entropy of gene expression level across n = 305 experi-mental conditions [10] entropy = − n X i=1 pi log pi, where pi = xi Pn i=1xi .
F4: Mean within-repeats standard deviation
repeat std = 1 m m X i=1 v u u t 1 ri−1 ri X j=1 (xij−xi)2,
where m = 177 is the number of experimental conditions with repeats, ri is the number of repeats (2 or 3) for condition i, xij is the expression
level of the gene for repeat j of condition i and xi is the mean expression
level of the gene in condition i.
Global features
We use Pearson’s correlation coefficient to compute similarities be-tween two gene expression vectors x and y:
corr(x, y) = Pn i=1(xi−x)(y¯ i−y)¯ q Pn i=1(xi−x)¯ 2 q Pn i=1(yi−y)¯ 2 .
The matrix of pairwise correlations between the 4217 genes was com-puted. Correlation coefficients were transformed into dissimilarities with diss(x, y) = (1 − corr(x, y))/2 to give values in the range [0, 1].
F5-F17: Dissimilarity of the gene expression pattern with the expres-sion pattern of its k-th nearest neighbor for k ∈(1, 2, 5, 10, 20, 50, 100, 200, 500, 1000, 2000, 4000, 4216).
Next, we computed a new measure of pairwise similarity between genes, based on the notion of shared nearest neighbor (SNN, [3]). The algorithm for the computation of shared nearest neighbor similarities is:
Find the k-nearest neighbors of each gene For every pair of genes (x, y):
if x and y are not amongst each other’s k-nearest neighbors: similarity(x, y) <- 0
else:
similarity(x, y) <- number of shared neighbors endif
We generated SNN similarity matrices for k ∈(10, 20, 50, 100, 200, 500, 1000). The parameter k controls the sparsity of the resulting SNN similarity matrices, with smaller k producing sparser matrices where only highly correlated genes have non-null similarities. From the corresponding SNN similarity graphs, three additional features were extracted for each gene; degree, sum of edge weights and betweenness centrality.
F18-F24: Degree of the gene for k ∈(10, 20, 50, 100, 200, 500, 1000)
degree k(gene) = number of connections incident to the gene.
F25-F31: Sum of edge weights for k ∈(10, 20, 50, 100, 200, 500, 1000)
weight k(gene) = sum of the weights of connections incident to the gene.
F32-F38: Betweenness centrality for k ∈(10, 20, 50, 100, 200, 500, 1000) betweenness k(gene) = X s6=gene6=t∈V σst(gene) σst ,
where σst is the total number of shortest paths between genes s and
t, and σst(gene) is the number of those shortest paths that also pass
through the gene under consideration [7]. Betweenness centrality values were computed with the Boost graph library (http://www.boost.org).
2.3 Machine Learning
The gene essentiality data set is highly unbalanced, with 3928 non-essential genes for only 289 essential genes. We therefore learned the classifiers on a balanced dataset obtained by completing the 289 essential genes with a random sample of 289 non-essential ones.
For the classification of genes with respect to essentiality, we used random forests [2] with 10-fold cross-validation, implemented in the Weka machine learning workbench [5]. Hundred trees were constructed for each fold, each based on a random selection of 9 attributes at each node (from the 305 expressions), or 6 attributes (from the 38 derived features).
We also used J4.8, a variant of the C4.5 decision tree classifier [9] implemented in Weka, to determine classification performance based on the two most important features (the importances were derived from the random forest classifier).
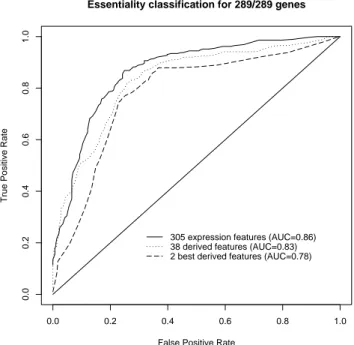
0.0 0.2 0.4 0.6 0.8 1.0 0.0 0.2 0.4 0.6 0.8 1.0
Essentiality classification for 289/289 genes
False Positive Rate
True Positive Rate
305 expression features (AUC=0.86) 38 derived features (AUC=0.83) 2 best derived features (AUC=0.78)
Fig. 1.ROC curves for the class of essential genes, with 10-fold cross validation on the balanced dataset. AUC: Area under the ROC curve.
.
3 Results and discussion
Figure 1 shows the ROC curves for the class of essential genes, based on 10-fold cross-validation on the balanced dataset. The upper ROC curve is for random forests predictions based on the gene expressions over 305 conditions. The middle curve is for random forests predictions based on the 38 derived features. Finally, the bottom ROC curve corresponds to classification performance with a single J4.8 decision tree using the two most important features derived by the random forests classifier, mean and weight 1000. These ROC curves indicate that it is possible to achieve a high precision for the detection of a subset of essential genes, with all three approaches. The AUC values show that most of the relevant information contained in the gene expressions is kept in the set of high level feature, and that the two most significant ones among them already allow to predict gene essentiality quite well.
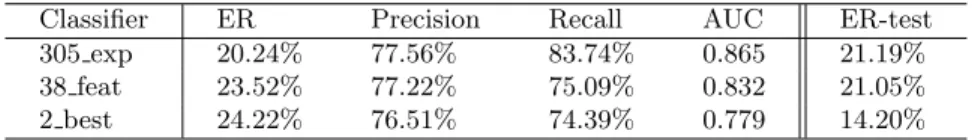
Table 1 gives a summary of the performances of the three classifiers, first on the balanced training dataset itself (using a stratified 10-fold cross-validation), and second on a testing dataset comprising the 3639
Table 1.Classifier performances on balanced dataset (10-fold cross-validation) and, rightmost column, on the non-essential genes not present in balanced dataset (classifier trained on balanced dataset). ER: Error rate.
Classifier ER Precision Recall AUC ER-test
305 exp 20.24% 77.56% 83.74% 0.865 21.19%
38 feat 23.52% 77.22% 75.09% 0.832 21.05%
2 best 24.22% 76.51% 74.39% 0.779 14.20%
non-essential genes not present in the training dataset. We observe that the classifiers derived from the balanced dataset, which use only a small fraction of the non-essential genes, maintain their accuracy on the testing dataset.
The J4.8 decision tree obtained by using the two features is as follows: mean <= 8.625629: non_essential (219/35) (leaf 1)
mean > 8.625629
| weight_1000 <= 716748
| | weight_1000 <= 447278: non_essential (77/32) (leaf 2) | | weight_1000 > 447278
| | | mean <= 9.199547: non_essential (44/21) (leaf 3) | | | mean > 9.199547: essential (107/25) (leaf 4) | weight_1000 > 716748: essential (131/12) (leaf 5)
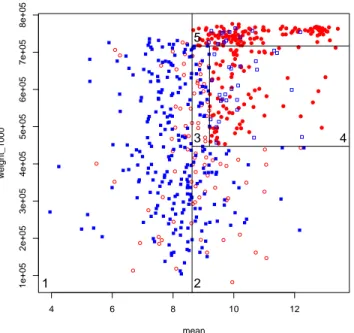
where the numerical values, e.g. (219/35) for the first terminal node, give the number of genes reaching the node, and the number of them that are misclassified, e.g. 35 essential genes classified as non-essential at the first node. Figure 2 illustrates its classification over the genes in the training set, with the delimited areas corresponding to the five terminal nodes of the tree. A preliminary analysis shows that among 36 essential genes encoding proteins of the 30S and 50S ribosomal subunits (families rps and rpl ), 32 are in the upper right area of the graph (area 5). It will be interesting to determine if, more generally, essential genes present in different regions of the plot correspond to particular classes of biological functions.
This decision tree has a meaningful biological interpretation. First, we observe that genes with high mean expression levels are more often essen-tial. In this experiment, expression is measured at the level of the mRNA and thus is related to the rate of production of the corresponding pro-tein. It is not surprising that proteins that are more actively synthesized should be more vital to the bacterium. Second, we observe that genes densely connected to other genes based on the correlation of their
ex-4 6 8 10 12 1e+05 2e+05 3e+05 4e+05 5e+05 6e+05 7e+05 8e+05 mean weight_1000 1 2 3 4 5
Fig. 2.Plot of the 578 genes in balanced dataset. Numbers 1 to 5 correspond to the numbering of the leaves in the tree. Code: circle and red: essential gene; square and blue: non-essential gene; filled symbol: correct classification; open symbol: misclassification
pression patterns (the weight 1000 feature) are also more often essential. This observation parallels the known correlation between connectivity in protein-protein interaction networks and essentiality [8]. Sets of genes with highly correlated expression patterns often belong to a same basic molecular complex, such as the RNA or the protein synthesis machineries, and such complexes are central to the functioning of the cell.
4 Conclusion
In this paper we have explored the prediction of gene essentiality from mRNA expression patterns, by applying tree-based machine learning meth-ods on an experimental dataset of genes from Escherichia coli.
Our work shows that it is indeed possible to predict essential genes based solely on expression patterns and, importantly, that this may be achieved by using only a couple of high-level global features and a very simple decision tree.
Future analyses will have to compare the prediction based on gene ex-pressions with the prediction based on protein-protein interaction data. In
a second stage, we aim at building classification models for other species. The end-goal of this research is to develop classifiers that allow to infer gene essentiality across species, so as to exploit experimental data from some species to predict essentiality of genes of other species.
Acknowledgments
This paper presents research results of the Belgian Network BIOMAG-NET (Bioinformatics and Modeling: from Genomes to Networks), funded by the Interuniversity Attraction Poles Programme, initiated by the Bel-gian State, Science Policy Office. The scientific responsibility rests with the authors.
References
1. Baba T., Ara T., Hasegawa M., Takai Y., Okumura Y., Baba M., Datsenko K.A., Tomita M., Wanner B.L., Mori H.: Construction of Escherichia coli K-12 in-frame, single-gene knockout mutants: the Keio collection. Molecular Systems Biology 2:2006.0008 (2006)
2. Breiman L.: Random forests. Machine Learning 45(1):5-32 (2001)
3. Ertoz L., Steinbach M., Kumar V.: A new shared nearest neighbor clustering algo-rithm and its applications. In Workshop on Clustering High Dimensional Data and its Applications, Proc. of Text Mine 01, First SIAM Intl. Conf. on Data Mining (2001)
4. Faith J.J., Driscoll M.E., Fusaro V.A., Cosgrove E.J., Hayete B., Juhn F.S., Schnei-der S.J., Gardner T.S.: Many Microbe Microarrays Database: uniformly normalized Affymetrix compendia with structured experimental metadata. Nucleic Acids Re-search 36(Database issue):D866-70 (2008)
5. Frank E., Hall M., Trigg L., Holmes G., Witten I.H.: Data mining in bioinformatics using Weka. Bioinformatics 20(15):2479-81 (2004)
6. Fraser H.B., Hirsh A.E., Giaever G., Kumm J., Eisen M.B.: Noise minimization in eukaryotic gene expression. PLoS Biology 2(6):0834-0838 (2004)
7. Freeman L.C.: A Set of measures of centrality based upon betweenness. Sociometry 40:35-41 (1977)
8. Jeong H., Mason S.P., Barabsi A.L., Oltvai Z.N.: Lethality and centrality in protein networks. Nature 411(6833):41-2 (2001)
9. Quinlan J.R.: C4.5: Programs for Machine Learning. Morgan-Kaufmann Publishers, San Mateo, CA. (1993)
10. Schug J., Schuller W.P., Kappen C., Salbaum J.M., Bucan M., Stoeckert C.J. Jr.: Promoter features related to tissue specificity as measured by Shannon entropy. Genome Biology 6:R33 (2005)
11. Seringhaus M., Paccanaro A., Borneman A., Snyder M., Gerstein M.: Predicting essential genes in fungal genomes. Genome Research 16:1126-1135 (2006)
12. Yu H., Kim P.M., Sprecher E., Trifonov V., Gerstein M.: The importance of bottle-necks in protein networks: correlation with gene essentiality and expression dynamics PLoS Computational Biology3(4):e59 (2007)