HAL Id: hal-03049212
https://hal.archives-ouvertes.fr/hal-03049212
Submitted on 9 Dec 2020HAL is a multi-disciplinary open access
archive for the deposit and dissemination of sci-entific research documents, whether they are pub-lished or not. The documents may come from teaching and research institutions in France or abroad, or from public or private research centers.
L’archive ouverte pluridisciplinaire HAL, est destinée au dépôt et à la diffusion de documents scientifiques de niveau recherche, publiés ou non, émanant des établissements d’enseignement et de recherche français ou étrangers, des laboratoires publics ou privés.
Insight into the Electrooxidation Mechanism of Ethylene
Glycol on Pd-Based Nanocatalysts: In Situ FTIRS and
LC-MS Analysis
Rodrigo Garcia da Silva, Adalgisa Rodrigues de Andrade, Karine Servat,
Cláudia Morais, Teko Napporn, Kouakou Kokoh
To cite this version:
Rodrigo Garcia da Silva, Adalgisa Rodrigues de Andrade, Karine Servat, Cláudia Morais, Teko Nap-porn, et al.. Insight into the Electrooxidation Mechanism of Ethylene Glycol on Pd-Based Nanocata-lysts: In Situ FTIRS and LC-MS Analysis. ChemElectroChem, Weinheim : Wiley-VCH, 2020, 7 (21), pp.4326-4335. �10.1002/celc.202001019�. �hal-03049212�
An Insight into the Electrooxidation Mechanism of Ethylene
Glycol on Pd-based Nanocatalysts: in situ FTIRS and LC-MS
analysis
Rodrigo Garcia Da Silva,[a,b] Adalgisa Rodrigues de Andrade,*[a] Karine Servat,[b] Cláudia Morais,[b] Teko W. Napporn,[b] and Kouakou B. Kokoh*[b]
[a] Dr. R. G. Da Silva, Prof. Dr. A. R. De Andrade Departamento de Química
Faculdade de Filosofia, Ciências e Letras de Ribeirão Preto Universidade de São Paulo
Ribeirão Preto 14040-901, Brazil. E-mail: ardandra@ffclrp.usp.br
[b] Dr. R. G. Da Silva, Dr. K. Servat, Dr. C. Morais, Dr. T. W. Napporn, Prof. Dr. K. B. Kokoh
Department of Chemistry
IC2MP CNRS UMR 7285, Université de Poitiers
4 rue Michel Brunet - B27, TSA 51106, 86073 Cedex 9 (France). E-mail: boniface.kokoh@univ-poitiers.fr
ORCID: 0000-0002-5379-7792
Supporting information for this article is given via a link at the end of the document.
Abstract: Ethylene Glycol oxidation reaction on nickel and ruthenium modified palladium nanocatalysts
was investigated with electrochemical, spectroelectrochemical, and chromatographic methods. These carbon-supported materials prepared by a revisited polyol approach, exhibited high activity towards the ethylene glycol electrooxidation in alkaline medium. Electrolysis coupled with High Performance Liquid Chromatography/Mass Spectrometry (HPLC-MS) and in situ Fourier Transform Infrared Spectroscopy (FTIRS) measurements allowed to determine the different compounds electrogenerated in the oxidative conversion of this two-carbon molecule. High value-added products such as oxalate, glyoxylate, and glycolate were identified in all the electrolytic solutions, while glyoxylate was selectively formed at the Ru45@Pd55/C electrode surface. In situ FTIRS results also showed a decrease of the pH value in the thin layer near the electrode as a consequence of OH- consumption during the spectroelectrochemical experiments.
1. Introduction
Ethylene glycol (EG) oxidation has long attracted interest in electrocatalysis because of its possible application in fuel cell technology, and also its conversion to value added molecules such as glyoxylic and glycolic acids. EG is an abundant and renewable resource that can be produced from cellulose.[1] As pointed out above and conversely to usual alcohols (methanol and ethanol), it has high boiling point of 198 °C making it a promising and safe candidate that can be converted by cogeneration into energy (5.2 kWh kg-1) and particularly to platform compounds for industry.[2,3] While total oxidation of this diol to CO2 (or carbonate) involves ten electrons, another route could exchange fewer electrons, but keep intact the skeleton of the molecule in order to supply energy to low-power devices and at the same time recover platform molecules. Platinum and gold-based catalysts have long been used in the first approach, leading to C-C bond cleavage products and particularly CO2.[3-16] In acid media, Xin et al.[17] have observed that for EG oxidation, Pt catalysts exhibited higher catalytic activity than Au. Indeed, in these electrolytes, CO or CO-like intermediates were strongly adsorbed on the active sites of the Pt electrode, resulting in catalyst poisoning; while Au was nearly inactive due to its weak adsorption capability. However, when high pH electrolytes were used, they noticed that the high OH- concentration in the solution and adsorbed hydroxyl on the Pt or Au surface were able to greatly facilitate the de-protonation of alcohols, and thus significantly lower the energy barrier of alcohol oxidation. Therefore, the alkaline media improve the kinetics of EG electrooxidation on both Pt and Au.[18, 19] The authors also observed that EG oxidation on Pt led mainly to glycolate, oxalate and C-C bond products such as formate, while on Au, the EG oxidation is rather related to the ratio of OHads coverage on the catalyst surface, leading selectively to glycolate; oxalate formation is not observed, but only a slight C-C bond cleavage to formate. In recent decades, investigations on palladium have shown very promising catalytic activity and selectivity that depend on the added co-catalyst.[2] Rather than synthesizing platinum group metal (PGM) nanocatalysts, which are effective but very expensive, one could further disperse the precious metal in a conductive matrix such as Vulcan carbon; this reduces the size of the nanoparticles and may increase the catalytic activity. In addition, the decrease in precious metal loading can be compensated by the addition of a more (hydro)oxophilic co-catalyst that cooperates through bifunctional catalysis to oxidize poison intermediates strongly adsorbed at the catalytic sites. Indeed, and as proposed by Behm et al.[12, 13 16, 20], if the EG reaction may proceed via a sequential oxidation of the functional groups without attacking the C-C bond, a cogeneration approach can be explored on a transition metal modified PGM catalyst; the role of the latter co-catalyst will be to prevent strong adsorption of intermediate reaction molecules considered as toxic for the PGM catalyst surface.[13]
For this purpose, the present investigation was conducted by preparing nickel or ruthenium modified palladium catalysts to oxidize EG in alkaline medium. Analytical methods (HPLC) coupled with spectrometric (LC/MS) and spectroscopic (FTIRS) techniques were the helpful to identify the main reaction products giving evidence of the selectivity of this oxidation of the EG into oxalate, glyoxylate, and glycolate.
2. Results and Discussion
2.1. Physicochemical characterization of the materials
Physicochemical measurements were performed to evaluate the composition, structure and morphology of each Pd-based material. The synthesis method was optimized by adjusting the metal reduction kinetics during the monometallic preparation of Ru3+ and Ni2+ to Ru0 and Ni0, respectively. Figure S1 shows the thermogravimetric (TGA) plots for the as-prepared Pd-based, Ru/C, and Ni/C materials. XRD patterns of the M@Pd/C (M = Ru, Ni) catalysts are depicted in Figure 1 and the elemental compositions estimated with EDX analysis are summarized in Table 1. If in the case of monometallic (Pt/C, Ru/C and Ni/C) and bimetallic PdRu/C samples the theoretical and experimental compositions are close, it can be noted that the PdNi materials obtained are far from the targeted compositions. The explanation would arise from the addition of hydrazine. Indeed, this reducing agent allows an efficient reduction of Ni2+ to Ni0. However, it did not slow down, as expected in composition and metal loading, the electroless of Pd2+
on Ni particles. Accordingly, the nomenclature used henceforth is that related to experimentally obtained compositions.
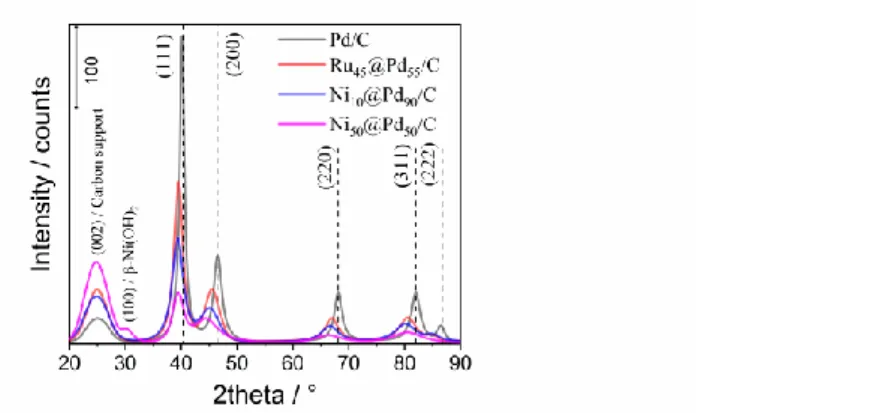
Figure 1. XRD patterns for the M@Pd/C nominal compositions prepared from a revisited polyol/microwave method. 2θ step mode (0.05°) fixed acquisition time = 2 min/step.
The peak at 25° is assigned to the graphite (002) plane of carbon Vulcan XC-72R used as conducting substrate.[21] All the other diffraction peaks of the Pd face-centered cubic (fcc) structure referred to the crystallographic reflection planes (111), (200), (220), (311), and (222) can be observed. Enlarged peaks with low intensity also appear, indicating small crystallite size materials or low crystallinity of these materials. However, 2θ shifts can be clearly visualized, as compared with the pure palladium standard (JCPDS #00-046-1043). In the Pd/C sample, the calculated lattice parameter increases slightly (0.3930 nm instead of 0.3890 nm in the bulk). As this could lead to misinterpretation in the other bimetallic materials, we consider that the different synthesis methods used to prepare each material (presence or absence of hydrazine, assistance of microwave and classical polyol method), may mislead any comparison. Nevertheless, the structure of Pd being preserved (fcc) and the physicochemical properties introduced by Ni and Ru to the Pd element allow us to correlate them with the electrocatalytic properties in the oxidation of the organic molecules (CO and ethylene glycol) studied. Otherwise, a β-Ni(OH)2 phase can be observed in the Ni50@Pd50/C material at 2θ = 30°. As pointed out above, Pd nanoparticles with mean diameter of 5.88 nm appear higher than those expected with classical polyol method; while the bimetallic samples Ni10@Pd90, Ni50@Pd50 and Ru45@Pd55 mean diameters of 2.98 nm, 3.31 nm and 3.20 nm, respectively, calculated with two (111) and (200) intense and better defined planes (Table 1).
When regarding the TEM images of the different material samples (Figure 2), the Pd/C catalyst presents an interesting variety in shapes of nanocrystals composed of particle clusters of a 20-100 nm diameter and small particles ranging from 3–40 nm. This is certainly due to a diversity of seeds and growth rates provided by polyol synthesis, without addition of any surfactant to stabilize and adjust the crystals. As a result, the mean particle size (12.84 nm) appears to be far from that estimated above from the XRD measurements.
Figure 2. TEM images and histograms of metal particle size distribution for the materials prepared from a revisited polyol/microwave method: a) Pd/C, b) Ru45@Pd55/C, c) Ni10@Pd90/C, and d) Ni50@Pd50/C. histograms obtained
from the measurement of 700 isolated nanoparticles.
The Ru45@Pd55/C catalyst exhibits a spherical-like shape that is well-dispersed on the carbon powder support (Figure 2b). EDX analysis performed locally in the material revealed the presence of the palladium and ruthenium elements, demonstrating that the synthesis approach proceeded with successive reductions in ethylene glycol leads successfully to a homogeneous bimetallic catalyst. The Ni10Pd90/C and Ni50Pd50/C materials (Figures 2c and d) were obtained from a redox-transmetalation in polyol medium. It consists in successive chemical steps resulting in the reduction of PdCl42- ions to Pd0 through a partial sacrificial oxidation of Ni particles prepared from a previous polyol synthesis.[22] The both obtained catalysts have particle sizes between 3 and 10 nm, and particle clusters that comprise diameters up to 30 nm. The revisited polyol approaches permitted to proceed to homogeneous dispersion of Ru (microwave) and Ni (hydrazine) particles with low mean size (Figure S2). Although a part of nickel was sacrificed by electroless during the redox process for the reduction of palladium particles, the mean particle sizes estimated from XRD and TEM are very close (Table 1).
Table 1. Physicochemical properties of the as-prepared Pd-based materials from a revisited polyol/microwave method.
Material Experimental composition, EDX (%)
TGA: experimental loading (wt. %)
Mean particle size (nm)
XRD TEM
Pd/C Pd/C 21 5.88 12.84
Ru50@Pd50/C Ru45@Pd55/C 20 3.20 3.16
Ni50@Pd50/C Ni10@Pd90/C 17 2.98 3.22
2.2. Spectroelectrochemical characterization of the materials
Carbon monoxide, which is a common reaction intermediate during alcohols electrooxidation, is known to be a poison for the catalysts. In this context, this molecule was used to investigate the activity of the prepared Pd-based catalysts during CO-stripping experiment coupled with in
situ Infrared Reflectance Spectroscopy. Indeed, the adsorption modes of CO on Pd depend
on the electronic structure and the geometry of the particles. Besides, linear CO chemisorbs at atoms located on corners and edges, while the bridge bonded CO adsorption mainly takes place on the atoms with high coordination numbers, particularly on faces (100) or (111) for metals such as palladium (fcc).[23, 24] As the co-catalyst can be removed from the electrode surface to be dissolved in the bulk solution, the upper potential limit was set at 1.0 V vs. RHE to analyze completely the behavior of the probe molecule (CO) in the classical potential window (Figure 3a).
For the Pd/C and Ni50@Pd50/C catalysts, considering that CO is only adsorbed on the Pd sites, one observes in Figure 3a that its oxidation involves high-current intensity on Pd (100%). This intensity decreases with the Pd content in the bimetallic composition. The main anodic peak of the CO oxidation is centered at 0.82 V vs. RHE on the Pd/C and Ni90@Pd10/C surfaces. The presence of Ni provides a beneficial effect towards the CO oxidation which starts earlier (ca 0.46 V vs. RHE), i.e., much lower than on the monometallic Pd catalyst. This phenomenon is explained in the literature as Ni either provides an oxygen source (with the presence of -Ni(OH)2, cf. Figure 1) to CO at lower potentials or it alters the electronic properties of Pd just as to yield a more active catalytic surface.[25, 26]
Figure 3. a) Activity of the palladium-based catalysts through CO-stripping experiment in 0.1 mol L-1
NaOH at mV s-1 (ECOads = 0.4 V vs. RHE and tCOads = 5 min); SPAIR spectra resulting from CO oxidation
during the spectroelectrochemical measurement on b) Pd/C, c) Ru45@Pd55/C, and d) Ni50@Pd50/C
catalysts at different potentials. R0 was taken at 400 mV vs. RHE.
A shift is observed on the onset potential of CO oxidation to lower values for the electrode material containing Ru, which indicates the occurrence of a faster CO removal on Ru@Pd. This is a direct consequence of the lower Pd-CO adsorption strength on this material, as evidenced by the pronounced electronic modification of Pd on the Ru45@Pd55/C catalyst.[27] There is also an important contribution of the bifunctional mechanism to the faster CO oxidation, as already proposed.[28] This mechanism reveals the role of ruthenium atoms on providing oxygen or hydroxyl groups for the coupling with the carbon monoxide species adsorbed on Pd, which leads to the formation of CO32- in alkaline medium.[29, 30]
In Figures 3b-d, the main bands observed at about 1930 and 1390 cm-1 are attributed to COB adsorbed on Pd and to the asymmetrical stretch of carbonate ions, respectively.[31] The band at 1594 cm-1 corresponding to the symmetrical vibrations of carbonate ions (νSymCOO-) was only visualized in the spectra related to the catalyst NiPd/C, with a very weak intensity. At around 1650-1680 cm-1, two bands can be observed; they are associated with the “CO-H2O co-adsorbate” interactions.[23] During the CO anodic polarization responses, the remarkable intensity of the band related to the asymmetric vibration of CO32- at 1390 cm-1 can be associated with the high activity of the ruthenium-containing catalyst toward the oxidative CO removal. The latter species was assigned by M.J.S. Farias et al. [32] to linear CO (COL)
adsorbed on Ru at 1988 cm-1 (Figure 3c). On the other hand, and even if CVs subsequent to CO-stripping are not shown herein, Figure 3a shows that beyond 1 V/RHE all CO is not desorbed from the catalyst surface since the current does not drop down to almost zero. This is confirmed in Figs 3b and 3d (excluding Ru@Pd) in which the band of CO can be observed in the spectrum at 1000 mV. This also indicates that Pd and Ni@Pd can be used, like Ru@Pd, as the anode of an ethylene glycol direct fuel cell, whereas only Ru@Pd, CO-tolerant, could also act as cathode without depolarization.
2.3. Electrochemical oxidation of ethylene glycol
The reactivity of ethylene glycol as potential fuel in low temperature fuel cell, was performed by electrochemical experiments (voltammetry and chronoamperometry) in a N2-saturated 0.1 mol L-1 NaOH solution. Figure 4a displays the cyclic voltammograms of the Pd/C, Ru@Pd/C, and Ni@Pd/C catalysts. Figure S3 depicts the CVs of Ni/C and Ru/C recorded in the supporting electrolyte to have the electrochemical behavior of the obtained monometallics. The upper potential limit was fixed at 1.55 V vs. RHE to reveal the nickel signature in the Ni@Pd catalysts, while 0.4 V vs. RHE was set as lower potential limit to avoid hydrogen absorption in the Pd crystal lattice. The main characteristics of these voltammograms are the formation of NiOOH at 1.4-1.45 V vs. RHE during the positive sweep of the potential; during the negative potential scan, the desorption of Ni oxides/hydroxides (~1.3 V vs. RHE) and that of PdO (0.7 - 0.6 V vs. RHE) are observed, respectively. By another bias, these voltammograms in the supporting electrolyte show that the prepared electrodes contain at least nickel at the Pd surface and that of the Ru content, which increases the double layer, is not clearly noticeable by voltammetry. The relative area of Pd-based catalyst was evaluated by integrating the reduction peak of PdO, considered as resulted in the layer formed at the same upper potential limit. A charge density of 424 μC cm-2 was associated with the reduction of the formed PdO monolayer.[33-35] The obtained values of 12, 51, 31, and 44 m2 gPd-1 was found for Pd/C, Ru45@Pd55/C, Ni10@Pd90/C, and Ni50@Pd50/C, respectively. We have recently shown that the lattice parameter of Pd resulting in absorbed H (Pd-H) does not significantly modify the oxidation of a molecule such as glucose.[36] As the present research concerns the investigation of an anode capable of catalyzing the oxidation of an organic fuel (ethylene glycol), the study was performed in the potential range 0.1 - 1.2 V vs. RHE (Figure 4b). It can be seen that the Ru content or the lower Ni one shift the ethylene glycol oxidation down to lower potentials as mentioned above in bifunctional catalysis (CO-stripping).[37-40] When the catalyst is richer in Ni (Ni50@Pd50/C), the surface structuring effect is predominant; the current density increases without any change in the oxidation peak potential compared to Pd/C.
Figure 4. a) Cyclic voltammograms of Pd-based electrodes in 0.1 mol L-1 NaOH at 20 mV s-1; b) linear
polarization curves in the presence of 0.1 mol L-1 ethylene glycol; at 20 mV s-1; c) activity of Pd-based
catalysts through the chronoamperometric measurements set at 0.75 V vs. RHE after 60 min.
The activity of the catalysts towards the ethylene glycol oxidation was also characterized by chronoamperometric measurements (Figure 4c). The experimental method consisted in setting an electrode potential at 0.75 V vs. RHE for 60 min. The currents due to ethylene glycol electrooxidation were normalized with either the same geometrical surface or the same metallic charge deposited onto the glassy carbon substrate. Since the TGA analysis showed that the same metal loading was not obtained at each synthesis, the same catalytic mass was weighed for each sample (0.32 mg cm-2). Figures 4b-c show that the lower Ni content or the Ru one, used as co-catalysts, are beneficial (electronic and/or strain effects) to increase the activity of Pd-based catalysts for the ethylene glycol oxidation at lower electrode potentials. In addition, the surface restructuring effect in Ni50@Pd50 further promotes the mass activity of palladium at 0.75 V vs. RHE.
2.4. Identification of the ethylene glycol oxidation products
In order to have a sufficient quantity of reaction products for chromatographic analysis and identification (mass spectrometry), electrolysis of an ethylene glycol solution was carried out at 0.75 V vs. RHE during 4 h. For this purpose, the surface area of the working electrode was enlarged by depositing the suitable catalytic charge as ink on Toray Carbon Paper (2 cm2). An H-type cell separated by an anion exchange membrane (Fumasep® FAA, Fumatech) was used to easily recover the electrolytic solution from the working compartment.
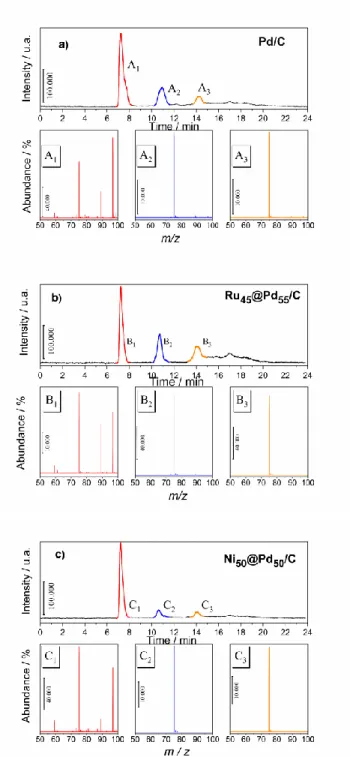
Figure 5. Chromatographic analysis (UV detection) of the reaction products of ethylene glycol oxidation in 0.1 mol L-1 NaOH (Eapp = 0.75 V/RHE, telectrolysis = 240 min) on a) Pd/C and negative ionization Mass
spectra (M-1) of the reaction products: A1: oxalic acid; A2: glyoxylic acid; and A3: glycolic acid. b) on Ru45@Pd55/C and negative ionization mass spectra (M-1) of the reaction products: B1: oxalic acid;
B2: glyoxylic acid and B3: glycolic acid.
c) on Ni50@Pd50/C and negative ionization Mass spectra (M-1) of the reaction products: C1: oxalic acid;
C2: glyoxylic acid, and C3: glycolic acid.
During this ethylene glycol oxidation reaction on the Pd-based catalysts, the variation of current intensity was recorded, which made it possible, by integration, to determine as function of time the coulombic charge involved during the electro-conversion of the fuel to carboxylates (Figure S4). After 2 h a slow and progressive decrease in the current intensity is observed, which may be reasonably attributed to ethylene glycol consumption and/or to the formation of oxygenated species that are strongly adsorbed on the catalyst surface and cause its deactivation. At the end of the long-term electrolysis, the electrolytic solution was neutralized chemically, as detailed in the experimental section. The recovery of the organic phase in water allows the identification of the products by HPLC/mass spectrometry coupling. As can be seen in Figure 5, three main products were separated (HPLC) and their mass spectra were assigned as the
fragmentation of oxalic (A1), glyoxylic (A2), and glycolic (A3) acids.[3, 41] As the peak height (or area) is proportional to the concentration, the same organics are formed on Pd/C (Figure 5a) as well as on Ru45@Pd55 and Ni50@Pd50 (Figures 5b and 5c), and a higher concentration of glyoxylic acid can be observed on Ru45@Pd55. Although the order of the analytes eluted by decreasing acidity on this ion exclusion column (Aminex 87-H) enables the first peak to be easily attributed to oxalic acid, its molecular peak in a negative ionization mode appears at
(m-1)/z = 89. A reference sample of oxalic acid injected under the same conditions gives the same
spectrum with a peak at (m-1)/z = 97 which could be an adduct resulted in a fragment combined with formic acid in the solvent.
To support the LC/MS results, chronoamperometry/FTIRS measurements were undertaken at the same electrode potential as done above (0.75 V vs. RHE) for 30 min (Figure 6).
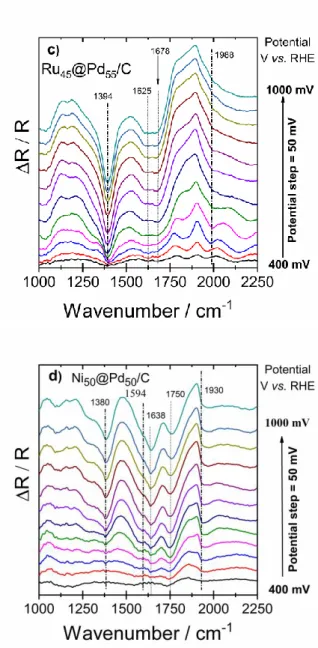
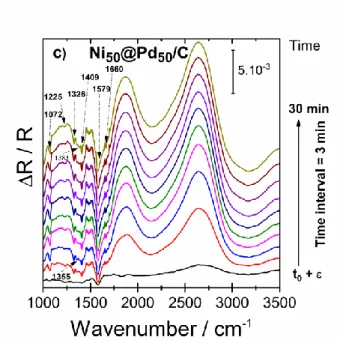
Figure 6. FTIR spectra recorded during chronoamperometry in 0.1 mol L-1 NaOH + 0.1 mol L-1 ethylene
glycol on a) Pd/C, b) Ru@Pd/C, and c) Ni@Pd/C catalysts at 0.765 V vs. RHE, Rref taken at t = 0 s; total
of 10 spectra in 30 min.
The working electrode is positioned to be very close to the CaF2 window of the IR cell to estimate a thin film of electrolyte at ca. 300 µm. The down going bands in the 1000-1700 cm-1 region of the obtained spectra confirm the formation of carboxylates while the up going large bands clearly indicate the consumption of ethylene glycol. Since carboxylates have some common IR bands their identification is not straightforward. As an example, the band at 1576 – 1579 cm-1, assigned to the asymmetric stretch of COO- (asymO-C-O) is common to the three previously identified carboxylates. In the same way the bands corresponding to the COO- symmetrical vibration (symO-C-O), all appearing in a rather narrow interval, make their differentiation difficult. However, based on previously reported work [20, 42] the bands at 1076 cm-1, 1236 cm-1, 1326 cm-1, 1361 cm-1 and 1410 cm-1 can be assigned to glycolate, which seems to be the main observed product. Indeed, the typical bands of glyoxylate and oxalate at 1107 cm-1 and 1308 cm-1 are not observed. Moreover, the absorption bands at 1355 cm-1 and 1383 cm-1 bands observed with the NiPd/C catalyst indicate the presence of formate. The presence of carbonate and bicarbonate species cannot be excluded as their main absorption bands can overlap those of carboxylates.
Even though C1 products (formate, CO32- or HCO3-) cannot be excluded, intermediate adsorbed CO species were not observed in the spectra (window 1900 – 2100 cm-1). Finally, the intense positive bands at 1800 cm-1 and 2600 cm-1 are attributed to the consumption of ethylene glycol molecules and hydroxyl species, while the band centered at 3700 cm-1 corresponds to the water stretching vibrations (not represented in the spectra window).
3. Conclusion
Ruthenium and nickel were used to modify palladium electrode materials for the oxidation of EG in alkaline medium. The polyol method coupled with microwave irradiation shortened the synthesis time and resulted in nanoparticles with a wide variety of shapes and morphologies. Addition of Ni to the Pd-based catalyst results in bimetallic compositions with a metal loading that changes away from the theoretical one as the Ni content increases. In terms of catalytic activity, the presence of Ni provides a strain effect at low content, giving way rather to a surface restructuring effect which predominates when the Ni content is raising (Ni50@Pd50/C).
Combination of the results obtained by liquid chromatography-mass spectrometry and chronoamperometry/infrared spectroscopy showed that the ethylene glycol conversion in alkaline medium on palladium-based catalysts led to the same reaction products. Oxalate, glyoxylate, and glycolate are the sole formed oxidation products; their concentrations are
slightly higher at the Ru45Pd55/C surface, where the electronic effect of Ru on the d-band center of Pd was clearly marked by the shift of the ethylene glycol oxidation towards the lower potentials. These results will serve as guidelines for future work related to potential applications of ethylene glycol in fuel cell devices, promoting cogeneration of high value-added products.
Experimental Section
All chemicals and solvents used for the synthesis of the electrode materials were of A.R. Grade and were used without any further purification.
Nanostructured catalytic materials synthesized by modified polyol method
The materials used as electrocatalysts in these investigations were synthesized using the polyol method adapted to the reduction of each precursor cation. Indeed, the monometallic materials (Pd, Ni and Ru) were obtained separately and the colloidal solutions of Ni and Ru were then used to prepare the bimetallic materials to which the appropriate Pd2+ amount was added to achieve the targeted composition. To achieve a nominal 20 wt.% metal loading, all the final catalytic samples were supported on Carbon Vulcan XC72-R that was previously treated with nitric acid for 8 hours at 80 °C. After addition of the carbon support the catalytic solution was ultrasonically homogenized for 15 min and stirred overnight. Finally, the mixture was filtered on a 0.22 μm GSWP (Fisher-Bioblock), washed several times with NaNO3 solution (0.3 mol L-1) and ultra-pure water (MilliQ, Millipore, 18.2 MΩ cm at 20 °C) to remove traces of the solvent (ethylene glycol). The remaining black solid was dried in an oven at 40 °C for 12 h.
Synthesis of the Pd/C and Ru/C catalysts and their respectively colloidal solutions: Microwave-assisted polyol method[27]
Appropriate amounts of K2PdCl4 or RuCl3, (99.9% purity, Alfa Aesar) were dissolved in 35 mL of ethylene glycol (spectrophotometric grade, ≥ 99% Sigma-Aldrich) in order to reach a correct concentration of metals. Then, pH of the solution was adjusted at values > 11 by adding 1 mol L-1 NaOH solution in ethylene glycol. The reactor (3 neck balloon – 100 mL) equipped with a reflux system was put inside a MARS oven from CEM Corporation. Such set up activates the synthesis reaction by microwave irradiation at atmospheric pressure, without evaporation of ethylene glycol due to temperature increase during microwave irradiation. The synthesis of catalysts was performed under continuous microwave irradiation at a power of 1600 W until reaching the desired reaction temperature, and then microwave pulses were applied to hold the temperature range. The colloidal suspension was obtained in this synthesis step.
Synthesis of Ni nanoparticles by the revisited polyol method: hydrazine reduction of nickel chloride in ethylene glycol at 60 °C [43]
The polyol method was revisited to achieve a thorough reduction of Ni2+ to Ni nanoparticles. This protocol consisted in adding to ethylene glycol at 60 °C containing nickel chloride another reducing agent, hydrazine, that effectively increased the reduction kinetics. [44] Addition of NaOH (1.0 mol L-1) is necessary and no extra nitrogen gas was required to create an inert atmosphere. The concentration ratio of hydrazine to nickel chloride was [N2H5OH]/[NiCl2] > 12. At a temperature of 60 °C, nickel nanoparticles were formed after about 1 h in a capped bottle with stirring. The reduction reaction could be expressed as:
2 Ni2+ + N2H4 + 4 OH- → 2 Ni0 + N2 + 4 H2O (1)
A gray metalized colloidal solution was obtained after one hour of reaction. Afterwards, nickel nanoparticles were separated by centrifugation and resuspended in ethylene glycol. The hydrazine excess was removed with this strategy and the colloidal suspension was ready for use in the next synthesis steps or to be supported on carbon Vulcan, as previously described.
Synthesis of M@Pd/C bimetallic catalysts by successive reductions with polyol
Appropriate amounts of K2PdCl4 (99.9% purity, Alfa Aesar) were dissolved in 35 mL of ethylene glycol (spectrophotometric grade, ≥ 99% Sigma-Aldrich) in order to reach a correct concentration of metals. Then, pH of the solution was adjusted at values > 11 by adding a 1 mol L-1 NaOH solution in ethylene glycol. Then, this solution containing the PdCl42- ions was added to the previously prepared solutions containing the colloidal nanoparticles of ruthenium or nickel in order to obtain an atomic molar ratio 1:1. The final solution remained under magnetic stirring for 12 hours, until all Pd species were reduced. After the reduction, the solution turned dark brown but still translucent and clear, without the presence of precipitates. Carbon Vulcan XC72-R treated with nitric acid for 8 hours at 80 °C was then added in the
reaction solution in order to obtain a nominal metal loading of 20 wt.% on carbon. The catalyst solution was ultrasonically homogenized for 15 min and was stirred overnight. Finally, the mixture was filtered on a 0.22 μm GSWP, washed several times with NaNO3 solution (0.3 mol L-1) and ultra-pure water to remove traces of ethylene glycol. The procedure employed to dry and to support the catalysts in carbon XC72-R was the same as for the Pd, Ru, and Ni colloidal solutions.
Physicochemical Characterizations
visible measurements were carried out using a spectrophotometer Evolution 100 UV-visible from Thermo Electron Corp. from 300 nm to 800 nm.
The metal loading of the catalyst was evaluated by differential and thermogravimetric analysis (DTA/TGA). DTA/TGA was performed with TA Instruments SDT Q600 apparatus. An amount of catalytic powder between 5 and 10 mg was put in alumina crucible and heat-treated under air atmosphere (flow rate 100 mL min-1) from 25 to 900 °C with a temperature rate of 5 °C min -1. The crystal structure of the materials in the catalysts was characterized by XRD. These experiments were carried out on an EMPYREAN (PANanalytical) diffractometer in Bragg– Brentano (θ–θ) configuration with a copper tube powdered at 45 kV and 40 mA (Cukα1=1.54060 Å and Cukα2=1.54443 Å). A nickel filter was installed in a secondary optic in order to eliminate the kβ component. The diffraction angle (in 2θ) from 20° to 90° was investigated in step mode, with steps of 0.05° and fixed acquisition time of 2 min/step. Obtained data was analyzed with the HighScore Plus software. For the crystallite size and lattice parameters calculations, the two planes (111) and (200) were used, clearly the most intense and well-defined peaks for the different investigated catalysts.
The materials were also characterized by TEM using a TEM/STEM JEOL 2100 UHR (200 kV) equipped with a LaB6 filament. Transmission electron microscopy (TEM) measurements were carried out with a JEOL JEM 2010 (HR) with a resolution of 0.35 nm. The mean particle size and size distribution were determined by measuring the diameter of isolated particles using ImageJ free software and estimated from the measurement of 700 isolated nanoparticles to have adequate statistical samples. Energy dispersive X-ray (EDX) analysis using a Leica microscope Zeiss LEO 440 model TEM coupled to an Oxford 7060 model analyzer was used to determine the local chemical composition and homogeneity of the nanomaterials.
Electrochemical Measurements
The electrochemical measurements were performed with an Autolab (PGSTAT30) Potentiostat/Galvanostat (Metrohm) equipped with the NOVA® software in an undivided conventional three electrode Pyrex. A glassy carbon flat (6.5 cm2 geometrical surface area) served as an auxiliary electrode. The working electrode was a glassy carbon disk (0.071 cm2 geometrical surface area) and reversible hydrogen electrode (RHE) was used as reference electrode connected to the cell through a Luggin–Haber capillary tip. The catalytic ink consisted of an appropriate amount of the electrocatalyst powder, isopropyl alcohol (99%), and Nafion® (1%) (5 wt.% in aliphatic alcohols, Sigma-Aldrich) was homogenized in ultrasonic bath for 60 min. A mass density of 0.32 mgPd cm-2 was deposited onto a previously polished GC electrode. The solvent was then evaporated in a stream of ultra-pure nitrogen at room temperature (21±1 °C).
All the electrochemical experiments were performed at room temperature using 0.1 mol L-1 NaOH (Sigma-Aldrich, 97 %), 0.1 mol L-1 ethylene glycol (ReagentPlus > 99.0 %, Sigma-Aldrich) and ultrapure water for the preparation of the supporting electrolyte. Chronoamperometry experiments were conducted at 0.75 V vs. RHE to measure the catalytic activity towards the ethylene glycol oxidation. Before each experiment, the electrolyte was deoxygenated by bubbling nitrogen during 30 min.
In Situ Fourier Transform Infrared (FTIR) Spectroscopy Measurements Coupled with Electrochemical Experiments
In situ FTIR measurements were carried out in a Bruker IFS 66v spectrometer which was modified for beam reflection on the electrode surface at a 65° incidence angle. A 10-6 bar vacuum was used to remove all interferences from atmospheric water and CO2. The detector was a MCT (HgCdTe) type, cooled beforehand by liquid nitrogen. The spectral resolution was 4 cm-1, and the FTIR spectra were recorded in the 1000-4000 cm-1 IR region. A special tailored cell, in a three-electrode spectroelectrochemical cell, fitted with an MIR transparent window (CaF2) was used for in situ FTIR experiments.[45, 46]
The potentiostat was the same used in CV experiments. A slab of glassy carbon and RHE served as counter and reference electrodes, respectively. The working electrode consisted of 3 μL of catalytic ink deposited on a glassy carbon disk (8 mm diameter) previously polished
with alumina. To minimize the absorption of the infrared beam by the solution, the working electrode was pressed against the window and a thin layer of electrolytic solution was obtained. Two methods were used; the first one was the SPAIRS (Single Potential Alteration IR Spectroscopy), carried out in the potential range of 0.05-1.25 V vs. RHE. The electrode reflectivity REi was recorded at different potentials Ei, each separated by 0.05 V during the first
voltammogram at a sweep rate of 1 mV s-1. For each spectrum, a set of 528 interferograms was accumulated and treated by Fourier-transform. CO-stripping experiments in a 0.1 mol L-1 NaOH solution were conducted with the same data acquisition technique. The spectra were recorded in the 1,000–4,000 cm-1 range with a spectral resolution of 8 cm-1 at 50 mV intervals between 0.4 and 1.0 V vs. RHE during the CO oxidation performed at 1 mV s-1. Carbon monoxide was adsorbed at 0.4 V vs. RHE during 5 min and the solution was deaerated during 25 min before CV experiments. The reflectance spectra were calculated for the different potential values as changes in the reflectivity (Ri) relative to a reference single-beam spectrum
(R0) as follows: ΔR/R = (Ri−R0)/R0. As described by Leung et al., the simultaneous acquisition
of SPAIR spectra during the voltammetric sweep enables the adsorbed CO IR spectra to be monitored at electrode potentials where ethylene glycol electrooxidation proceeds.[47] A second spectroelectrochemical method which consists in coupling Chronoamperometry measurement to FTIRS acquisition was performed at 0.75 V vs. RHE for 30 min with a spectrum acquisition every 3 min.
Electrolysis and High-Performance Liquid Chromatography/Mass Spectrometry (HPLC-MS)
Electrolysis was fulfilled in a Pyrex two-compartment cell.[48] The compartments were separated with an anion-exchange membrane (35 μm thickness, from Fumatech). The electrochemical measurements were conducted using the same Potentiostat/Galvanostat used in CV experiments. The electrical connection of the carbon Toray sheet was established with a gold wire. The ink was prepared like for the CV experiments. Fifty microliters of the catalytic ink were deposited onto each side of a carbon Toray sheet (2.0 cm2 geometric surface area), and the solvent was evaporated with a N2 stream at room temperature. A glassy carbon slab (10.8 cm2 geometric surface area) and RHE served as counter and reference electrodes, respectively.
Analytical investigations on ethylene glycol conversion at the Pd/C and M@Pd/C electrode surface during long-term electrolysis were performed with high performance liquid chromatography (HPLC) with a semi-preparative ion exclusion column (Aminex HPX-87H). This liquid chromatography is also equipped with an UV–Vis detector followed by a refractive index detector.
At the end of long-term electrolysis (4 hours) in a two-compartment cell separated by the anion-exchange membrane, the recovered reaction products were neutralized on an ion-anion-exchange resin (DOWEX 50WX8-200, Sigma-Aldrich). Briefly, it consists in regenerating the as-received resin with 0.5 M H2SO4 and then washing it until obtaining a neutral pH. Afterwards, the electrolytic solution was passed through the resin to neutralize the supporting electrolyte (NaOH) and thereby the carboxylate ions become carboxylic acids. To be sure to recover all the compounds an equivalent volume of water was added on the resin. After, the resulting solution was lyophilized and the samples were finally identified by LC-MS (Mass Spectrometry, Xevo Q-ToF, Waters) in negative ionization mode with an eluent that was water slightly acidified with formic acid (0.2%).
Acknowledgements
This work was mainly supported by FAPESP (grants number 2013/25.632-0; 2012/07654-3 and 2013-25421-9). The collaborative program CAPES/COFECUB under grant n° 914/18 are gratefully acknowledged. The authors also thanks Capes under the contract number 001. The authors also acknowledge the financial support from the European Union (ERDF) and “Région Nouvelle-Aquitaine”.
Keywords: Ethylene glycol • electrochemistry • energy conversion • fuel cells • heterogeneous
catalysis
References:
[1] N. Ji, T. Zhang, M. Zheng, A. Wang, H. Wang, X. Wang, J. G. Chen, Angew. Chem. Int. Ed. 2008,
[2] V. Bambagioni, M. Bevilacqua, C. Bianchini, J. Filippi, A. Marchionni, F. Vizza, L. Q. Wang, P. K. Shen, Fuel Cells 2010, 10, 582-590.
[3] L. An, L. Zeng, T. S. Zhao, Int. J. Hydrogen Energy 2013, 38, 10602-10606.
[4] Y. Zhang, F. Gao, P. Song, J. Wang, J. Guo, Y. Shiraishi, Y. Du, ACS Sustain Chem Eng 2019, 7, 3176-3184.
[5] F. Kadirgan, B. Beden, C. Lamy, J. Electroanal. Chem. 1982, 136, 119-138.
[6] F. Kadirgan, B. Beden, C. Lamy, J. Electroanal. Chem. Interfacial Electrochem. 1983, 143, 135-152. [7] H. Berndt, I. Pitsch, S. Evert, K. Struve, M. M. Pohl, J. Radnik, A. Martin, Appl. Catal. A: Gen 2003,
244, 169-179.
[8] L. Prati, F. Porta, Appl. Catal. A: Gen 2005, 291, 199-203.
[9] L. Demarconnay, S. Brimaud, C. Coutanceau, J. M. Léger, J. Electroanal. Chem. 2007, 601, 169-180.
[10] C. Jin, Y. Song, Z. Chen, Electrochim. Acta 2009, 54, 4136-4140.
[11] N. W. Maxakato, C. J. Arendse, K. I. Ozoemena, Electrochem. Commun. 2009, 11, 534-537. [12] Wang, Z. Jusys, R. J. Behm, Electrochim. Acta 2009, 54, 6484-6498.
[13] M. Chojak Halseid, Z. Jusys, R. J. Behm, J. Electroanal. Chem. 2010, 644, 103-109. [14] Y. Feng, W. Yin, Z. Li, C. Huang, Y. Wang, Electrochim. Acta 2010, 55, 6991-6999. [15] C. Jin, C. Sun, R. Dong, Z. Chen, Electrochim. Acta 2010, 56, 321-325.
[16] J. Schnaidt, M. Heinen, Z. Jusys, R. J. Behm, J. Phys. Chem. C 2011, 116, 2872-2883. [17] L. Xin, Z. Zhang, J. Qi, D. Chadderdon, W. Li, Appl. Catal. B: Environ. 2012, 125, 85-94.
[18] H. Xu, J. Wang, B. Yan, K. Zhang, S. Li, C. Wang, Y. Shiraishi, Y. Du, P. Yang, Nanoscale 2017,
9, 12996-13003.
[19] D. Li, K. Cai, L. Wu, Y. Zuo, W. Yin, H. Zhang, Z. Lu, G. Zhu, H. Han, ACS Sustain Chem Eng 2017, 5, 11086-11095.
[20] J. Schnaidt, M. Heinen, Z. Jusys, R. J. Behm, J. Phys. Chem. C 2013, 117, 12689-12701. [21] Z. L. Liu, X. H. Zhang, S. W. Tay, J. Solid State Electrochem. 2012, 16, 545-550.
[22] D. Chen, J. Li, C. Shi, X. Du, N. Zhao, J. Sheng, S. Liu, Chem. Mater. 2007, 19, 3399-3405. [23] S. Z. Zou, R. Gomez, M. J. Weaver, J. Electroanal. Chem. 1999, 474, 155-166.
[24] S. Z. Zou, R. Gomez, M. J. Weaver, Surf. Sci 1998, 399, 270-283.
[25] S. Y. Shen, T. S. Zhao, J. B. Xu, Y. S. Li, J. Power Sources 2010, 195, 1001-1006. [26] Z. Liu, X. Zhang, L. Hong, Electrochem. Commun. 2009, 11, 925-928.
[27] S. Harish, S. Baranton, C. Coutanceau, J. Joseph, J Power Sources 2012, 214, 33-39. [28] K. Bergamaski, J. F. Gomes, B. E. Goi, F. C. Nart, Ecletica Quimica 2003, 28, 87-92. [29] F. H. B. Lima, E. R. Gonzalez, Appl. Catal. B-Environ. 2008, 79, 341-346.
[30] F. H. B. Lima, E. R. Gonzalez, Electrochim. Acta 2008, 53, 2963-2971. [31] T. Iwasita, A. Rodes, E. Pastor J. Electroanal. Chem.1995, 383, 181-189.
[32] M. J. S. Farias, W. Cheuquepan, G. A. Camara, J. M. Feliu, ACS Catal. 2016, 6, 2997-3007. [33] M. Grdeń, M. Łukaszewski, G. Jerkiewicz, A. Czerwiński, Electrochim. Acta 2008, 53, 7583-7598. [34] N. Tateishi, K. Yahikozawa, K. Nishimura, Y. Takasu, Electrochim. Acta. 1992, 37, 2427-2432.
[35] N. Tateishi, K. Yahikozawa, K. Nishimura, M. Suzuki, Y. Iwanaga, M. Watanabe, E. Enami, Y. Matsuda, Y. Takasu, Electrochim. Acta. 1991, 36, 1235-1240.
[36] Y. Holade, C. Canaff, S. Poulin, T. W. Napporn, K. Servat, K. B. Kokoh, RSC Adv. 2016, 6,
12627-12637.
[37] S. T. Nguyen, H. M. Law, H. T. Nguyen, N. Kristian, S. Wang, S. H. Chan, X. Wang, Appl. Catal.
B-Environ. 2009, 91, 507-515.
[38] T. S. Almeida, L. M. Palma, P. H. Leonello, K. B. Kokoh, A. R. de Andrade, ECS Trans 2011, 41, 1271-1278.
[39] J. Greeley, J. K. Norskov, M. Mavrikakis, Annu. Rev. Phys. Chem. 2002, 53, 319-348.
[40] J. X. Wang, H. Inada, L. J. Wu, Y. M. Zhu, Y. M. Choi, P. Liu, W. P. Zhou, R. R. Adzic, J Am Chem
Soc 2009, 131, 17298-17302.
[41] A. Marchionni, M. Bevilacqua, C. Bianchini, Y.-X. Chen, J. Filippi, P. Fornasiero, A. Lavacchi, H. Miller, L. Wang, F. Vizza, ChemSusChem 2013, 6, 518-528.
[42] H. Wang, B. Jiang, T.-T. Zhao, K. Jiang, Y.-Y. Yang, J. Zhang, Z. Xie, W.-B. Cai, ACS Catal. 2017,
7, 2033-2041.
[43] S. H. Wu, D. H. Chen, J Colloid Interf Sci 2003, 259, 282-286.
[44] T. Asset, R. Chattot, J. Drnec, P. Bordet, N. Job, F. Maillard, L. Dubau, ACS Appl. Mater. Interfaces, 2017, 9, 25298-25307.
[45] D. S. Corrigan, L. W. H. Leung, M. J. Weaver, Anal. Chem. 1987, 59, 2252-2256. [46] I. T. Bae, X. K. Xing, C. C. Liu, E. Yeager, J. Electroanal. Chem. 1990, 284, 335-349. [47] L. W. H. Leung, M. J. Weaver, Langmuir. 1990, 6, 323-333.