HAL Id: hal-02319838
https://hal.archives-ouvertes.fr/hal-02319838
Submitted on 18 Oct 2019HAL is a multi-disciplinary open access archive for the deposit and dissemination of sci-entific research documents, whether they are pub-lished or not. The documents may come from
L’archive ouverte pluridisciplinaire HAL, est destinée au dépôt et à la diffusion de documents scientifiques de niveau recherche, publiés ou non, émanant des établissements d’enseignement et de
Cross-flow filtration for the recovery of lipids from
microalgae aqueous extracts: membrane selection and
performances
Erika Clavijo Rivera, Liliana Villafaña-López, Shuli Liu, R Vinoth Kumar,
Michèle Viau, Patrick Bourseau, Cécile Monteux, Matthieu Frappart, Estelle
Couallier
To cite this version:
Erika Clavijo Rivera, Liliana Villafaña-López, Shuli Liu, R Vinoth Kumar, Michèle Viau, et al.. Cross-flow filtration for the recovery of lipids from microalgae aqueous extracts: membrane selection and performances. Process Biochemistry, Elsevier, 2020, 89, pp.199-207. �10.1016/j.procbio.2019.10.016�. �hal-02319838�
Cross-flow filtration for the recovery of lipids from
microalgae aqueous extracts: membrane selection and
performances
Erika Clavijo Riveraa, Liliana Villafa˜na-L´opeza,b, Shuli Liua,c, R. Vinoth Kumara,d, Mich`ele Viaud, Patrick Bourseaua,e, C´ecile Monteuxf, Matthieu
Frapparta, Estelle Coualliera,∗
aCNRS, GEPEA, Universit´e de Nantes, 37 Boulevard de l’universit´e, BP 406, 44602 Saint-Nazaire cedex, France
bCIATEC A.C., Centro de Innovaci´on Aplicada en Tecnolog´ıas Competitivas, Omega 201, Col. Industrial Delta, 37545 Le´on, Gto., Mexico.
cADEME, 20 avenue du Gr´esill´e, BP90406, 49004 Angers cedex 01, France dINRA, BIA, Rue de la G´eraudi`ere, BP 71627, 44 316 Nantes Cedex 3, France eUniversit´e de Bretagne Sud, Rue de Saint-Maud´e, BP 92116, 56321 Lorient Cedex,
France
fCNRS, PPMD, SIMM, 10 rue Vauquelin, 75231 PARIS CEDEX 05, France
Abstract see below
Declaration of interest: none.
∗Corresponding author
Abstract. The biorefinery of microalgae necessitates innovative choices of soft and energy-efficient processes to guarantee the integrity of fragile molecules and develop eco-friendly production. A wet processing of biomass is pro-posed, which avoids expensive drying steps. It includes harvesting, cell dis-ruption, and fractionation of the target compounds. Membrane filtration is 5
a promising clean fractionation step. In this paper, the recovery of lipids from starving Parachlorella kessleri aqueous extracts by cross-flow filtration was studied. A model solution was formulated to test four membranes of
different materials (PVDF, PES, PAN) and cut-offs (200 kDa - 1.5µm). The
hydrophilic PAN 500 kDa membrane presented the best performance (flux 10
stability, permeate flux, lipid retention, and cleanability) and was therfore selected for filtrating real aqueous extracts. Similar permeation fluxes were
obtained with model and real products: 34 - 41 L h−1 m−2 respectively.
The coalescence of lipid droplets was observed with model solutions but not with real products, less concentrated. The lipids from the real products were 15
wholly retained by the PAN membrane, whereas some of the polysaccharides and proteins were able to permeate. An optimization of the coupling be-tween culture, cell disruption, clarification, and filtration would allow a good concentration and purification of the lipids from microalgae.
20
Keywords. microalgae biorefining membrane filtration lipidsemulsion poly-acrylonitrile membrane
1. Introduction
The biorefinery of renewable resources like microalgae offers great oppor-tunities for substituting biomolecules (lipids, proteins, carbohydrates, and antioxidants) for traditional raw materials in various industry sectors, such as food/nutrition and animal feed, cosmetics, pharmacy, energy and green 5
chemistry. Such strategies necessitate innovative choices of soft and energy-efficient processes to guarantee the integrity of fragile molecules and develop eco-friendly production. For large-scale production (food, energy and green chemistry), a wet processing of biomass is proposed, which avoids expensive
drying steps and reduces solvent use [1–5]. However, the energetically
effi-10
cient extraction of biomolecules at low cost on an industrial scale is not yet
mature [6–11]. Wet biomass treatment includes 1- harvesting, 2- cell
dis-ruption step to release the valuable biochemicals in the aqueous phase, 3-fractionation steps (extraction, concentration and purification).
15
The integration of membrane processes into the downstream processing of the microalgae involves the harvesting and the concentration of microalgae
[12–18], but membrane filtration is also a promising clean separation process
for the fractionation steps [19–26].
20
In this work we focus on the recovery and concentration of lipids from Parachlorella kessleri, cultivated in starving conditions to enhance lipid pro-duction. Lipid recovery from microalgae has mainly been carried out with
supercritical CO2 on dried matter or by solvent extraction [20; 27; 28]. In
this study the membrane processes are developed. After grinding of the microalgae and centrifugation, the supernatant contains large quantities of
the lipids, dispersed in water [29]. Clavijo Rivera et al. [29] demonstrated
that after bead milling and centrifugation of Parachlorella kessleri, the su-5
pernatant contains emulsified lipids in the aqueous phase. This lipid phase contains neutral lipids (triglycerides and free fatty acids) and polar lipids (phospho and glycolipids). The purpose of this work is to study the recovery and concentration of these valuable compounds by membrane processes. Membrane filtration has previously been used for the recovery of emulsi-10
fied lipids in effluents from different industries (food, petroleum, metallurgy,
etc.), mostly using micro or ultrafiltration membranes [30–32]. The lipids
are mixed with surfactants which strongly influence the separation [33]. The
lipids separation from the aqueous phase implies concentration of the lipids on the one hand, and/or destabilization of the water–oil interface to induce 15
coalescence on the other. The concentration of the lipids into the retentate necessitates hydrophilic membranes to limit the fouling of the membrane by organic matter. These membranes can be made of cellulose, polyacryloni-trile (PAN), polyethersulfone (PES), hydrophilated polyvinylidene fluoride
(PVDF) [34–38]. New hydrophilic membranes are also being developed [39–
20
41]. Coalescence is enhanced with hydrophobic membranes (PVDF,
However, the fractionation of disrupted microalgae has rarely been
in-vestigated [21–25; 43]. Prediction and control of the membrane filtration in
complex mixtures with macromolecules, organic and mineral compounds, is known to be difficult.
Giorno et al. [43] studied triglyceride separation from a wet sonicated
5
biomass. They used ultrafiltration cellulose membranes with 30 and 100 kDa molecular weight cutoffs and achieved water permeation flux between 22 and
27 L h−1 m−2 with a transmembrane pressure (TMP) of 0.14-0.2 bar for
con-centration experiments. Montalescot et al. [23] also studied the wet biomass
fractionation after bead milling or high pressure disruption. The author used 10
ceramic membranes with a porous diameter of between 50 nm and 1.4 µm.
Unlike with Giorno, the lipid transmission was less than 4%. A strong re-tention of proteins and carbohydrates was also mentioned. Following cen-trifugation, the filtration of the supernatant allowed a better transmission of
carbohydrates. Lorente et al. [25] compared cross-flow and dynamic filtration
15
with a vibratory shear enhanced processing (VSEP) for the concentration of lipids from a steam-exploded biomass before solvent extraction. They tested several membranes and selected two: a PES 5 kDa and a PVDF 100 kDa. They used a transmembrane pressure equal to 5 bar and managed to
con-centrate the lipids with a permeate flux between 7 and 25 L h−1 m−2. The
20
authors recorded a strong reduction (50-60%) in the solvent volume needed
for lipid extraction after filtration. Safi et al. [24] tested membrane
disruption (HPD) and enzymatic cell disruption combined with ultrafiltra-tion and diafiltraultrafiltra-tion. They tested PES membranes with different molecular weight cut offs (MWCO = 300, 500 and 1000 kDa). Strong fouling was noted for the largest MWCO. The best permeation flux was achieved with
PES 300 kDa (30-40 L h−1 m−2), at 2 bar. The best total protein
recov-5
ery was obtained with enzymatic hydrolysis and ultrafiltration/diafiltration (24%) but the proteins were denatured, whereas the HPD led to lower pro-tein recovery (17%) but the native structure seemed to be preserved.
The above authors encountered difficulties in fractionating of a complex 10
medium coming from disrupted cells and membrane fouling. The composi-tion of microalgae extracts depends on culture batches, grinding, clarificacomposi-tion
and storage conditions prior to filtration [29]. This variability in the
char-acteristics of the filtration feed solution may lead to different interactions between molecules in the liquid phase and also with the membrane. Conse-15
quently, differences in the feed solution are expected to influence filtration performances and hinder the comparison of results for accurate selection of an adapted membrane, and operating conditions for the separation process. For this reason, it would be helpful to use mixtures with well–known char-acteristics.
20
In this work, a model solution was formulated, based on the analysis of the
lipid fraction from Parachlorella kessleri aqueous extracts [29]. This solution
cleanabil-ity) of PAN, PES and PVDF membranes to concentrate lipids. The most appropriate material and conditions were then selected and verified on real microalgae fractions.
2. Material and methods 5
2.1. Parachlorella kessleri culture, harvesting and storage
The strain Parachlorella kessleri was cultivated in autotrophic conditions using a BBM medium. The first step was to inoculate the pre-culture in a bubble column photobioreactor (PBR) with 15 L of normal BBM medium
(0.75 g L−1 NaNO3). After 10 days, the culture reached a stationary growth
10
phase and a modified BBM medium (0.23 gL−1 NaNO3) was gradually added
to reach 100L in nitrogen starvation conditions. The PBR was aerated
with 0.5-1 L min−1 CO2 and 5 L min−1 filtered air. The pH was
main-tained at 7.5 through pH-controlled addition of carbon dioxide to the air-flow. During the starvation phase, the continuous white light intensity was 15
100-150µmol m−2 s−1 and the culture temperature was between 22 to 25°C.
The microalgae were harvested by centrifugation at 5400 g ( ROUSSELET ROBATEL DRA320VX, France). A concentrated paste containing 1.5% to
2.0% dry matter was obtained and then stored frozen at -20°C before the cell
disruption. 20
2.2. Biomass pretreatment
The frozen microalgae paste was thawed in the fridge at 4°C for one night
and resuspended to 5 g L−1 with phosphate buffer (pH 7.4, Conductivity
790 µScm−1) and stirred at room temperature. The dilution was chosen to
perform two filtration experiments with the aqueous extract obtained from 5
100 L of the initial culture. The bead milling (Dyno-mill multi labo, Muttenz,
WAB, Switzerland) was operated in pendulum mode [44; 45]. The flow rate
was set at 150 mL min−1. The filling ratio with the glass beads (average
diameter 0.65 mm) was 75% and the impeller tip velocity was 8 m s−1.
The bead milling was combined with two plate heat exchangers for enzyme 10
inactivation. The resuspended biomass was heated at 60°C with a plate
heat exchanger before entering the bead mill, and cooled at the outlet to
5°C using a plate cooler. Three passes in the bead mill and one pass were
carried out respectively for the first and second experiments. The disrupted
cells were centrifuged at 12000 g, 5°C for 20min (SORVALL LYNX 6000,
15
Thermo Scientific). The recovered supernatants SN1 (first experiment) and
SN2 (second experiment) were stored at 4°C for subsequent filtrations.
2.3. Formulation of the model solution
The model solution was an oil-in-water emulsion representing the super-natant of a concentrated (x40) pre-treated culture, after bead milling and sep-20
aration of the cell fragments by centrifugation. The emulsion granulometry, pH and conductivity were based on the characteristics of a real supernatant
[29]. It contained 2%w of lipids in an aqueous phase close to a fresh water
culture medium, with a pH 7.4 and a conductivity equal to 790 µS cm−1.
The lipid phase contained 70%w of neutral lipids from a mixture of vegetable
oils and 30%w of polar lipids comprising commercial products called A and
B here. 5
2.3.1. Products selection
Based on the total fatty acid composition of a supernatant from a real
microalgae extract (after grinding and centrifugation) [29], a mixture of
veg-etable oils was selected for formulation of the model solution. The
am-phiphilic compounds contained in real microalgae extracts are phospholipids 10
(such as phosphatidylcholine PC and lysophosphatidylcholine LPC), glycol-ipids, and free fatty acids. Two commercial surfactants composed mainly of polar lipids were therfore chosen to stabilize the emulsion. One of the emulsifying products was selected to represent phospholipids (A). It
con-tained >96.2%w of PC, <4%w of LPC, and < 0.3%w of tocopherol. The
15
other product (B) represented glycolipids and smaller aliphatic surfactants and contained fatty alcohols and alkylpolyglycosides.
2.3.2. Emulsification
A preliminary study was carried out to define the emulsification condi-tions and obtain a stable emulsion with the desired granulometry (0.5-5 µm). 20
The process was performed using a high-speed dispersing unit, IKA Ultra-Turrax T 25 basic, with a dispersing tool 13 mm in diameter. The aqueous
phase (pH 7.4, 790 µScm−1) was mixed with A (15%w of the total lipid
con-tent) at 80°C and the vegetable oils with B (15%w of the total lipid content)
at 80°C. The aqueous and the oil phases were then mixed (28300 rpm, 30 min)
and cooled to ambient temperature for 24h with gentle stirring at 700 rpm.
2.4. Membrane filtration 5
2.4.1. Selected membranes
Four organic membranes (Orelis Environment) were tested (table1): one
made of polyethersulfone (PES), a current polymer used for membrane fil-tration in the agrofood industry, one made of polyacrilonitrile (PAN) used in emulsion filtration, and two made of polyvinylidene fluoride (PVDF), useful 10
for emulsion destabilization.
Before use, each new sheet of membrane (8.5x17.9 cm) was rinsed, cleaned and compacted until constant water flux was reached to ensure the stability of the membrane during filtration tests. Membrane compaction was per-formed as follows: water was circulated in the system in full recycling mode 15
at room temperature. TMP was increased every 15 min from 0.25 bar to 1 bar in 0.25 bar steps. Pressure was kept constant until a stable permeate flux was achieved.
2.4.2. Filtration experimental set-up
The tests were performed in a crossflow filtration set-up (Rayflow 100, 20
Rhodia, Orelis) with an effective membrane area of 130 cm2. The
(Master-flex I/P 77600-62), a valve on the retentate outlet pipe to control the trans-membrane pressure (TMP), two temperature sensors, two electronic pressure sensors (Scheneider Electric XMLP) and two analogue pressure gauges placed at the module inlet and outlet on the retentate side to monitor the TMP.
The feed solution was maintained at 30°C with a controlled warming plate.
5
The cross-flow velocity was 1 ms−1. The permeate was weighted continuously
using an electronic balance (Radwag WLC 6/A2), to measure the permeate flow. All the data were collected with Labview software.
2.4.3. Critical pressure measurement 10
2 L of real or model solution were filtered and the retentate and the per-meate recycled to the feed tank in order to maintain the initial feed concen-tration (full recycling mode). The experiments were performed at a constant
temperature of 30°C, and a constant cross-flow velocity of 1 ms−1.The TMP
was raised from 0.2 bar (minimum pressure obtained with the retentate valve 15
completely open), in 0.05 to 0.1 bar steps (depending on the experiment), to
a maximum pressure Pmax at which permeate fluxes do not increase any
fur-ther. TMP increments were carried out only after permeate flux stabilisation
at each pressure. The critical pressure PC, above which the fouling becomes
significant, was evaluated from graphs of J=f(TMP). It corresponded to the 20
pressure above which the slope of J=f(TMP) decreased. The pressure used
per-formed in duplicate for model solutions with all the membranes except for the PAN membrane, which was performed in triplicate. One experiment was performed with each real supernatant.
2.4.4. Concentration of the lipid fraction
2 L of solution (model solution or real supernatant) were filtered in batch 5
mode at 30°C with the crossflow filtration set-up described above, with a
cross flow velocity of 1 ms−1. In all cases Pconc was determined following the
protocol described in section2.4.3. The used TMP (between 0.2 and 0.4 bar)
is described in table 2 for model solutions and in section 3.3 for microalgae
extracts. The retentate was recycled to the feed tank but the permeate was 10
extracted. The volume reduction ratio (VRR = Vf eed
Vretentate) reached 1.5 to 4 depending on the experiment. Permeate and retentate samples were collected at VRR 1.5, 2, 3, 4 according to the experiment, in order to determine pH, conductivity, dry matter, ash and droplet size distribution, and to quantify lipids, proteins, and polysaccharides. The experiments were performed in 15
duplicate for model solutions with all the membranes except for the PAN membrane which was performed in triplicate. One experiment was performed with each real supernatant.
2.4.5. Membrane cleaning
Before and after filtration, the membranes were cleaned at 40°C following
20
several steps: water rinsing, a cleaning step, water rinsing and if necessary bleach cleaning before strong water rinsing. The cleaning step was carried out
following two protocols: i) in the case of model solution filtration, a sodium dodecyl sulfate solution was used followed by rinsing with water/ethanol to get rid of the surfactants, and ii) in the case of real microalgae extracts fil-tration, a basic commercial product, Ultrasil 110 (Ecolab) was employed. Water permeability was measured before and after cleaning to determine the 5
fouling resistances.
The filtration performances were evaluated by measuring J and the calcu-lation of JJ
w (equation 1) and % F lux decline (equation 2). The cleanability
was evaluated by calculating the resistance of the membrane and reversible 10
and irreversible fouling, using equation 3. Evaluation of membrane
selectiv-ity was based on the retention rate R of the different compounds, calculated
using equation 4 and/or equation 5.
J Jw = T M P µ(Rm+Rf) T M P µRm = Rm Rm+ Rf (1) % F lux decline = Jw− J Jw .100 (2) J = T M P µ(Rm+ Rf) = T M P µ(Rm+ Rirr+ Rrev) (3) lnCR C0 = R ln V RR (4)
R = 1 − CP
CR
(5)
Where J is the permeate flux during the filtration of the emulsion (m3m−2s−1),
Jw is the permeate flux during the filtration of clean water (m3 m−2 s−1),
T M P is the transmembrane pressure (Pa), µ is the permeate viscosity (Pa s),
Rm is the membrane resistance (m−1), Rf is the fouling resistance (m−1),
Rirr is the irreversible fouling resistance (m−1), Rrev is the reversible fouling
5
resistance (m−1), C0 is the concentration in the feed (g L−1), CR is the
con-centration in the retentate (g L−1), CP is the concentration in the permeate
(g L−1), R is the retention rate (-), and V RR is the volume reduction ratio
(-).
2.5. Analytical methods 10
2.5.1. Granulometry
The droplet size distribution measurement for model solutions was per-formed using an optical microscope Axio Scope A1 (Carl Zeiss) with a detec-tion limit of 0.5 µm and image analysis using the software Image J software. Between 30 to 50 photos were taken and analyzed for each sample to guaran-15
tee a number of droplets higher than 5000 and an invariable droplet diameter average. Droplet size distribution with real products was performed using a Mastersizer 3000 (Malvern) with a refractive index of 1.44 and an absorption index of 0.003, using hydro LV and hydro SV samplers.
2.5.2. Gravimetry
Dry matter was measured at 105°C up to constant weight using a moisture
analyzer (Denver Instrument IR-30), which has an integrated scale with a precision of 1 mg and a readability of results of 0.01%. A 5 g sample of retentate and a 20 g sample of permeate were placed in an aluminum weighing 5
cup prior to drying at 105°C. The ash content was measured after calcination
in an oven at 500°C. Analyses were performed in triplicate.
2.5.3. Chemical analysis
The lipids in microalgae extracts were quantified using a modified Bligh
Dyer method, for which a mixture of CHCl3/MeOH 2:1 v/v was mixed for 6h
10
with the biomass. Extraction was followed by solvent drying, transmethyla-tion and GC-FID analysis for total fatty acids quantificatransmethyla-tion. The detailed
protocol has been described by Clavijo Rivera et al. [29]. Proteins were
quantified using the Thermo Scientific Pierce BCA protein assay kit.
Car-bohydrates were quantified using the Dubois method [46]. The chemical
15
analyses, for each sample, were performed in triplicate.
2.5.4. Contact angle measurement
A tensiometer Drop Shape Analyzer - DSA30 (Kruss) was used to
mea-sure the wettability of the clean membranes. The contact angle θw ,
indicat-ing the hydrophilic (θw ≤ 90°) or hydrophobic (θw ≥ 90°) characteristics of
20
the membrane, was determined as follows. Membranes were dried at 35°C
a glass support using tape. A 2.5µL drop was placed on the surface of the membrane using automatic drop dosing and a syringe of 500µL. The DSA software was used to determine the left and right angles formed between the drop and the membrane surface at 100 ms after drop deposition. 12 droplets of water were deposited on different sections of the same membrane sample, 5
increasing the accuracy of the average value of the contact angle (see table1).
3. Results and discussion 3.1. Model solution formulation
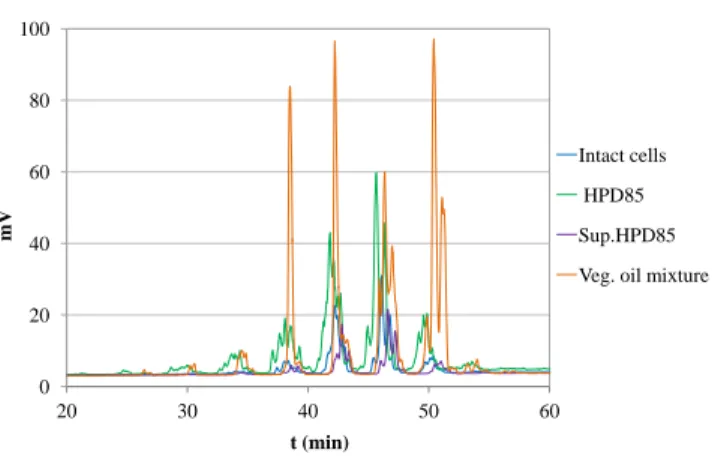
The comparison of high–pressure liquid chromatography (HPLC) pro-10
files of triglycerides from the vegetable oils mixture and the real microalgae
extracts is presented in figure 1. The analysis shows a good concordance
of the triglycerides of both products with some differences in proportion. This vegetable oil mixture was used to formulate the model solution. The lipid phase should have the same sensitivity to temperature and therfore the 15
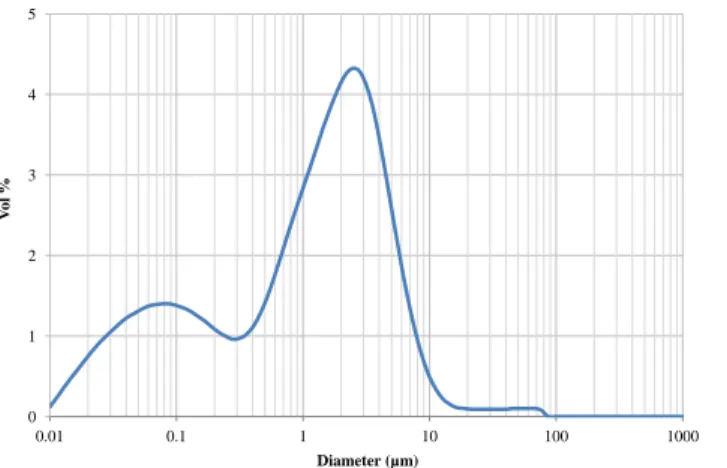
same viscoelasticity properties as microalgae lipids. This point could not be verified because the analysis would necessitate too great a quantity of real products. The droplet size distribution for the model solution obtained
with laser granulometry is presented in figure 2. The distribution is bimodal,
the first mode corresponding to droplets with a median diameter Dv50 of 20
0.07 µm and the second with a median diameter of 1.94 µm. This bimodal distribution showed similar droplet sizes to real extracts from high–pressure
disrupted microalgae despite their different proportions [29]. Depending on the composition and size distribution of the lipid droplets, the emulsion is an appropriate model for the lipids contained in concentrated aqueous extracts of Parachlorella kessleri cultivated in starving conditions.
5
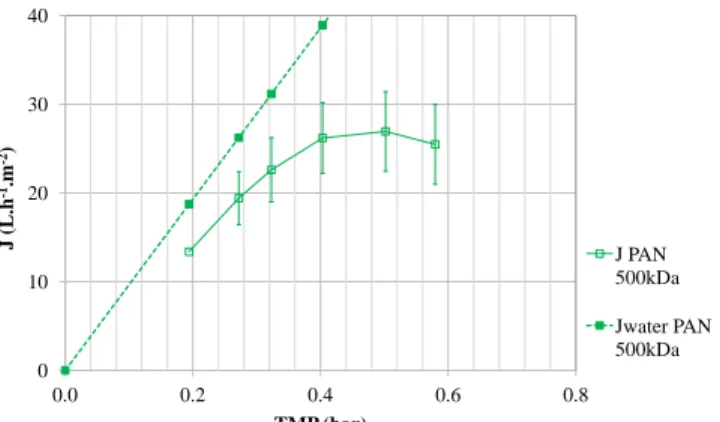
3.2. Membrane selection 3.2.1. Critical pressure
The critical pressure PC was evaluated during filtration of the model
emulsion in a full recycling mode. The permeation flux J was measured against transmembrane pressure TMP and compared to the clean water flux 10
Jw. Figure 3 illustrates the impact of the pressure on the permeation flux
for the 500 kDa PAN membrane. The 500 kDa PAN membrane showed the highest material homogeneity during the conditioning and compaction stages and the least variability between experiments. As the minimum pressure for the experiment set-up was 0.2 bar, it was not possible to measure permeate 15
fluxes at pressures below this value. J < Jwdue to concentration polarisation
and membrane fouling. The experimental curve enabled determination of the
PC above which strong fouling takes place. For the 500 kDa PAN membrane,
PC = 0.3 bar.
Critical pressure values for the different membranes are shown in ta-20
ble 2. Despite the different membrane materials and molecular weight
critical fluxes between 15 and 25 L h−1 m−2. The pressure selected to carry
out concentration of the emulsion (Pconc) was ≤ PC and is presented in
ta-ble 2.
The critical pressures measured and therefore the pressures selected are
sim-ilar to those selected by Giorno et al. [43] and the critical fluxes are of the
5
same magnitude as previous studies [25;43].
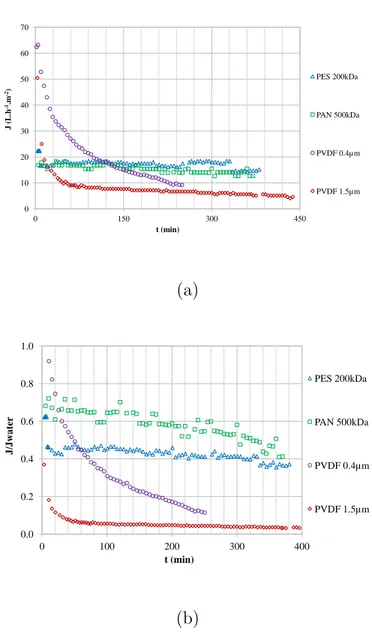
3.2.2. Emulsion filtration
Concentration of the emulsion was performed with a TMP equal to Pconc.
The objective was to evaluate and compare the performances (permeate flux, lipid retention, and membrane cleanability) of the different membranes in the 10
context of lipids concentration.
Permeation fluxes through the membranes against time are presented in
figure 4. The flux is related to the resistance of the membrane, and the
reversible and irreversible fouling using equation3. The ratios J/Jw are also
15
presented to illustrate the impact of the evolution of fouling resistance on
the permeate flux (equation1). Flux declines were calculated using equation
2 (table 3).
Both PVDF membranes presented the highest initial flux but also the
highest flux decline at VRR=2 (volume reduction ratio) (see table 3), 80%
20
for PVDF 0.4 µm, and 97% for PVDF 1.5 µm. This result is related to
pro-gressively, which may be due to progressive pore blocking by droplets with a diameter below the cut-off. The strong decline in permeate flux with the
membrane PVDF 1.5µm for the first hour may be due to the accumulation of
larger lipid droplets above the membrane and also in the porous media. The PVDF membranes present hydrophobic properties which may facilitate inter-5
action with the lipid fraction on the surface and at depth. These results are
consistent with former papers: Lorente et al. [25] also rejected the membrane
with a high MWCO for filtration and Safi et al. [24] noted strong fouling for
the membranes with the highest MWCO. The PAN 500 kDa and the PES 200 kDa have smaller pores than the above membranes; this is why the initial 10
fluxes are smaller, but more stable. PAN and PES are more hydrophilic than
PVDF (cf. the smaller θw < 90 in table 1). The PAN membrane presents
the smallest flux decline (42%) at VRR=2, with the PES 200 kDa being
the second smallest (63% at VRR=2). The slow evolution of the J/Jw ratio
shows the slow evolution of the resistance due to membrane fouling. 15
The lipid concentrations in the retentate (CR) and the permeate (CP)
were compared to the feed (C0) and retention rates R deduced from
equa-tion 4.
The highest retention rates 0.95 were reached with the PAN and PES 20
membranes, and the lowest with the PVDF 0.4 µm and PVDF 1.5 µm,
re-spectively 0.92 and 0.87. A turbide permeate was noted with the PVDF
distribution (figure 2) to the membranes MWCO. A large quantity of the
lipid droplets are of a diameter smaller than 0.4 and 1.5 µm corresponding
to the PVDF membranes.
The PVDF membranes showed low performance for the concentration of the lipids, but may be useful for making the droplets coalesce. The droplet size 5
distribution for droplets above 0.5 µm was measured and the median
diame-ter Dv50 during concentration compared to the initial Dv50 of the emulsion
using optical microscopy (figure 5). A small rise in mean diameter was
ob-served, but contrary to our assumption the hydrophilic membrane PAN led to the highest diameter rise during filtration. The droplets concentrate near 10
the membrane but their limited interaction with the hydrophilic membrane may promote interaction with each other leading to coalescence. A higher
VRR would lead to a higher CR which could facilitate coalescence, but this
would necessitate a larger feed volume and filtration time or a larger mem-brane area with a limited dead volume, which is not possible with the current 15
experimental set-up.
Cleanability was evaluated by calculating the resistance to water perme-ation due to reversible (before chemical cleaning) and irreversible fouling (af-ter chemical cleaning). The membrane showing the lowest fouling resistance 20
was the PAN 500 kDa (table 4). The 1.5 µm PVDF showed the strongest
reversible fouling and the 0.4 µm PVDF the highest irreversible fouling.
the recovery of lipids at industrial scale will necessitate high and stable fluxes, a good lipid retention and high cleanability. After comparing membranes performances, the PAN 500 kDa membrane was selected as the most suitable for lipid concentration from real microalgae extracts.
3.3. Microalgae extracts filtration 5
Two Parachlorella kessleri cultures at 1g L−1 were used to produce two
batches of clarified supernatant for filtration tests at pilot scale (SN1 and
SN2, see part 2.2). The supernatants were filtered using the crossflow
filtra-tion set-up equipped with a PAN 500 kDa membrane. The composifiltra-tion of
the supernatants is described in table 5. Their dry matter is 10 times less
10
concentrated than the model solution which was chosen to simulate highly concentrated mixtures. The lipid content is also lower, corresponding to 8-12% of the dry matter. The large volume cultures were less rich in lipids
than previous ones [29]. The pH and conductivity are of the same order of
magnitude as the ones in the model solution. The difference in the com-15
position was expected. The supernatant composition was impacted by the culture, the bead milling and the centrifugation conditions. Some variation of the starving condition cultures and the non optimized clarification
proto-cole may explain the low lipid content in SN1 and SN2. The one-pass bead
milling in experiment 2 also explains the lower protein concentrations in SN2
20
compared to SN1. 5000L of culture would have been necessary to perform
was not possible in this study. The lower concentration of the supernatants allowed a higher transmembrane pressure of 0.4 bar to be used (the critical
pressure was estimated at 0.45 bar with SN1and SN2). In the following
para-graphs the PAN membrane performances for filtration of the real products in concentration mode are compared to the filtration with the model solution. 5
The fluxes are presented in table 6 and figure 6. The experiments were
performed with different TMP and initial water fluxes of the membrane pieces
(widespread in membrane filtration at laboratory scale). Thus the JJ
w ratio
was used for comparison. In figure 6 (a), one representative example of
emulsion filtration is compared to SN1 and SN2 filtrations. In figure 6 (b),
10
mean values based on three emulsion filtration experiments are compared to
SN1 and SN2 filtrations. JJw values were very similar for the filtrations using
emulsion and real supernatants, maintained at between 0.38 and 0.75. Strong fouling seems to occur at the early stage of the real–products filtration (first hour) but stabilizes after 2 hours. This may be due to lipids but also to 15
other organic compounds (proteins or polysaccharides), which are known to be common foulants. According to the results with the concentrated model solution, we can suppose that the performances would be maintained during concentration. In laboratory conditions, the maximum volume reduction ra-tio which could be achieved was 4. Good cleanability was also noted despite 20
the more complicated composition of the real solution: in both experiments the irreversible fouling resistance was between 6 and 16% of the global
fouling resistance. The PAN membrane is thus very interesting for filtering supernatant with stable fluxes at various concentrations when selecting the appropriate TMP.
It might be interesting to investigate the interactions between lipids, pro-5
teins, polysaccharides and the membrane. The filtration of more complex model solutions containing proteins would help in understanding the role of
the interactions on the process performances. According to Wang et al. [47]
some of the proteins are linked to the lipid droplets. It is known that the destabilization of such emulsions into separate lipids and proteins is diffi-10
cult [48]. Lipids, proteins and polysaccharides are also able to create strong
membrane fouling, and specific analytical methods are needed to
character-ize them [49; 50]. These interactions influence the filtration performances,
all the more when the concentration rises. This point should be thoroughly studied in a future work.
15
The flux and the ratio JJ
w in this work are higher than those presented
by Lorente et al. [25] and Safi et al. [24] (the water permeability of the
PES 300 kDa membrane used by Safi et al. [24] was considered the same
as the PES 200 kDa used in this work). The differences can be explained 20
by the different clarification of the filtered product: the cell fragments may generate a strong fouling. Hawever, the choice of the membrane type and the operating conditions is also crucial. Filtration at a TMP far above the
critical pressure, as may be the case for Lorente et al. [25] and Safi et al.
[24], leads to higher membrane fouling. The resistance of the irreversible
fouling calculated from Lorente et al. data [25] using the equation 3 was 20
to 54 1012m−1 for the best conditions, which is 100 times higher than the
irreversible fouling measured in this work. 5
The concentrations of the different compounds in feed, retentate, and
permeate after filtration are detailed in table5. The ash represents the
min-eral content and is approximately half of the feed dry matter. The minmin-erals can be linked to the organic matter or free ionic species in solution.The 10
organic matter is mostly composed of lipids, proteins and polysaccharides. The retention of the lipids, proteins, polysaccharides, and salts (free ionic species in the aqueous phase assimilated to conductivity) was evaluated us-ing their concentration in the retentate and permeate at VRR=2 accordus-ing
to equation 5. In both cases, the lipids are wholly retained (Rlipids=1) and
15
the salts are seldom retained (Rsalts=0.12 and 0.04 for SN1 and SN2
re-spectively). The retention of proteins and polysaccharides depends on the
supernatant: Rproteins= 1 and 0.55, Rpolysaccharides= 0.74 and 0.38 for SN1
and SN2 respectively. This is probably due to the differences in the culture
batch and the bead milling conditions. SN1 comes from a strong disruption
20
of the cells, leading to the release of many compounds (lipids and proteins,
see table 5) among which some amphiphilic molecules are from the cell
a modification of the compounds may appear (hydrolysis due to the release of enzymes in the medium, polymerization or precipitation for example) or the released molecules may reorganize (new aggregates), leading to very dif-ferent retentions. These results showed that protein retention is dependent on the cell disruption conditions, consistent with the results described by Safi 5
et al. [24]. Nevertheless, the PAN membrane is likely to allow hydrophilic
compounds to permeate. Optimized coupling of the processes of culture, cell disruption and filtration would allow the separation of lipids from proteins and polysaccharides. The mass balance was performed using the equation
6 to estimate wether any matter was accumulated on the membrane during
10
the filtration.
VSNiCSNi = VRETiCRETi + VP ERMiCP ERMi + dmi (6)
where V is the volume and C the concentration of the different compounds, dm is the mass variation if some material is accumulated on the membrane during the filtration. 2 L of feed, 1 L of permeate and 1 L of retentate were
considered at VRR = 2. The results are presented in table 5. No significant
15
mass loss dm was calculated according to the used analytical methods and their uncertainty. The analyses were not accurate enough to estimate the mass of compounds leading to membrane fouling. The negative values for sugar were due to the analytical method uncertainty.
The granulometry measurements showed that SN1 contained smaller
ticles compared to SN2 (figure7). Droplet size distribution also differed from
the results presented by Clavijo et al. [29]. This is due to the difference in cell disruption methods. The particle or droplet distributions did not change dur-ing either of the filtration experiments. No coalescence was noticed because of the low concentration of the filtered solutions, reducing the probability of 5
droplet collisions. Where the concentration was increased to the same mag-nitude as in the model solution (i.e. at a higher VRR), coalescence could appear.
4. Conclusions 10
This work proposes membrane cross-flow filtration for the recovery of lipids from starving Parachlorella kessleri aqueous extracts obtained after milling and centrifugation. Selection of the appropriate membrane for the lipids concentration necessitates a mixture with a controlled composition, so a model solution was formulated. The composition was based on the anal-15
ysis of real products. The use of this model solution allowed selection of a PAN 500 kDa membrane for filtering real microalgae extracts. The PAN membrane gave the best performance in terms of flux, lipid retention and cleanability. Despite the differences in composition between real aqueous ex-tracts and the model solution, permeation flux through the PAN membrane 20
was similar (34 - 41 L h−1 m−2). The lipids were wholly retained whereas
the high potential of cross-flow filtration in a microalgae biorefinering for the recovery of oil, as well as the importance of the membrane selection and operating conditions to boost the droplets coalescence. Additional studies using model solutions with different compositions would be useful to establish the effect of the composition on filtration performance. Further studies on a 5
larger scale with higher VRR using real solutions with a higher lipid content are needed to determine the optimal operating conditions for oil droplet coa-lescence. Additionally, coupling between culture, cell disruption, clarification and filtration should allow a good concentration of lipids and the appropriate separation of lipids and hydrophilic compounds in microalgae biorefineries. 10
Acknowledgments. to be added after the double-blind review Declaration of interest: none.
References
[1] L. Xu, D. W. F. Brilman, J. A. M. Withag, G. Brem, S.
Ker-sten, Assessment of a dry and a wet route for the
produc-tion of biofuels from microalgae: Energy balance analysis,
Bioresource Technology 102 (8) (2011) 5113–5122. doi:http:
//dx.doi.org/10.1016/j.biortech.2011.01.066.
URL http://www.sciencedirect.com/science/article/pii/ S0960852411001386
of lipid from microalgae for biodiesel production, Algal Research 7 (0)
(2015) 117–123. doi:http://dx.doi.org/10.1016/j.algal.2014.
10.008.
URL http://www.sciencedirect.com/science/article/pii/ S2211926414001088
[3] R. Halim, T. W. T. Rupasinghe, D. L. Tull, P. A.
Web-ley, Modelling the kinetics of lipid extraction from wet mi-croalgal concentrate: A novel perspective on a classical
pro-cess, Chemical Engineering Journal 242 (0) (2014) 234–253.
doi:http://dx.doi.org/10.1016/j.cej.2013.12.070.
URL http://www.sciencedirect.com/science/article/pii/ S1385894713016513
[4] J.-Y. Park, M. S. Park, Y.-C. Lee, J.-W. Yang, Advances
in direct transesterification of algal oils from wet biomass,
Bioresource Technology 184 (0) (2015) 267–275. doi:http:
//dx.doi.org/10.1016/j.biortech.2014.10.089.
URL http://www.sciencedirect.com/science/article/pii/ S0960852414015211
[5] S. Dickinson, M. Mientus, D. Frey, A. Amini-Hajibashi, S. Ozturk,
F. Shaikh, D. Sengupta, M. M. El-Halwagi, A review of biodiesel
19 (3) (2017) 637–668. doi:10.1007/s10098-016-1309-6. URL https://doi.org/10.1007/s10098-016-1309-6
[6] D. Chiaramonti, M. Prussi, M. Buffi, A. M. Rizzo, L. Pari, Review and experimental study on pyrolysis and hydrothermal liquefaction of microalgae for biofuel production, Applied Energy 185 (2017) 963–972.
doi:10.1016/j.apenergy.2015.12.001.
[7] Y. Su, K. Song, P. Zhang, Y. Su, J. Cheng, X. Chen, Progress
of microalgae biofuel’s commercialization, Renewable and
Sus-tainable Energy Reviews 74 (2017) 402–411. doi:https:
//doi.org/10.1016/j.rser.2016.12.078.
URL http://www.sciencedirect.com/science/article/pii/ S1364032116311352
[8] S. Khanra, M. Mondal, G. Halder, O. N. Tiwari, K. Gayen,
T. K. Bhowmick, Downstream processing of microalgae for
pigments, protein and carbohydrate in industrial applica-tion: A review, Food and Bioproducts Processingdoi:https: //doi.org/10.1016/j.fbp.2018.02.002.
URL http://www.sciencedirect.com/science/article/pii/ S0960308518300105
[9] G. P. Lam, M. H. Vermu¨e, M. H. M. Eppink, R. H. Wijffels,
towards reality, Trends in Biotechnology 36 (2) (2018) 216–227.
doi:https://doi.org/10.1016/j.tibtech.2017.10.011.
URL http://www.sciencedirect.com/science/article/pii/ S0167779917302755
[10] G. F. Ferreira, L. F. R´ıos Pinto, R. Maciel Filho, L. V.
Frego-lente, A review on lipid production from microalgae: Association
between cultivation using waste streams and fatty acid profiles, Renewable and Sustainable Energy Reviews 109 (2019) 448–466.
doi:https://doi.org/10.1016/j.rser.2019.04.052.
URL http://www.sciencedirect.com/science/article/pii/ S1364032119302643
[11] M. L. Menegazzo, G. G. Fonseca, Biomass recovery and lipid
ex-traction processes for microalgae biofuels production: A review, Renewable and Sustainable Energy Reviews 107 (2019) 87–107.
doi:https://doi.org/10.1016/j.rser.2019.01.064.
URL http://www.sciencedirect.com/science/article/pii/ S1364032119300577
[12] P. Jaouen, L. Vandanjon, F. Quemeneur, The shear stress of microalgal
cell suspensions (tetraselmis suecica) in tangential flow filtration sys-tems: the role of pumps, Bioresource Technology 68 (2) (1999) 149–154.
doi:10.1016/s0960-8524(98)00144-8. URL <GotoISI>://WOS:000078343200006
[13] M. Frappart, A. Masse, M. Y. Jaffrin, J. Pruvost, P. Jaouen, Influence of hydrodynamics in tangential and dynamic ultrafiltration systems for microalgae separation, Desalination 265 (1-3) (2011) 279–283. doi: 10.1016/j.desal.2010.07.061.
URL <GotoISI>://WOS:000285449800039
[14] S. D. Rios, J. Salvado, X. Farriol, C. Torras, Antifouling microfiltration
strategies to harvest microalgae for biofuel, Bioresource Technology 119
(2012) 406–418. doi:10.1016/j.biortech.2012.05.044.
URL <GotoISI>://WOS:000307617600052
[15] M. R. Bilad, V. Discart, D. Vandamme, I. Foubert, K. Muylaert, I. F.
Vankelecom, Coupled cultivation and pre-harvesting of microalgae in a
membrane photobioreactor (mpbr), Bioresour Technol 155 (2014) 410– 7. doi:10.1016/j.biortech.2013.05.026.
URL http://www.ncbi.nlm.nih.gov/pubmed/24559585
[16] M. L. Gerardo, S. Van Den Hende, H. Vervaeren, T. Coward, S. C. Skill, Harvesting of microalgae within a biorefinery approach: A review of the developments and case studies from pilot-plants, Algal Research
11 (2015) 248–262. doi:10.1016/j.algal.2015.06.019.
[17] F. Zhao, H. Chu, X. Tan, Y. Zhang, L. Yang, X. Zhou, J. Zhao,
Com-parison of axial vibration membrane and submerged aeration mem-brane in microalgae harvesting, Bioresour Technol 208 (2016) 178–183.
doi:10.1016/j.biortech.2016.02.099.
URL https://www.ncbi.nlm.nih.gov/pubmed/26943935
[18] F. Fasaei, J. H. Bitter, P. M. Slegers, A. J. B. van Boxtel, Techno-economic evaluation of microalgae harvesting and dewatering systems,
Algal Research 31 (2018) 347–362. doi:10.1016/j.algal.2017.11.
038.
[19] N. Rossignol, P. Jaouen, J.-M. Robert, F. Qu´em´eneur,
Produc-tion of exocellular pigment by the marine diatom haslea ostrearia simonsen in a photobioreactor equipped with immersed ultrafiltra-tion membranes, Bioresource Technology 73 (2) (2000) 197–200.
doi:https://doi.org/10.1016/S0960-8524(99)00171-6.
URL http://www.sciencedirect.com/science/article/pii/ S0960852499001716
[20] M. L. Gerardo, D. L. Oatley-Radcliffe, R. W. Lovitt, Integration of membrane technology in microalgae biorefineries, Journal of Membrane
Science 464 (2014) 86–99. doi:https://doi.org/10.1016/j.memsci.
2014.04.010.
[21] A. Marcati, A. V. Ursu, C. Laroche, N. Soanen, L. Marchal, S. Jubeau,
G. Djelveh, P. Michaud, Extraction and fractionation of
polysaccha-rides and b-phycoerythrin from the microalga porphyridium cruentum by membrane technology, Algal Research 5 (0) (2014) 258–263.
doi:http://dx.doi.org/10.1016/j.algal.2014.03.006.
URL http://www.sciencedirect.com/science/article/pii/ S2211926414000307
[22] A.-V. Ursu, A. Marcati, T. Sayd, V. Sante-Lhoutellier,
G. Djelveh, P. Michaud, Extraction, fractionation and
func-tional properties of proteins from the microalgae chlorella vulgaris, Bioresource Technology 157 (0) (2014) 134–139.
doi:http://dx.doi.org/10.1016/j.biortech.2014.01.071.
URL http://www.sciencedirect.com/science/article/pii/ S0960852414000960
[23] V. Montalescot, R. Touchard, M. Frappart, J. Pruvost, P. Jaouen, P. Bourseau, Potential of membrane fractionation of wet microalgal biomass: metabolites recovery after cell disruption, in: 10th European Congress of Chemical Engineering – ECCE10, 2015.
[24] C. Safi, G. Olivieri, R. P. Campos, N. Engelen-Smit, W. J. Mulder,
L. A. M. van den Broek, L. Sijtsma, Biorefinery of microalgal soluble
proteins by sequential processing and membrane filtration, Bioresour
Technol 225 (2017) 151–158. doi:10.1016/j.biortech.2016.11.068.
URL https://www.ncbi.nlm.nih.gov/pubmed/27888732
[25] E. Lorente, M. Haponska, E. Clavero, C. Torras, J. Salvad´o, Microalgae
membrane filtration, Bioresource Technology 237 (2017) 3–10. doi: 10.1016/j.biortech.2017.03.129.
[26] R. Balti, R. Le Balc’h, N. Brodu, M. Gilbert, B. Le Gouic, S. Le Gall,
C. Sinquin, A. Mass´e, Concentration and purification of
porphyrid-ium cruentum exopolysaccharides by membrane filtration at vari-ous cross-flow velocities, Process Biochemistry 74 (2018) 175–184.
doi:https://doi.org/10.1016/j.procbio.2018.06.021.
URL http://www.sciencedirect.com/science/article/pii/ S1359511318304847
[27] R. Halim, B. Gladman, M. K. Danquah, P. A. Webley, Oil extraction
from microalgae for biodiesel production, Bioresource Technology
102 (1) (2011) 178–185. doi:http://dx.doi.org/10.1016/j.
biortech.2010.06.136.
URL http://www.sciencedirect.com/science/article/pii/ S0960852410011399
[28] W. J. Bjornsson, K. M. MacDougall, J. E. Melanson, S. J. B. O’Leary,
P. J. McGinn, Pilot-scale supercritical carbon dioxide extractions for
the recovery of triacylglycerols from microalgae: a practical tool for algal biofuels research, Journal of Applied Phycology 24 (3) (2012) 547– 555. doi:10.1007/s10811-011-9756-2.
URL <GotoISI>://WOS:000304187100030
M. Frappart, C. Monteux, E. Couallier, Mechanical cell disruption of parachlorella kessleri microalgae: Impact on lipid fraction composition,
Bioresour Technol 256 (2018) 77–85. doi:10.1016/j.biortech.2018.
01.148.
URL https://www.ncbi.nlm.nih.gov/pubmed/29433049
[30] J. B. Snape, M. Nakajima, Processing of agricultural fats and oils using membrane technology, Journal of Food Engineering 30 (1996) 1–41. [31] M. Cheryan, N. Rajagopalan, Membrane processing of oily streams .
wastewater treatment and waste reduction 151.
[32] J. M. Dickhout, J. Moreno, P. M. Biesheuvel, L. Boels,
R. G. H. Lammertink, W. M. de Vos, Produced water
treat-ment by membranes: A review from a colloidal perspective,
Journal of Colloid and Interface Science 487 (2017) 523–534.
doi:https://doi.org/10.1016/j.jcis.2016.10.013.
URL http://www.sciencedirect.com/science/article/pii/ S0021979716307652
[33] P. Kajitvichyanukul, Y.-T. Hung, L. K. Wang, Membrane Technologies for Oil–Water Separation, Vol. 13: Membrane and desalination
tech-nologies, 2011, pp. 639–668. doi:10.1007/978-1-59745-278-6_15.
[34] M. Hlavacek, Break-up of oil-in-water emulsions induced by permeation through a microfiltration membrane 102 (1995) 1–7.
[35] U. Daiminger, W. Nitsch, P. Plucinski, S. Hoffmann, Novel techniques for oil-water separation, Journal of Membrane Science 99 (2) (1995) 197– 203. doi:10.1016/0376-7388(94)00218-n.
URL <GotoISI>://WOS:A1995QM53300009
[36] A. Koltuniewicz, R. Field, T. Arnot, Cross-flow and dead-end microfil-tration of oily-water emulsion. part i: Experimental study and analysis of flux decline, Journal of Membrane Science 102 (1995) 193–207. [37] Y. Hu, J. Dai, Hydrophobic aggregation of alumina in surfactant
solu-tion, Minerals Engineering 16 (11) (2003) 1167–1172. doi:10.1016/j.
mineng.2003.07.018.
[38] L. Susan, S. Ismail, B. Ooi, H. Mustapa, Surface morphology of pvdf membrane and its fouling phenomenon by crude oil emulsion, Journal of water process engineering 15 (2017) 55–61.
[39] N. Scharnagl, H. Buschatz, Polyacrylonitrile (pan) membranes for
ultra- and microfiltration, Desalination 139 (1) (2001) 191–198.
doi:https://doi.org/10.1016/S0011-9164(01)00310-1.
URL http://www.sciencedirect.com/science/article/pii/ S0011916401003101
[40] N. N. Li, A. G. Fane, W. Winston Ho, T. Matsuura, Advanced Mem-brane Technology and Applications, Wiley, 2008.
[41] Y. Peng, F. Guo, Q. Wen, F. Yang, Z. Guo, A novel polyacrylonitrile membrane with a high flux for emulsified oil/water separation,
Separa-tion and PurificaSepara-tion Technology 184 (2017) 72–78. doi:10.1016/j.
seppur.2017.04.036.
[42] A. Hong, A. G. Fane, R. Burford, Factors affecting membrane coa-lescence of stable oil-in-water emulsions, Journal of Membrane Science
222 (1-2) (2003) 19–39. doi:10.1016/s0376-7388(03)00137-6.
[43] F. Giorno, R. Mazzei, L. Giorno, Purification of triacylglycerols
for biodiesel production from nannochloropsis microalgae by mem-brane technology, Bioresource Technology 140 (0) (2013) 172–178.
doi:http://dx.doi.org/10.1016/j.biortech.2013.04.073.
URL http://www.sciencedirect.com/science/article/pii/ S0960852413006962
[44] V. Montalescot, T. Rinaldi, R. Touchard, S. Jubeau, M. Frappart, P. Jaouen, P. Bourseau, L. Marchal, Optimization of bead milling pa-rameters for the cell disruption of microalgae: Process modeling and application to porphyridium cruentum and nannochloropsis oculata,
Bioresource Technology 196 (2015) 339–346. doi:https://doi.org/
10.1016/j.biortech.2015.07.075.
[45] T. R. Zinkone, I. Gifuni, L. Lavenant, J. Pruvost, L. Marchal, Bead
optimiza-tion and applicaoptimiza-tion to biomolecules recovery from chlorella
sorokini-ana, Bioresour Technol 267 (2018) 458–465.doi:10.1016/j.biortech.
2018.07.080.
URL https://doi.org/10.1016/j.biortech.2018.07.080
[46] M. Dubois, K. A. Gilles, Colorimetric method for determination of sug-ars and related substances, Analytical Chemistry.
[47] X. Wang, T.-B. Hao, S. Balamurugan, W.-D. Yang, J.-S. Liu, H.-P. Dong, H.-Y. Li, A lipid droplet-associated protein involved in lipid droplet biogenesis and triacylglycerol accumulation in the oleaginous microalga phaeodactylum tricornutum, Algal Research 26 (2017) 215– 224. doi:10.1016/j.algal.2017.07.028.
[48] R. Morales Chabrand, H.-J. Kim, C. Zhang, C. E. Glatz, S. Jung, Desta-bilization of the emulsion formed during aqueous extraction of soybean oil, Journal of the American Oil Chemists’ Society 85 (4) (2008) 383– 390. doi:10.1007/s11746-008-1199-9.
[49] D. Delaunay, M. Rabiller-Baudry, J. M. Goz´alvez-Zafrilla, B.
Bal-annec, M. Frappart, L. Paugam, Mapping of protein fouling by
ftir-atr as experimental tool to study membrane fouling and fluid velocity profile in various geometries and validation by cfd simulation, Chem. Eng. Process. 47 (7) (2008) 1106 – 1117, euromembrane 2006.
URL http://www.sciencedirect.com/science/article/pii/ S025527010700390X
[50] V. Drevet, E. Clavijo, L. Villafa˜na L´opez, M. Frappart, E. Couallier,
A. Szymczyk, M. Rabiller Baudry, Characterisation of the fouling of an ultrafiltration polyethersulfone membrane fouled by an emulsion mod-elling lipids issued from microalgae, in: ICOM, 2017.
List of Figures
1 Comparison of triglycerides profiles from the vegetable oils mixture and intact Parachlorella kessleri cells, ground cells
(High Pressure Disruption 85%, HPD85) and supernatant (Sup.HPD85) after centrifugation. . . 41
2 Droplet size distribution (volume) of the initial emulsion be-fore filtration obtained with laser granulometry. . . 42
3 Filtration of the model emulsion with a PAN 500 kDa mem-brane in full recycling mode (constant temperature 30°C, con-stant cross-flow velocity 1 ms−1) to determine critical pressure: measurement of flux J versus transmembrane pressure TMP with water (filled squares) and with the model solution (empty square). . . 43
4 Filtration of the model emulsion in concentration mode with the different membranes: (a) flux J and (b) ratio J/Jw versus
time (constant temperature 30°C, constant cross-flow velocity 1 ms−1, PTM = 0.2 bar). . . 44
5 Evolution of the Dv50 for droplets with a diameter above 0.5 µm during the concentration of model emulsion versus the volume reduction ratio for different membranes. . . 45
6 Comparison of crossflow filtrations of the model solution and the two supernatants SN1 and SN2in concentration mode with
a PAN 500 kDa membrane. Constant temperature 30°C, con-stant cross-flow velocity 1 ms−1. The TMP was 0.2 bar for the model solution, 0.4 bar for SN1 and SN2 : ratio J/Jw
ver-sus time (a) and VRR (b). Comparison with the results from Lorente et al. [25] and Safi et al. [24] (TMP = 5 bar for Lorente et al. [25] and 2.07 bar for Safi et al. [24]) . . . 46
7 Droplet size distribution (volume) for supernatants SN1 and
0 20 40 60 80 100 20 30 40 50 60 mV t (min) Intact cells HPD85 Sup.HPD85 Veg. oil mixture
Figure 1 – Comparison of triglycerides profiles from the vegetable oils mixture and intact Parachlorella kessleri cells, ground cells (High Pressure Disruption 85%, HPD85) and supernatant (Sup.HPD85) after centrifugation.
0 1 2 3 4 5 0.01 0.1 1 10 100 1000 V o l % Diameter (µm)
Figure 2 – Droplet size distribution (volume) of the initial emulsion before filtration obtained with laser granulometry.
0 10 20 30 40 0.0 0.2 0.4 0.6 0.8 J (L.h -1.m -2) TMP (bar) J PAN 500kDa Jwater PAN 500kDa
Figure 3 – Filtration of the model emulsion with a PAN 500 kDa mem-brane in full recycling mode (constant temperature 30°C, constant cross-flow velocity 1 ms−1) to determine critical pressure: measurement of flux J versus transmembrane pressure TMP with water (filled squares) and with the model solution (empty square).
0 10 20 30 40 50 60 70 0 150 300 450 J (L.h -1.m -2) t (min) PES 200kDa PAN 500kDa PVDF 0.4µm PVDF 1.5µm (a) 0.0 0.2 0.4 0.6 0.8 1.0 0 100 200 300 400 J/J w at er t (min) PES 200kDa PAN 500kDa PVDF 0.4µm PVDF 1.5µm (b)
Figure 4 – Filtration of the model emulsion in concentration mode with the different membranes: (a) flux J and (b) ratio J/Jw versus time (constant
1.0 1.2 1.4 1.6 1.8 1 2 3 4 5 Dv50 VRR n / Dv 50 VRR 1 VRR PES 200kDa PAN 500kDa PVDF 0.4µm PVDF 1.5µm
Figure 5 – Evolution of the Dv50 for droplets with a diameter above 0.5µm during the concentration of model emulsion versus the volume reduction ratio for different membranes.
(a)
(b)
Figure 6 – Comparison of crossflow filtrations of the model solution and the two supernatants SN1 and SN2 in concentration mode with a PAN 500 kDa
membrane. Constant temperature 30°C, constant cross-flow velocity 1 ms−1.
The TMP was 0.2 bar for the model solution, 0.4 bar for SN1 and SN2 : ratio
J/Jw versus time (a) and VRR (b). Comparison with the results from Lorente
et al. [25] and Safi et al. [24] (TMP = 5 bar for Lorente et al. [25] and 2.07 bar for Safi et al. [24])
SN2
Figure 7 – Droplet size distribution (volume) for supernatants SN1 and SN2
List of Tables
1 Characteristics of the membranes used in this study. Molar weight cut-off (MWCO), contact angle ( θw). . . 49
2 Critical Pressure PC, critical flux JC, maximum pressure Pmax
and maximum flux Jmax measured during filtration of the
model emulsion in full recycling mode on the different mem-branes and pressure selected for the concentration step Pconc. . 50
3 Water flux Jw (L h−1 m−2) measured at Pconc, permeate flux
J (L h−1 m−2) at VRR = 2 measured during filtration of the model emulsion at the concentration step, and flux decline (%) at VRR = 2 for the different membranes. . . 51
4 Resistance (x1012 m−1) to the permeation flow due to the
membrane media (Rm), reversible fouling(Rrev) and irreversible
fouling (Rirr), leading to a total resistance Rtot during
filtra-tion of the model solufiltra-tion with four different membranes. . . . 52
5 Composition of the supernatants SN1 and SN2 of bead-milled
Parachlorella kessleri cultures before filtration and composi-tion of the retentates and permeates sampled at volume reduc-tion ratio VRR=2 for both filtrareduc-tion experiments. DM: Dry matter (g L−1). Cond.: conductivity (µS cm−1). Lipids, pro-teins, sugar, ash: in g L−1. dm the mass variation (g) if some material accumulated on the membrane during the filtration (estimated through mass balance). . . 53
6 Comparison of the fluxes (L h−1m−2) and permeabilities (L h−1m−2bar−1) obtained during filtration of SN1 and SN2 with a PAN
mem-brane at 0.4bar (Several memmem-brane pieces were used, present-ing a variation of water permeability before filtration, due to material non homogeneity). . . 54
7 Resistance to the permeation flow (1012m−1) due to the
mem-brane media (Rm), reversible fouling(Rrev) and irreversible
fouling (Rirr), leading to a total resistance Rtot during the
filtration of the model solution, SN1 and SN2 with the PAN
Table 1 – Characteristics of the membranes used in this study. Molar weight cut-off (MWCO), contact angle ( θw).
Polymer MWCO Classification θw (°)
PES 200 kDa UF 79.4 ± 0.5 PAN 500 kDa UF 75.0 ± 2.4
PVDF 0.4µm MF 95.1 ± 1.2
Table 2 – Critical Pressure PC, critical flux JC, maximum pressure Pmax
and maximum flux Jmax measured during filtration of the model emulsion in
full recycling mode on the different membranes and pressure selected for the concentration step Pconc.
Polymer MWCO PC (bar) JC (L h−1 m−2) Pmax (bar) Jmax (L h−1 m−2) Pconc (bar)
PES 200 kDa 0.3 25 ± 15 0.4 25 ± 15 0.2
PAN 500 kDa 0.3 17 ± 5 0.4 20 ± 5 0.2
PVDF 0.4µm 0.2 15 ± 5 0.2 15 ± 5 0.2
Table 3 – Water flux Jw (L h−1 m−2) measured at Pconc, permeate flux J
(L h−1 m−2) at VRR = 2 measured during filtration of the model emulsion at the concentration step, and flux decline (%) at VRR = 2 for the different membranes.
Polymer cut off Jw J % F lux decline
PES 200 kDa 40 15 63
PAN 500 kDa 26 15 42
PVDF 0.4 µm 80 16 80
Table 4 – Resistance (x1012m−1) to the permeation flow due to the membrane media (Rm), reversible fouling(Rrev) and irreversible fouling (Rirr), leading to
a total resistance Rtotduring filtration of the model solution with four different
membranes.
Polymer cut off Rm Rrev Rirr Rtot
PES 200 kDa 2.9 4.0 0.8 7.7 PAN 500 kDa 1.4 2.2 0.2 3.7 PVDF 0.4 µm 1.4 3.1 5.1 9.6 PVDF 1.5 µm 0.7 26 0.1 26.8
Table 5 – Composition of the supernatants SN1 and SN2 of bead-milled
Parachlorella kessleri cultures before filtration and composition of the reten-tates and permeates sampled at volume reduction ratio VRR=2 for both filtra-tion experiments. DM: Dry matter (g L−1). Cond.: conductivity (µS cm−1). Lipids, proteins, sugar, ash: in g L−1. dm the mass variation (g) if some ma-terial accumulated on the membrane during the filtration (estimated through mass balance).
SN1 RET1 PERM1 dm 1 SN2 RET2 PERM2 dm 2
DM 2.0 ±0.1 2.8 1.1 0.1 ±0.2 1.4 ±0.1 1.6 1 0.2 ±0.2 Lipids 0.16 ±0.02 0.29 0 0.03 ±0.04 0.17 ±0.02 0.3 0 0.04 ±0.04 Proteins 0.38 ±0.05 0.60 0 0.16 ±0.1 0.19 ±0.03 0.27 0.12 0.01 ±0.06 Sugar 0.45 ±0.04 0.95 0.25 -0.3 ±0.08 0.32 ±0.07 0.50 0.23 -0.09 ±0.08 Ash 1.05 ±0.1 0.95 ±0.25 Cond. 1049 ±8 1211 1024 993 ±20 1004 969 pH 7.60 7.9 8.1 7.2 7.3 7.5
Table 6 – Comparison of the fluxes (L h−1 m−2) and permeabilities (L h−1 m−2 bar−1) obtained during filtration of SN1 and SN2 with a PAN
membrane at 0.4bar (Several membrane pieces were used, presenting a varia-tion of water permeability before filtravaria-tion, due to material non homogeneity).
SN1 SN2 Water flux Jw 72 95 Water permeability Lw 180 237 Initial flux Ji 52 70 Initial permeability Li 130 175 Flux(VRR=2) JV RR=2 34 41 Permeability (VRR=2) LV RR=2 84 103
Table 7 – Resistance to the permeation flow (1012m−1) due to the membrane media (Rm), reversible fouling(Rrev) and irreversible fouling (Rirr), leading
to a total resistance Rtot during the filtration of the model solution, SN1 and
SN2 with the PAN membrane.
filtered solution Rm Rrev Rirr Rtot
model solution 1.4 2.2 0.15 3.7
SN1 2 1.9 0.37 4.3