HAL Id: hal-00978153
https://hal.inria.fr/hal-00978153
Submitted on 12 Apr 2014
HAL is a multi-disciplinary open access
archive for the deposit and dissemination of
sci-entific research documents, whether they are
pub-lished or not. The documents may come from
teaching and research institutions in France or
abroad, or from public or private research centers.
L’archive ouverte pluridisciplinaire HAL, est
destinée au dépôt et à la diffusion de documents
scientifiques de niveau recherche, publiés ou non,
émanant des établissements d’enseignement et de
recherche français ou étrangers, des laboratoires
publics ou privés.
Bridging Data in the Clouds: An Environment-Aware
System for Geographically Distributed Data Transfers
Radu Tudoran, Alexandru Costan, Rui Wang, Luc Bougé, Gabriel Antoniu
To cite this version:
Radu Tudoran, Alexandru Costan, Rui Wang, Luc Bougé, Gabriel Antoniu.
Bridging Data in
the Clouds: An Environment-Aware System for Geographically Distributed Data Transfers. 14th
IEEE/ACM International Symposium on Cluster, Cloud and Grid Computing, May 2014, Chicago,
United States. �hal-00978153�
Bridging Data in the Clouds: An
Environment-Aware System for Geographically
Distributed Data Transfers
Radu Tudoran∗‡, Alexandru Costan†, Rui Wang∗, Luc Boug´e ‡, Gabriel Antoniu∗
∗INRIA Rennes - Bretagne Atlantique, France †IRISA / INSA Rennes, France †IRISA / ENS Rennes, France
{radu.tudoran, rui.wang, gabriel.antoniu}@inria.fr [email protected] [email protected]
Abstract—Today’s continuously growing cloud infrastructures provide support for processing ever increasing amounts of sci-entific data. Cloud resources for computation and storage are spread among globally distributed datacenters. Thus, to leverage the full computation power of the clouds, global data processing across multiple sites has to be fully enabled. However, managing data across geographically distributed datacenters is not trivial as it involves high and variable latencies among sites which come at a high monetary cost. In this work, we propose a uniform data management system for scientific applications running across geographically distributed sites. Our solution is environment-aware, as it monitors and models the global cloud infrastructure, and offers predictable data handling performance for transfer cost and time. In terms of efficiency, it provides the applications with the possibility to set a tradeoff between money and time and optimizes the transfer strategy accordingly. The system was validated on Microsoft’s Azure cloud across the 6 EU and US datacenters. The experiments were conducted on hundreds of nodes using both synthetic benchmarks and the real life A-Brain application. The results show that our system is able to model and predict well the cloud performance and to leverage this into efficient data dissemination. Our approach reduces the monetary costs and transfer time by up to 3 times.
I. INTRODUCTION
An increasing number of scientific applications are currently being ported on clouds to leverage the inherent elasticity and scalability of these emerging infrastructures. Ranging from large scale HPC experiments (e.g. for climate modeling and high-energy physics) to applications capturing data from wireless sensors networks and peforming really-time stream processing, they all share a common feature: they produce and handle extremely large datasets, in the order of Petabytes. To enable this Big Data processing, cloud providers have set up
multiple datacenters at different geographical locations. The goal is to provide redundancy and to ensure reliability in case of site failures, as well as to optimally serve the needs of users around the world by exploting locality. In this context, sharing, disseminating and analyzing the data sets results in frequent large-scale data movements across widely distributed sites. The targeted applications are compute intensive, for which moving the processing close to data is rather expensive (e.g. genome mapping, high-energy physics simulations), or simply needing large-scale end-to-end data movements (e.g. organizations
operating several data centers and running regular backup and replication services between sites, applications collecting data from remote sensors, satellites etc.). In all cases, the cost savings (mainly computation-related) should offset the significant inter-site distance (network costs etc). However, the existing cloud data management services typically lack mechanisms for dynamically coordinating transfers among different datacenters in order to achieve reasonable QoS levels and optimize the cost-performance. Being able to effectively use the underlying storage and network resources has thus become critical for wide-area data movements as well as for federated cloud settings.
One approach explores the idea of leveraging the current cloud data services as intermediate storage for transfers be-tween several endpoints. However, in today’s cloud architec-tures, this approach is not natural: computational nodes are separate from storage nodes and communication between the two exhibits a prohibitively high latency. Moreover, these ser-vices are typically object-based and not POSIX-compliant; if one needs to support standard file semantics, additional wrap-pers are required to make the necessary translations. Existing tools for file transfers [2], [3] have difficulties in adapting to many files movements with potentially large aggregate sizes. They also fail to achieve optimal throughput because of a (now widely observed!) high performance variability [4] for cloud operations, as well as network or endsystems bottlenecks. An alternative would be to minimize data transfers by scheduling computation close to data rather than the other way around, as in the Hadoop [5] MapReduce processing framework, where the same nodes serve for storage and computation. This may often be impractical for compute intensive applications and it is still not a solution when data must be moved for a variety of other reasons (e.g. replication, aggregation, etc.).
To tackle these problems we introduce a cloud-based data transfer system that supports large-scale data dissemination across geographically distributed sites. This system automat-ically builds and adapts performance models for the cloud infrastructure, in order to efficiently schedule and optimize data transfer tasks, and to effectively utilize the underlying resources. It is enhanced with data management capabilities such as: adaptive replication for faster data dissemination and
automatic optimization based on cost-performance constraints. The key idea of our solution is to accurately and robustly predict I/O and transfer performance in a dynamic cloud environment in order to judiciously decide how to perform transfer optimizations over federated datacenters. Estimates are dynamically updated to reflect changing workloads, vary-ing network-device conditions and configurations due to multi-tenancy. Based on this monitoring we automatically estimate the performance models for cloud resources. They are further leveraged to predict the best combination of protocol and transfer parameters (e.g. flow count, multicast enhancement, replication degree) in order to maximize throughput or mini-mize costs, according to application requirements. To validate our approach, we have implemented the above system as part of the Azure Cloud [6] so that applications could use it using a Software as a Service approach.
Our contributions can be summarized as follows:
• An architecture and implementation for a monitoring
ser-vice tracking real-time information on the inter-datacenter network connections status (Section III);
• A continuously-updated transfer performance model
leveraging the monitoring data to perform robust cost-performance analysis (Section IV-A);
• A decision engine that uses this model to optimize data
transfers when conditions change (Sections IV-B and IV-C);
• A fully-automated software system that integrates these
components to manage geographically-distributed data for scientific applications (Section V);
• An extensive evaluation with synthetic benchmarks and
a real-life application from bioinformatics (Section VI). II. THEGEOGRAPHICALLYDISTRIBUTEDDATA
MANAGEMENTECOSYSTEM
The handiest option for handling data distributed across several data centers is to rely on the existing cloud storage
ser-vices. This approach allows to transfer data between arbitrary endpoints via the cloud storage and it is adopted by several systems in order to manage data movements over wide-area networks [7], [8]. There is a rich storage ecosystem around public clouds. Cloud providers typically offer their own object storage solutions (e.g. Amazon S3 [9], Azure Blobs [10]), which are quite heterogeneous, with neither a clearly defined set of capabilities nor any single architecture. They offer binary large objects (BLOBs) storage with different interfaces (such as key-value stores, queues or flat linear address spaces) and persistence guarantees, usually alongside with traditional remote access protocols or virtual or physical server hosting. They are optimized for high-availability, under the assumption that data is frequently read and only seldom updated. Most of these services focus on data storage primarily and support other functionalities essentially as a ”side effect” Typically, they are not concerned by achieving high throughput, nor by potential optimizations, let alone offer the ability to support different data services (e.g. geographically distributed
trans-fers, hints for efficient blob placement etc.). Our work aims is to specifically address these issues.
A number of alternative solutions emerged in the context of the GridFTP [2] transfer tool, initially developed for grids and then adapted to clouds. Among these, the work most comparable to ours is Globus Online [3], which provides high performance file transfers through intuitive web 2.0 interfaces, with support for automatic fault recovery. However, Globus Online only performs transfers between GridFTP instances, remains unaware of the environment and therefore its transfer optimizations are mostly done statically. Several extensions brought to GridFTP allow users to enhance transfer perfor-mance by tuning some key parameters: threading in [11] or overlays in [12]. Still, these works only focus on optimizing some specific constraints and ignore others (e.g. TCP buffer size, number of outbound requests). This leaves the burden of applying the most appropriate settings effectively to scientists, which are typically unexperienced users.
Other approaches aim at improving the throughput by exploiting the network and the end-system parallelism or a hybrid approach between them. Building on the nework
par-allelism, the transfer performance can be enhanced by routing data via intermediate nodes chosen to increase aggregate band-width. Multi-hop path splitting solutions [12] replace a direct TCP connection between the source and destination by a multi-hop chain through some intermediate nodes. Multi-pathing [13] employs multiple independent routes to simultaneously transfer disjoint chunks of a file to its destination. These solutions come at some costs: under heavy load, per-packet latency may increase due to timeouts while more memory is needed for the receive buffers. On the other hand,
end-system parallelismcan be exploited to improve utilization of a single path. This can be achieved by means of parallel streams [14] or concurrent transfers [15]. Although using parallelism may improve throughput in certain cases, one should also consider system configuration since specific local constraints (e.g., low disk I/O speeds or over-tasked CPUs) may introduce bottlenecks. More recently, a hybrid approach was proposed [16] to alleviate from these. It provides the best parameter combination (i.e. parallel stream, disk, and CPU numbers) to achieve the highest end-to-end throughput between two end-systems. One issue with all these techniques is that they cannot be ported to the clouds, since they strongly rely on the underlying network topology, unknown at the user-level.
Finally, one simple alternative for data management involves
dedicated tools run on the end-systems. Rsync, scp, ftp are used to move data between a client and a remote location. However, they are not optimized for large numbers of trans-fers and require some networking knowledge for configuring, operating and updating them. BitTorrent based solutions are good at distributing a relatively stable set of large files but do not address scientists’ need for many frequently updated files, nor they provide predictable performance.
III. SYSTEM OVERVIEW
In this section we describe the founding principles of our system and provide an overview of its architecture.
A. Design principles
To enable efficient geographically distributed data transfers, we rely on the following ideas:
• Environment awareness. Cloud infrastructures are
ex-ploited using a multi-tenancy model, which leads to vari-ations in the delivered performance of the nodes and the communication links. Monitoring and detecting in real-time such changes is a critical requirement for scientific applications which need predictable performance. The monitoring information can then be fed into higher-level management tools for advanced provisioning and transfer purposes over wide-area networks. This helps removing the performance bottlenecks one-by-one and increases the end-to-end data transfer throughput.
• Modeling the cloud performance. The complexity of the
datacenters architecture, topology and network infrastruc-ture make simplistic approaches for dealing with transfer performance (e.g. exploiting system parallelism) less ap-pealing. In a virtualized environment such techniques are at odds with the goal of reducing costs through efficient resource utilization. Accurate performance models are then needed, leveraging the online observations of the cloud behavior. Our goal is to monitor the virtualized infrastructure and the underlying networks and to predict performance metrics (e.g. transfer time, costs). As such, we argue for a model that provides enough accuracy for automating the distributed data management tasks.
• Cost effectiveness. As expected, the cost closely follows
performance. Different transfer plans of the same data may result in significantly different costs. In this paper we ask the question: given the clouds interconnect offerings,
how can an application use them in a way that strikes the right balance between cost and performance?
• No modification of the cloud middleware and loose
coupling. Data processing in public clouds is done at user level, which restricts the permissions to the virtualized space. Our solution is suitable for both public and private clouds, as no additional privileges are required. Moreover, stand alone components of the data management system increase the fault tolerance and allow an easy deployment across geographically distributed datacenters.
B. Architecture
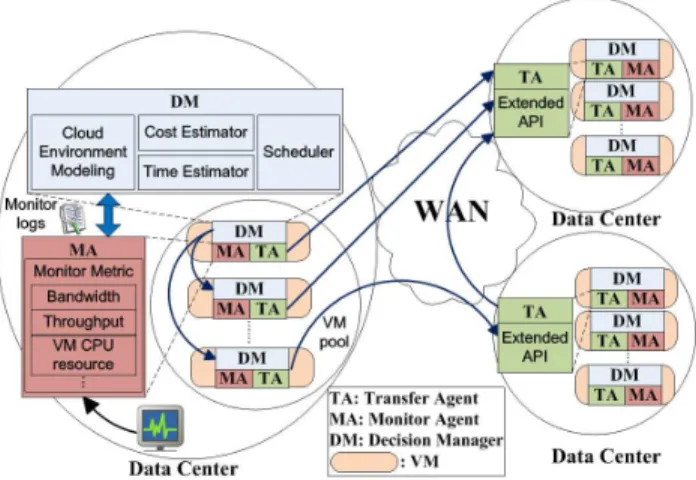
The proposed system relies on three components, called agents, that provide the following services: monitoring, data transfers and decision management. These modules (depicted in Figure 1) are replicated within the Virtual Machines (VMs) of the datacenters where the applications are running. The system is self-configurable: the discovery of its other peers is done automatically using the user credentials to query the cloud middleware. The scientific applications simply interact
Fig. 1. Architectural overview of the geographical distributed data manage-ment system (GEO-DMS).
with the data management service using its extended API, in order to perform wide-area data transfers.
The Monitoring Agent (MA) has the role of monitoring the cloud environment and reporting the measurements to a decision manager. Using the tracked data, a real-time online map of the cloud network and resource status is continuously constructed and made available to applications. The metrics considered are: available bandwidth, throughput, CPU load, I/O speed and memory status. New metrics can be easily defined and integrated using a pluggable monitoring modules approach. This component further records the monitoring history. Such a feature is important from two perspectives: on one hand, the tracked logs are used by the scientists to better understand and profile their cloud based applications, and on the other hand, this provides the base functionality for a self-healing system.
The Transfer Agent (TA) performs the data transfers and exposes a set of functions used to exploit the network par-allelism (e.g. direct send, forward sending, read, split etc.). These functions are used internally by the decision manager to coordinate data movements, but are also made available to users that might want to integrate the data management into the application logic. Additional transfer optimizations include: data fragmentation and recomposition using chunks of variable sizes, hashing, acknowledgement for avoiding data loss and duplications. One might consider the latter confir-mation mechanism redundant at application level, as similar functionality is provided by the underlying TCP protocol. We argue that this can be used to efficiently handle and recover from possible cloud nodes failures, when intermediate nodes are used for transfers. Finally, the component also monitors the ongoing transfers and provides real-time information about the achieved throughput and the progress to completion.
The Decision Manager (DM)coordinates the transfer from the source(s) to the destination(s), either through direct paths or using multiple intermediate datacenters. The transfer is done by replicating data across the nodes from a deployment in a datacenter in order to increase the aggregated
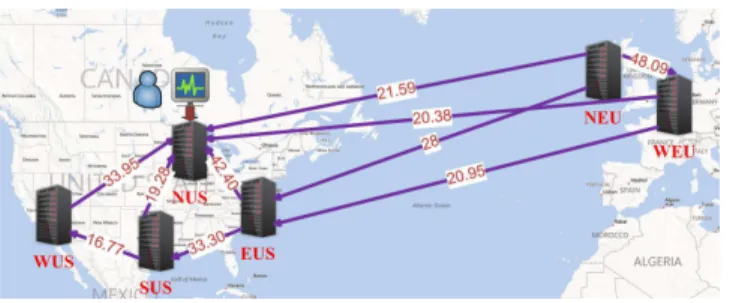
inter-Fig. 2. A snapshot of the average inter-datacenter throughput (in MB/s) map generated by the Monitoring Agent for the Azure cloud
datacenter throughput. This approach is based on the empirical observation that intra-site transfers are at least 10x faster than the wide-area transfers. Multiple parallel paths are then used for all chunks of data, leveraging the fact that the cloud routes packages through different switches, racks and network links. The applications initialize the data movements by specifying the transfer parameters (e.g. destination, completion time - cost tradeoff or absolute values) to the DM. Based on these parame-ters and on the cloud status, it chooses the appropriate number of resources to perform the transfers, so that they satisfy the efficiency constrains. By considering the global infrastructure of the application (i.e. the datacenters in which the application is deployed), the DM decides whether the transfer is done directly between the nodes from the source and destination datacenters, or using additional sites as intermediate hops. This selection is updated at specific intervals based on the cloud estimated performance, in order to reflect the inherent cloud variability. The DM sees the network of TAs similar to a global peer-to-peer network, which is used to coordinate data flows towards the destination. Although a DM exists on all nodes for availability reasons, each transfer is handled by a single entity, typically the one contacted by the application to initialize the transfer.
IV. ZOOM ON THE CLOUD AWARE DECISION MODEL
Multiple factors like multi-tenancy, wide-area-networks or the commodity hardware contribute to the variation of the performance in a cloud environment [4]. Figure 2 presents a snapshot of the inter-datacenter throughput in the Azure cloud, as tracked by the Monitoring Agent. There are two options for modeling such complex infrastructures in order to obtain an overview of the environment. Analytical models predict the performance of the underlying resources using low-level details about their internals alongside with workload characterizations. Although less expensive and faster than empirical models, they rely on simplified assumptions and require complex details for better modeling. Sampling methods perform active measurements of the targeted resources and do not require understanding the increasingly-complex, and often transparent, cloud internals. Our technique falls in the empirical, sample-based category. In this section we describe it and then show how to use it for predicting the transfers cost/completion-time efficiency.
A. Cloud data transfer model
The monitoring information used for performance estima-tions is collected in two phases: an initial learning phase, at deployment startup; and a continuous monitoring phase during the lifetime of the deployment. The measurements are done at configurable time intervals in order to keep the system non-intrusive.
We model and estimate the cloud performance (represented by any of the tracked metrics) based on the accumulated trace of the monitoring parameters about the environment (h -history gives the fixed number of previous samples that define the sliding time window). The cloud average performance (µ -Equation 1) and the coresponding variability (σ - -Equation 2) are estimated at each moment i. These estimations are updated based on the weights (w) given to each new measured sample.
µi=(h − 1) ∗ µi−1+ (1 − w) ∗ µi−1+ w ∗ S h (1) σi= q γ − µ2 i (2) γi=(h − 1) ∗ γi−1+ w ∗ γi−1+ (1 − w) ∗ S 2 h (3)
where S is the value of the sample to be integrated in the model and γ (Equation 3) is an internal parameter used for iteratively updating the variability (σ) as the system progresses. Equation 3 is obtained by rewriting the formula for the standard variability (i.e. σi =
q
1 N
PN
j=1(xj− µi)2),
in terms of the previous value at moment i−1 and the value of the current sample. This rewriting allows to save the memory that would have been needed to store the last N samples, if the formula would have been applied directly.
Our approach weights each sample individually. For in-stance, an outlier value in a stable environment is most probably a temporary glitch and should not be trusted. To select these weights, we consider the following observations:
• A high standard deviation will favor accepting new
sam-ples (even the ones farther from the average);
• A sample far from the average is a potential outlier and
it is weighted less;
• Less frequent samples are weighted higher (as they are
rare and thus more valuable).
These observations are captured in Equation 4, combining the Gaussian distribution with a time reference component:
w=e
−(µ−S)22σ2 + (1 −tf T)
2 (4)
where tf is the time frequency of the sample and T is user time reference interval. This normalizes the weights with values within the interval(0, 1): 0 - no trust and 1 - full trust.
B. Efficiency in the context of data management
Efficiency can have multiple declinations depending on application context and user requirements. In clouds, the most critical among these are the transfer time and the monetary cost. Our model estimates these metrics for transferring data between the source and destination sites, with respect to the transfer setting (used resources, geographical location etc.).
• The Transfer Time (T t) is estimated considering the
number of nodes (n) that are used in parallel to stream data and the predicted transfer throughput (thrmodel),
obtained from monitoring the respective cloud link:
T t= Size thrmodel∗
1
1 + (n − 1) ∗ gain (5)
where gain is the time reduction due to parallel transfers (determined empirically, with values less than 1).
• The Cost of a geographical transfer is split into 3
components. The first corresponds to the cost charged by the cloud provider for outbound data (outboundCost), as
usually inbound data is free. The other two components are derived from the cost of the VMs (n - number of VMs) that are leased: the network bandwidth (V M CBand)
and the CPU (V M CCP U) costs. The ratio of the VM
re-sources used for the transfer is given by the intrusiveness parameter (Intr). The final cost equation is:
Cost= n ∗ (T t ∗ V MCCP U∗ Intr+
Size n
T t ∗ Intr
V M CBand
) + outboundCost∗ Size (6)
where for simplicity we considered that each of the n nodes sends the same amount of data (Sizen ).
This model captures the correlation between performance (time) and cost (money) and is able to adjust the tradeoff between them dynamically during transfers. An example of such a tradeoff is setting a maximum cost for a data transfer, based on which our system is able to infer the amount of resources to use. Although the network or end-system performance can drop, the system rapidly detects the new reality and adapts to it in order to satisfy the budget constraint. The proposed model is rather simple, relying on a small set of parameters, easily collected by monitoring tools (e.g. sample history depends on the cloud variability) or set by users based on the application type (e.g. the CPU-intrusiveness tolerated by compute-intensive applications could be smaller: 5%, while I/O-intensive applications would tolerate a bigger one: 10%). These parameters are used to calibrate a general methodology based on component monitoring, application side feedback and behavior/pattern analysis to discover and characterize situations leading to fluctuations of data access throughput. Hence, this model is not tailored for specific configurations of resources/services, and can be transported from one applica-tion to another. This very simplicity allows the model to be more general, but at the expense of becoming less accurate for some precise, application dependent, settings. It was our design choice to trade accuracy for generality. Moreover,
using knowledge discovery techniques for calibrating these parameters reduces the possible impact of biased analysis manually performed by administrators.
C. Multi-datacenter paths transfer strategy
With applications being currently executed across several geographically distributed datacenters, an interesting option for propagating the data from the source to the destination is to use intermediate nodes from additional centers. This transfer approach relies on multiple hops and paths instead of using just the direct link between the source and destination sites. The idea was first explored in the context of grids, several solutions being proposed in conjunction with the GridFTP protocol [17], [12]. In these private infrastructures, information about the network bandwidth between nodes as well as the topology and the routing strategies are publicly available. Using this knowledge, transfer strategies can be designed for maximizing certain heuristics [12]; or the entire network of nodes across all sites can be viewed as a flow graph and the transfer scheduling can be solved using flow-based graph algorithms [17]. However, in the case of public clouds, information about the network topology is not available to the users. One option is to profile the performance. Even with this approach, in order to apply a flow algorithm the links between all nodes need to be continuously monitored. Worse, as the throughput of the link between datacenters depends nonlinearly on the number of nodes used (see Section VI-C), one would also need to evaluate the throughput obtained by a different number of nodes on a certain link. Such monitoring would incur a huge overhead and impact on the transfer.
Our approach for solving the multi-datacenter path selection problem in the clouds takes a different approach. We start by selecting the shortest path (i.e. the maximum throughput) between the source and the destination datacenters, which can be evaluated at low cost as the total number of datacenters is small (i.e. less than 10). Then, building on the elasticity principle of the cloud, we try to add nodes to the transfer path, within the datacenters that form this shortest path, in order to increase the cumulative throughput of the link. More nodes add more bandwidth, translating into an increased throughput. However, as more and more nodes are added along the same path, the additional throughput brought by them will become smaller (e.g. due to network interferences and bottlenecks). To address this issue, we consider also the next best path (computed in the Algorithm 1 at lines 7-8). Having these two paths, we can compare at any time the gain of adding the node to the current shortest path versus adding a new path (line 12 in Algorithm 1). Hence, nodes will be added to the shortest path until their gain becomes smaller than the gain of a new path, case in which, this new path will be added to the transfer network. This will result in a transfer topology that uses multiple paths along different datacenters. The tradeoff between the cost and performance is controlled by the user through the budget parameter from Algorithm 1. This specifies how much the users are willing to pay in order to achieve higher performance. The relationship between cost
Algorithm 1 The multi-datacenter path selection
1: procedure MULTIDATACENTERHOPSEND
2: N odes2U se = M odel.GetN odes(budget)
3: whileSendData < T otalData do
4: M onitorAgent.GetLinksEstimation();
5: P ath= ShortestP ath(inf rastructure)
6: whileU sedN odes < N odes2U se do
7: deployments.RemoveP ath(P ath)
8: N extP ath= ShortestP ath(deployments)
9: U sedN odes+ = P ath.N rOf N odes()
⊲ // Get the datacenter with minimal throughput
10: N ode2Add = P ath.GetM inT hr()
11: whileU sedN odes < N odes2U se &
12: N ode2Add.T hr >= N extP ath.N ormalizedT hr do
13: P ath.U pdateLink(N ode2Add)
14: N ode2Add = P ath.GetM inT hr()
15: end while
16: T ransf erSchema.AddP ath(P ath)
17: P ath= N extP ath
18: end while
19: end while
20: end procedure
and performance is discussed in Section VI-C3. The transfer system increases the number of intermediate nodes in order to reduce the transfer time as long as the budget allows. More precisely, the system selects the largest number of nodes which keeps the Cost from Equation 6 smaller than the budget (line 2 in Algorithm 1).
V. DESIGN ANDIMPLEMENTATION
A prototype was built to validate the concepts explained in Sections III and IV. The system was implemented in C# and currently runs on the Microsoft Azure cloud.
The Monitoring Agent (MA) is designed as an ensemble of autonomous multi-threaded, self-describing subsystems which are registered as dynamic services, and are able to collaborate and cooperate in performing a wide range of information gathering tasks. The pluggable modules used for collecting different sets of information, or interfacing with other monitor-ing tools, are dynamically loaded and executed in independent threads. In order to minimize intrusiveness on host systems, a dynamic pool of threads is created once, and the threads are then reused when a task assigned to a thread is completed. We have also set a customizable intrusiveness threshold, which limits the monitoring samples frequency when the VM is highly loaded. This option is used for example by the DM to suspend the throughput measurements during data trans-fers, as this information can be collected directly from the TA. Currently, the MA tracks several metrics: the available bandwidth between the nodes and between the datacenters using the iperf software [18]; the throughput, computed by measuring the transfer time of random transfers of data; the CPU performance, evaluated based on a small benchmark, that we have implemented, performing mathematic operations.
The Transfer Agent (TA)is in charge of the data movements using parallel TCP streams. The parallelization of the transfer is done at cloud node level: data is not directly sent from
the source to the destination node, but part of it is sent to intermediate nodes. These are then forwarding the data towards the destination, exploiting the multiple parallel paths
existing between datacenters. Data is sent as chunks extended with metadata information. Metadata is used for hashing and deduplication, for recomposing the data at destination, as packages can arrive in any order, and for routing the packages and acknowledgements. As future work, we consider adding support for other protocols (HTTP for content-based data or UDP for handling geographical streaming data). The data transfer functions can be accessed via an API or using a set of simple commands similar to the FTP ones. Hence, the Transfer Agents can be controlled both locally and from remote locations (e.g. from other nodes or datacenters).
The Decision Manager (DM)implements the modeling and the prediction components using the monitoring data. Based on them, the efficiency of the transfer is computed at the beginning at the transfer and then updated iteratively as the transfer progresses. The DM selects the paths to be used (direct or using multi datacenters) and coordinates the transfer (i.e. what nodes and resources to provision) based on the time/cost predictions in order to comply with the transfer constraints. For instance, it computes whether a benefit (economy) is brought by a set of resources if the transfer cost is within the limit, or if by using an increased number of nodes for parallel streaming of data the completion time can be significantly reduced. The Manager further communicates with the TAs to set the chunk size of the transfers via intermediate nodes in order to maximize the resource usage while preserving the non-intrusiveness constraints. Finally, it detects any resource performance drops and either replaces them or asks the cloud middleware to change them.
VI. EXPERIMENTALEVALUATION
This section presents the evaluation of our solution on the Azure cloud using synthetic benchmarks and a real life application from bio-informatics, called A-Brain.
A. Experimental setup
The experiments were carried out on the Azure cloud using datacenters from United States and Europe (North, South, East, West US and North, West EU). We used the Small (1 CPU, 1.75 GB Memory and 100 Mbps) and Medium (2 CPU, 3.5 GB Memory and 200 Mbps) VM instances with tens of such machines deployed in each data center, reaching a total of 120 nodes and 220 cores in the global system. To execute the A-Brain application, we used the Extra-Large (8 CPU, 14 GB and 800 Mbps) VM instances.
B. Assessing the cloud infrastructure variability
It is commonly known that clouds offer a variable perfor-mance, analyzed in several previous works [19], [20], [21], focusing on the intra-datacenter performance. When it comes to the global cloud infrastructure, the variability is expected to increase. We report here the performance evaluation for data transfers between the cloud datacenters. We examined
Fig. 3. The performance variation during a week between from a client in North Europe to the other European and US data centers. a) The TCP throughput between sites. b) The writing times to AzureBlobs
2 scenarios: assessing the throughput variability (Figure 3 a)) and the latencies for stageing data into the AzureBlobs storage service (Figure 3 b)). In both cases the measurements were done from the North EU towards the other 5 EU and US datacenters during one week, with hundreds of measurements each day.
Figure 3 a) shows the average throughput and the standard deviation achieved when transferring 100 MB of data using Small instances, while Figure 3 b) shows the average time and the standard derivation for sending 100 MB data to the Azure Blobs. Besides the relatively high value of the standard deviation, we notice that the measured values do not necessary follow a trend and the performance drops or bursts can appear at any time. This observation holds both for the neighboring datacenter as well as for the remote ones.
C. Synthetic benchmarks
The next series of experiments evaluate the accuracy of the sample-based cloud model, the intrusiveness of our approach and its efficiency in terms of costs and performance.
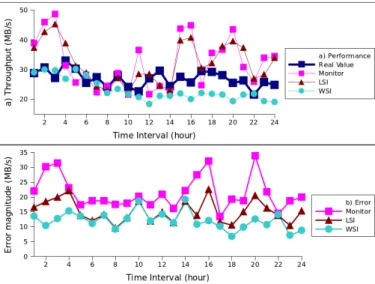
1) Evaluating the performance prediction.Figure 4 presents the accuracy of the estimations done using the monitoring based model, for a 24 hour interval. The figure shows the hourly averages (60 values per hour). The critical aspect about the model’s accuracy is how the new samples are integrated within the model. We have compared our solution, based on a weighted integration (WSI), with 2 other sample integration strategies. The first one (Monitor) considers that the last sample describes the current reality and uses it as expected performance; due to its simplicity and low cost it is mostly used in the current systems. However, in our case it gives the worst results as it is subject to the performance variations. The second strategy considers a linear integration of the samples (LSI), computing the future performance as an average between the history and the new sample.
Fig. 4. a) The approximation of the TCP throughput using multiple strategies (Monitor and Update, Linear Sampling Integration and Weighted Sampling Integration). b)The average aggregated error in approximating the TCP Throughput depending on the strategies.
Figure 4 a) shows how the real value of the throughput between North US and North EU is approximated using the 3 strategies for sample integration. Our weighted approach has a smoother approximation and is not that sensitive to temporary variations as the other two. In Figure 4 b) we report the difference (i.e. accuracy error) between the estimated value and the real value. With an unstable tracked throughput (e.g. interval 1 to 5 or 18 to 24), weighting the samples seems to be a better option than using fixed integration strategies (LSI). When the performance variations are less important, both the linear and the weighted strategies give similar results. This is explained by the fact that in a stable environment the weights assigned to the samples converge towards 1, just like in the case of the linear average. These relative errors (10-15%) of the model can be easily tolerated as they result in slightly moving the throughput performance around the optimum value.
2) Evaluating the intrusiveness.We now analyze the impact of higher resource utilization due to our management system on the wide-area transfers. We measure the transfer time of 1 GB of data between the North EU and US datacenters. The number of nodes that are used for the transfer is varied from 1 to 5. For each node, we also vary the intrusiveness parameter, which gives the percentage of the VM’s resources (CPU, Memory and bandwidth) to be used by our system.
The highest values within each segment in Figure 5 corre-spond to the situation when only 1 node is used for the transfer. The lower values within each segment are obtained using multiple nodes, leading to different transfer time reductions de-pending on the intrusiveness level and the cloud performance. Adding more resources does not reduce the transfer time with the same percentage because: 1) the network bandwidth is bound, 2) sending data from the source to the intermediate nodes incurs an overhead and 3) the VM performance varies.
Fig. 5. The impact of the intrusiveness on the transfer time of 1 GB of data between NUS and NEU, when varying the number of VMs used (1 to 5 within each segment)
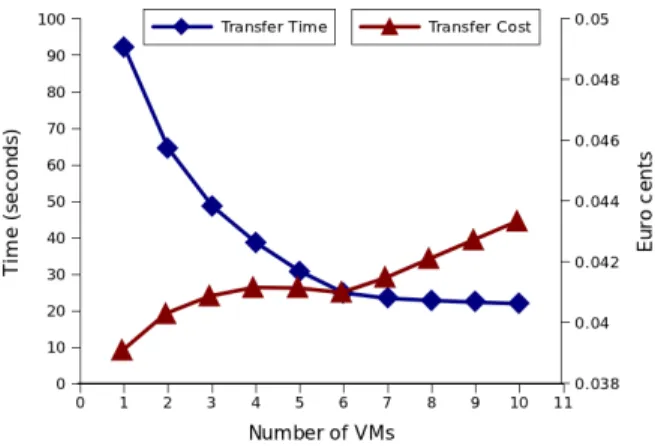
Fig. 6. The tradeoff between transfer time and cost for multiple VM usage. The values correspond to 1 GB transferred between North EU and North US
This observation supports our choice for a fine control of the amount of resources used by the data management system.
3) Evaluating the transfer efficiency. Our next experiments evaluate the relationship between the transfer efficiency and the monetary cost. We focus on using intermediate nodes to speed up parallel transfers. These nodes come at a cost, either by leasing or taking them from the main computation. Depending on how urgent the transfer is, a different number of nodes can be considered acceptable. In fact, up to a certain point, the time reduction obtained by using more nodes prevents the transfer cost to grow significantly, as observed in Figure 6 when using 3 up to 5 VMs. This happens because the cost depends on the time the nodes are used for the transfer, thus smaller transfer times reflect on smaller costs. Looking at the cost/time ratio, an optimal point is found with 6 VMs for this case (the maximum time reduction for a minimum cost). However, as different applications can value costs differently, leveraging the possibility of setting their customized cost/time tradeoff seems useful.
4) Evaluating the environment-aware wide-area transfers.
The following experiment illustrates how the transfer effi-ciency is improved using knowledge about the environment. We consider sending increasing data sizes from a source node to a destination. As we do the transfer in parallel, our solution uses intermediate nodes from the same datacenter as
Fig. 7. Our approach (GEO-DMS) vs. simple parallel transfers. The result show the average and the 95% confidence intervals for the transfer time
the source node. During the transfer, the performance (CPU or bandwidth) of the used nodes can drop. Aware of these changes, the Decision Manager adapts to them by relying less on the problematic nodes (i.e. sending less data through those links) or by choosing some alternate nodes. We compared this environment-aware approach (GEO-DMS) with simply performing the transfer in parallel, without considering the environment. The same number of nodes were used to send in-creasing amounts of data between two close (South and North US) and two farther (North EU and North US) datancers. The results in Figure 7 show that as the size of data and the distance between datacenter increases, the environment-aware approach reduces the transfer times. This is explained by the fact that the transfers take longer and cloud performance changes can thus occur. Considering also the 95% confidence intervals, we can observe that we improve the transfers of up to 20% for large datasets over simple parallel transfers strategies.
5) Comparing the performance with the existing solutions.
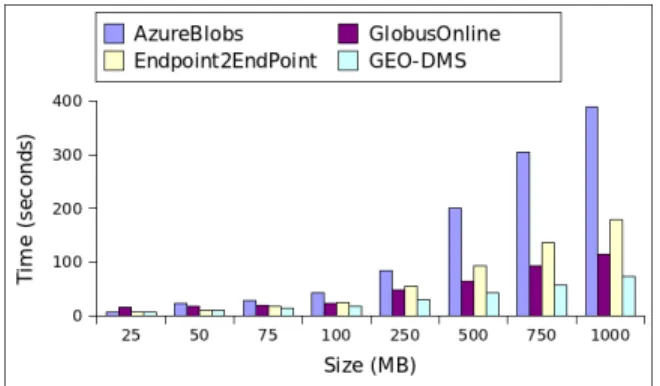
We compared our system with the Globus Online tool (using a GridFTP backend server), with AzureBlobs (as an intermediate storage for sending data between endpoints) and with direct transfers (Figure 8). AzureBlobs is the slowest option as the transfer has a writing phase with data being written by the source node to the storage, followed by a read phase in which the data is read by the destination. These steps incur significant latencies due to the geographical remote location (of the source or destination) and the HTTP-based access interfaces. Despite these, AzureBlobs-based transfers are currently the only cloud offering for wide-area data movements. Globus Online is a good alternative but it lacks the cloud-awareness. Our solution reduces the overall transfer time with a factor of 5 over the default cloud offering and with up to 50% over other transfer options that can be adapted for the cloud. Budget-wise, these approaches do not incur the same costs. AzureBlobs adds extra cost for using the persistent storage. EndPoint2EndPoint corresponds to using one node, the cost/performance trade-off was analyzed in Section VI-C3. When comparing with GlobusOnline, the same setup was used meaning that higher performances corresponds to lower costs.
Fig. 8. Transfer time when the data size is varied for our approach (GEO-DMS) and other existing options.
Fig. 9. The throughput between NEU and NUS datacenters for different multi-datacenter path transfer strategies. The throughput is evaluated: a) in time, while the overall number of nodes across datacenters is fixed to 25 ; b) based on multiple nodes, while the time frame is kept fixed to 10 minutes
So far the evaluation focused on sending data between the nodes in the source datacenter and the destination dat-acenter. We now consider the scenario in which the nodes from additional datacenters can be used as intermediate hops to transfer the data. For this experiment we considered an application deployed across all the 6 US and EU sites. Figure 9 presents the evaluation of the proposed approach, described in Algorithm 1, for multi-datacenter path transfer, compared with 3 other transfer strategies. The first one considers direct transfers between the nodes of the source datacenter and the destination (i.e. DirectLink). As the direct link between source and destination might not be in fact the shortest, the other strategies consider the shortest path (i.e. Dijkstra’s algorithm). The selection of the shortest path can be done once, at the beginning of the transfer (i.e. ShortestPath static) or each time the monitoring systems provides a fresh view of the environment (i.e. ShortestPath dynamic). The static strategy shows the throughput obtained when the monitoring system is not used. For all strategies, the same number of nodes was used to perform the transfer.
In Figure 9 a) we present the cumulated throughput achieved when 25 nodes are used to perform data transfers between the NEU and NUS datacenters. We notice that the performance of the shortest paths strategy and the one that we propose
Fig. 10. Execution times of the A-Brain application across 3 datacenters, using AzureBlobs and GEO-DMS as a transfer backend. The bar indicate the total time of transferring the files towards the Meta-Reducer located in NUS
are sometimes similar. This happens because our algorithm extends the shortest path algorithm with mechanisms for selecting alternatives paths when the gain brought by a node along the initial path becomes too small due to congestions. The performance gain increases with time, reaching 20% for the 10 minute window considered. Alternatively, selecting the route only once and not being environment aware decreases the performance in time, becoming inefficient for large transfers. In Figure 9 b) we analyze the throughput variation when using an increasing number of nodes. We observe that for a small number of nodes, the differences between the strategies are very small. However, as more nodes are used for the transfer, distributed across different geographical sites, our algorithm is capable to better orchestrate their placement and achieve higher throughput.
D. Experimenting with a real-life neuroimaging application
We present an evaluation of the time gains that can be obtained for wide-area transfers in the context of a scientific application from bio-informatics, A-Brain, which joins genetic and neuro-imaging data analysis. Due to the large resource re-quirements, that could not be obtained from the cloud provider within a single datacenter, the application runs a MapReduce-based processing across 3 datacenters; the final global result is computed using a Meta-Reducer [22] that aggregates results from all the datacenters. We compare the transfer times of 1000 files representing partial data, sent from each datacenter towards the Meta-Reducer, using AzureBlobs as a transfer backend and our solution (GEO-DMS). The results are shown in Figure 10 for multiple file sizes, resulted from different input data sets and configurations. For small datasets (108 MB from 3x1000x36KB files), the overhead introduced by our solution, due to the extra acknowledgements, makes the transfer inefficient. However, as the data size grows (120 GB), the total transfer time is reduced by a factor of 3.
VII. CONCLUSION
This paper introduces a cloud-based data management system for Big-Data science applications running in large,
federated and highly dynamic environments. Our solution is able to effectively use the high-speed networks connecting the cloud datacenters through optimized protocol tuning and bottleneck avoidance, while remaining non-intrusive and easy to deploy. At its core, it uses a sampling-based model for cost-performance in a cloud setting to enable efficient trans-fer operations across a group of geographically distributed datacenters. As an example, by distributing data locally, it enables high wide-area data throughput when the network core is underutilized, at minimal cost. Our experiments show that the system achieves high performance in a variety of settings: it substantially improves throughput and reduces the execution time for real applications by up to 3 times compared to state-of-the-art solutions.
Encouraged by these results, we have started to explore other data-management research issues, from a cloud providers perspective. Apart from the practical applications shown in this paper, our approach can be used to study the performance of inter-datacenter or inter-cloud transfers. This is especially use-ful for cloud users, to provide them with an enhanced visibility into the actually-supported service levels. We believe that cloud providers could leverage this tool as a metric to describe the performance of resources with particular configurations. As a further evolution, they could provide Introspection-as-a-Service to reveal information about the cost of internal cloud operations to relevant applications.
ACKNOWLEDGMENT
This work was supported by the joint INRIA - Microsoft Research Center. The experiments presented in this paper were carried out using the Azure Cloud infrastructure provided by Microsoft in the framework of the ZCloudFlow project. The authors would like to thank the Azure support teams from ATL Europe for their valuable input and feedback.
REFERENCES
[1] Y. Chen and R. Sion, “To cloud or not to cloud?: Musings on costs and viability,” in Proceedings of the 2Nd ACM Symposium on Cloud
Computing, ser. SOCC ’11. New York, NY, USA: ACM, 2011, pp. 29:1–29:7. [Online]. Available: http://doi.acm.org/10.1145/2038916. 2038945
[2] W. Allcock, “GridFTP: Protocol Extensions to FTP for the Grid.” Global
Grid ForumGFD-RP, 20, 2003.
[3] W. Allcock, J. Bresnahan, R. Kettimuthu, M. Link, C. Dumitrescu, I. Raicu, and I. Foster, “The globus striped gridftp framework and server,” in Proceedings of the 2005 ACM/IEEE conference on
Supercom-puting, ser. SC ’05. Washington, DC, USA: IEEE Computer Society, 2005, pp. 54–.
[4] I. Foster, A. Chervenak, D. Gunter, K. Keahey, R. Madduri, and R. Kettimuthu, “Enabling PETASCALE Data Movement and Analysis,” Scidac Review, Winter 2009. [Online]. Available: http: //www.scidacreview.org/0905/pdf/cedps.pdf
[5] “Hadoop,” http://hadoop.apache.org/.
[6] “Azure,” http://www.windowsazure.com/en-us/.
[7] T. Kosar and M. Livny, “A framework for reliable and efficient data placement in distributed computing systems.” Journal of Parallel and
Distributed Computing 65, 10, p. 11461157, Oct. 2005.
[8] P. Rizk, C. Kiddle, and R. Simmonds, “Catch: a cloud-based adaptive data-transfer service for hpc.” in Proceedings of the 25th IEEE
Interna-tional Parallel & Distributed Processing Symposium, 2011, p. 12421253. [9] “Amazon S3,” http://aws.amazon.com/s3/.
[10] B. Calder and et al, “Windows azure storage: a highly available cloud storage service with strong consistency,” in Proceedings of the 23rd
ACM Symposium on Operating Systems Principles, 2011.
[11] W. Liu, B. Tieman, R. Kettimuthu, and I. Foster, “A data transfer framework for large-scale science experiments,” in Proceedings of the
19th ACM International Symposium on High Performance Distributed Computing, ser. HPDC ’10. New York, NY, USA: ACM, 2010, pp. 717–724.
[12] G. Khanna, U. Catalyurek, T. Kurc, R. Kettimuthu, P. Sadayappan, I. Foster, and J. Saltz, “Using overlays for efficient data transfer over shared wide-area networks,” in Proceedings of the 2008 ACM/IEEE
conference on Supercomputing, ser. SC ’08. Piscataway, NJ, USA: IEEE Press, 2008, pp. 47:1–47:12.
[13] C. Raiciu, C. Pluntke, S. Barre, A. Greenhalgh, D. Wischik, and M. Han-dley, “Data center networking with multipath tcp,” in Proceedings of the
9th ACM SIGCOMM Workshop on Hot Topics in Networks, ser. Hotnets-IX. New York, NY, USA: ACM, 2010, pp. 10:1–10:6.
[14] T. J. Hacker, B. D. Noble, and B. D. Athey, “Adaptive data block scheduling for parallel tcp streams,” in Proceedings of the High
Per-formance Distributed Computing, 2005. HPDC-14. Proceedings. 14th IEEE International Symposium, ser. HPDC ’05. Washington, DC, USA: IEEE Computer Society, 2005, pp. 265–275.
[15] W. Liu, B. Tieman, R. Kettimuthu, and I. Foster, “A data transfer framework for large-scale science experiments,” in Proceedings of the
19th ACM International Symposium on High Performance Distributed Computing, ser. HPDC ’10. New York, NY, USA: ACM, 2010, pp. 717–724.
[16] E. Yildirim and T. Kosar, “Network-aware end-to-end data throughput optimization,” in Proceedings of the first international workshop on
Network-aware data management, ser. NDM ’11. New York, NY, USA: ACM, 2011, pp. 21–30.
[17] G. Khanna, U. Catalyurek, T. Kurc, R. Kettimuthu, P. Sadayappan, and J. Saltz, “A dynamic scheduling approach for coordinated wide-area data transfers using gridftp,” in Parallel and Distributed Processing, 2008.
IPDPS 2008. IEEE International Symposium on, 2008, pp. 1–12. [18] “Iperf,” http://iperf.fr/.
[19] R. Tudoran, A. Costan, G. Antoniu, and L. Boug´e, “A Performance Evaluation of Azure and Nimbus Clouds for Scientific Applications,” in CloudCP 2012 – 2nd International Workshop on Cloud Computing
Platforms, Held in conjunction with the ACM SIGOPS Eurosys 12 conference, Bern, Switzerland, 2012.
[20] H. J. Li, M. Mao, A. Ruiz-Alvarez, and M. Humphrey, “Early Obser-vations on the Performance of Windows Azure,” in High Performance
Distributed Computing, Bern, Switzerland, 2010, pp. 367–376. [21] G. Juve, E. Deelman, K. Vahi, G. Mehta, B. Berriman, B. P. Berman, and
P. Maechling, “Data sharing options for scientific workflows on amazon ec2,” in Proceedings of the 2010 ACM/IEEE International Conference
for High Performance Computing, Networking, Storage and Analysis, ser. SC ’10. Washington, DC, USA: IEEE Computer Society, 2010, pp. 1–9.
[22] A. Costan, R. Tudoran, G. Antoniu, and G. Brasche, “TomusBlobs: Scalable Data-intensive Processing on Azure Clouds,” Journal of