Assessment of the Effect of Micro-Simulation Error on Key Travel Indices: Evidence from the Activity-Based Model FEATHERS
Texte intégral
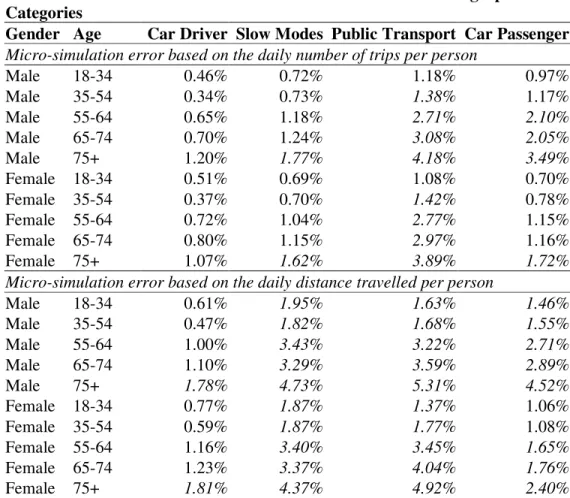
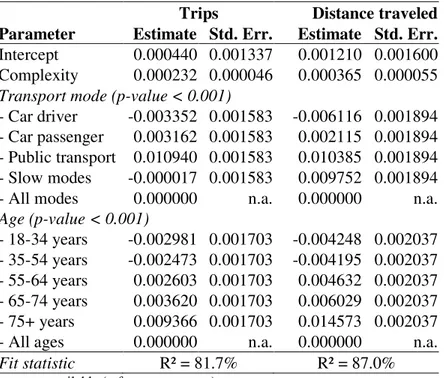
Figure

Documents relatifs
1.3 Organization of the Dissertation 5 • Classification and cost analysis of existing Id/Loc split schemes: We develop analytical model for protocols modeling and analysis.. We
Slight changes to a repeated unit cell can be used to tune the effective bulk material properties of a metamaterial, replacing the need to discover suitable
On MY18, the cooling system used a diaphragm water pump, which although heavy, reliably provided adequate flowrate for the given pressure drop.. For MY19, the
The presence of true feathers is less equivocal in some other theropods: the recently described Pedo- penna, from China ( Xu & Zhang 2005 ), shows long pennaceous feathers of
The usefulness of augmented reality was evaluated in each case through four Boolean parameters: Whether the virtual images had an impact on the size and shape of the craniotomy;
Die Gastroenteritis ist eine häufige Er- krankung und betrifft alle Altersgrup- pen über das ganze Jahr; eine individuel- le saisonale und altersspezifische Häufung kann jedoch
À partir de la rela- tion estimée, on peut ensuite simuler la durée de chômage, donc le taux de sortie moyen à douze mois, auquel on pourrait s’attendre pour les demandeurs
Second, recycling may mitigate the extractor’s market power if it increases the available stock of rare earths and therefore reduces the vulnerability of industries to
