DYNAMIQUE DES POPULATIONS DE CARIBOUS MIGRATEURS (RANGIFER
TARANDUS) BASEE SUR DES INDICES DE CONDITION CORPORELLE
par
Melanie Dawn Pachkowski
memoire presente au Departement de biologie en vue de I'obtention du grade de maitre es sciences (M.Sc.)
FACULTE DES SCIENCES UNIVERSITE DE SHERBROOKE
Library and Archives Canada Published Heritage Branch Bibliotheque et Archives Canada Direction du Patrimoine de I'edition 395 Wellington Street Ottawa ON K1A0N4 Canada 395, rue Wellington Ottawa ON K1A 0N4 Canada
Your file Votre reference ISBN: 978-0-494-91031-3 Our file Notre reference ISBN: 978-0-494-91031-3
NOTICE:
The author has granted a
non-exclusive license allowing Library and Archives Canada to reproduce, publish, archive, preserve, conserve, communicate to the public by
telecommunication or on the Internet, loan, distrbute and sell theses
worldwide, for commercial or non-commercial purposes, in microform, paper, electronic and/or any other formats.
AVIS:
L'auteur a accorde une licence non exclusive permettant a la Bibliotheque et Archives Canada de reproduire, publier, archiver, sauvegarder, conserver, transmettre au public par telecommunication ou par I'lnternet, preter, distribuer et vendre des theses partout dans le monde, a des fins commerciales ou autres, sur support microforme, papier, electronique et/ou autres formats.
The author retains copyright ownership and moral rights in this thesis. Neither the thesis nor substantial extracts from it may be printed or otherwise reproduced without the author's permission.
L'auteur conserve la propriete du droit d'auteur et des droits moraux qui protege cette these. Ni la these ni des extraits substantiels de celle-ci ne doivent etre imprimes ou autrement
reproduits sans son autorisation.
In compliance with the Canadian Privacy Act some supporting forms may have been removed from this thesis.
While these forms may be included in the document page count, their removal does not represent any loss of content from the thesis.
Conformement a la loi canadienne sur la protection de la vie privee, quelques
formulaires secondaires ont ete enleves de cette these.
Bien que ces formulaires aient inclus dans la pagination, il n'y aura aucun contenu manquant.
Le Mseptembre 2012
le jury a accepte le memoire de Madame Melanie Pachkowski dans sa version finale.
Membres du jury
Professeur Marco Festa-Bianchet Directeur de recherche Departement de biologie
Monsieur Steeve Cote Codirecteur de recherche
Universite Laval
Professeure Sophie Calme Membre
Departement de biologie
Professeure Fanie Pelletier Presidente rapporteur Departement de biologie
SOMMAIRE
Le suivi et la comprehension de la dynamique des populations sont essentiels pour la gestion et la conservation de la faune. Une taille de population ou une densite elevee peut affecter negativement les parametres demographiques comme la reproduction, le recrutement et la survie. Chez les grands mammiferes, ces parametres sont intimement lies a la taille des individus et a leur condition corporelle. Le caribou migrateur (Rangifer tarandus) est une espece cle dans la toundra. Les populations peuvent fluctuer considerablement et rapidement, rendant leur suivi et leur gestion difficiles. Les indicateurs ecologiques indirects, qui sont des indices dependants de la densite bases sur des caracteristiques physiques individuelles ou de performance, ont ete proposes comme une alternative aux estimes de population pour gerer les populations d'ongules. Des donnees morphologiques mesurees sur des nouveaux-nes, des individus ages de 1 an et des femelles adultes pour quatre troupeaux de caribous migrateurs (Riviere-George, Riviere-aux-Feuilles, Beverly et Porcupine) ont ete compilees. La relation entre la condition corporelle et la dynamique des populations au niveau individuel a ete etudiee en regardant comment la taille individuelle, la condition corporelle et la taille de la population influencent la gestation des femelles adultes dans le troupeau de la Riviere-George. Au niveau de la population, l'efficacite des indices de condition corporelle pour estimer les tendances demographiques pour les quatre troupeaux a ete evaluee.
La condition corporelle des femelles adultes etait positivement liee a leur probability de gestation. La taille de la population influen9ait negativement le taux de gestation, mais les femelles n'ont pas adopte une strategie conservatrice de reproduction. En effet, la masse minimale des femelles adultes requise pour la reproduction ne variait pas avec la taille de la population. Au niveau populationnel, il y avait des effets dependants de la densite negatifs sur les traits morphologiques pour trois des quatre troupeaux. Cependant, les traits morphologiques n'etaient pas toujours correles avec la taille de la population et ils n'etaient pas de bons parametres pour predire les changements dans la taille des populations. II a souvent ete montre que les effets dependants de la densite sur les traits physiques sont plus forts, voire meme limites, aux periodes de croissance demographique. Les traits physiques des
jeunes semblaient repondre aux changements de la taille de la population plus rapidement que ceux des femelles adultes. L'effet de la taille de la population a la naissance sur les traits physiques persistait pour les mesures squelettiques des femelles adultes. Les effets dependants de la densite apparents chez certains troupeaux mettent en evidence I'importance de determiner les facteurs mfluen^ant la dynamique des populations, en particulier pendant les periodes de declin. Les relations entre la taille et la condition corporelle, les taux demographiques et la dynamique des populations sont complexes, de sorte que les changements dans la taille des populations ne peuvent pas etre predits de maniere efficace par un suivi des traits physiques individuels.
SUMMARY
Monitoring and understanding wildlife population dynamics is key to their management and conservation. High population size or density can negatively affect demographic parameters including reproduction, recruitment and survival. These parameters are intricately linked to individual body size and condition. Migratory caribou (Rangifer tarandus) are a keystone species in the tundra. Populations can fluctuate drastically and rapidly and are challenging to monitor and manage. As an alternative to population estimates, indirect ecological indicators, which are density-dependent indices based on individual physical characteristics or performance, have been proposed to monitor ungulate populations. I amalgamated morphological data measured on newborns, yearlings and adult females for four migratory caribou herds; the Riviere-George, Riviere-aux-Feuilles, Beverly and Porcupine. I investigated how body condition relates to population dynamics at the individual level by determining how body size, condition and population size impact female reproductive success in the Riviere-George herd. At the population level, I determined the efficacy of body condition indices to estimate demographic trends for all four herds.
Body condition of adult females was positively related to the probability of gestation for the Riviere-George herd. Although population size negatively affected gestation rates, females did not adopt a conservative reproductive strategy as predicted, because the threshold adult female mass required for gestation did not vary with population size. At the population level, physical traits showed negative density dependence in three of the four herds. Physical traits, however, did not consistently correlate with population size nor did they predict numerical changes in population size. Physical traits often showed density dependence stronger, or even exclusively, during periods of demographic growth. Physical traits of juveniles seemed to respond to changes in population size more readily than those of adult females, and the effect of population size at birth persisted in skeletal measures of adults. Density dependence was apparent only in some herds, highlighting the importance of determining the drivers of population dynamics, particularly during periods of decline. Relationships between body
condition, demographic rates and population dynamics are complex, so that changes in population size cannot be predicted reliably by monitoring physical traits.
ACKNOWLEDGEMENTS
I have many thanks to give because "it's not just the journey but the people that carry you along the way". First and foremost I would like to thank my supervisors: Marco, for your incredible decisiveness and urgency, for setting the precedence and for putting me back on track when needed, and Steeve, pour m'avoir acceuillie, for countless insights, positive encouragement and the occasional but much needed compliments. I stood on the shoulders of giants and I sincerely thank you both for your patience considering I am the 'lagging strand', and for the unforgettable opportunities that accompanied working with you and researching caribou. I thank all my committee members: Sophie Calme and the late Don Thomas for their direction and time, with special mention to Fanie Pelletier for going above and beyond. Statistical advices from Marc Belisle were vital and constructive. This research was funded by several financial partners of Caribou Ungava including: ArcticNet, the Ministere des Resources naturelles et de la Faune du Quebec (MRNF), Labrador and Newfoundland Wildlife Division, Natural Sciences and Engineering Research Council of Canada, Hydro-Quebec, Federation des Pourvoiries du Hydro-Quebec, Canadian Wildlife Federation, X-Strata Raglan Mine, Centre d'etudes nordiques, and in partnership with Universite de Sherbrooke, Universite Laval and the CircumArctic Rangifer Monitoring and Assessment network. This research was contingent on data from: Drolet, Dauphine, Bergerud, Luttich, Parker, Huot, Manseau, Couturier, Taillon, the MRNF and the Government of Labrador, Russell, Allaye Chan-Mcleod, Thomas, Cooley and the Porcupine Caribou Technical Committee. Support and logistics from the Caribou Ungava group including Caroline, Jean-Pierre, Emilie, Glenn, Vincent and Mael, was indispensible. And in particular Joelle, who was the blue to my pink and acted as much as my mentor and colleague as friend. I thank those that got their hands dirty collecting caribou samples up North; Aurelie, Elise, and Charles. Joelle, Pascale and Jean-Yves, and my idol Stephane, taught me the ropes and had my back on the calving grounds. Without encouragement from Richard, Norm and Rachelle I would not have embarked on this journey, and without Elise, Audrey and Sharon I would not have succeeded. I thank all who supported me throughout, including my family, friends and fellow grad students.
TABLE OF CONTENTS
SOMMAIRE ii
SUMMARY iv
ACKNOWLEDGEMENTS vi
TABLE OF CONTENTS vii
LIST OF TABLES ix
LIST OF FIGURES xii
GENERAL INTRODUCTION 1
Population Dynamics and Monitoring 1
General Objectives 1
Demographic Parameters 2
Linking Size and Condition to Demographic Rates 2
Factors that Affect Body Size and Condition 3
Effects of Density on Body Condition and Size 4
Effects of Density on Survival and Reproduction 5
Ecological Indicators 7
Model Species and Specific Objectives 7
CHAPTER 1 12
SPRING-LOADED REPRODUCTION: EFFECTS OF BODY CONDITION AND POPULATION
SIZE ON GESTATION RATES IN MIGRATORY CARIBOU 12
ABSTRACT 12
INTRODUCTION 12
METHODS 15
Study Area and Population Estimates 15
Data Collection 15
Caribou Body Condition 16
Fertility 19
Adult female body condition 19
Gestation Predictors 19
Population Size as a Predictor of Pregnancy 20
DISCUSSION 24
Condition-Fecundity Relationships 26
Effect of Population Size 28
ACKNOWLEDGEMENTS 30
CHAPTER 2 31
MORPHOLOGICAL TRAITS OF MIGRATORY CARIBOU PREDICT POPULATION SIZE
BETTER IN PERIODS OF DEMOGRAPHIC GROWTH THAN DECLINES 31
ABSTRACT 31
INTRODUCTION 32
STUDY AREA 34
METHODS 35
Population Counts, Interpolating Population Estimates 35
Morphological Data 36
Statistical Analyses 38
RESULTS 38
Correlation of population size and average physical traits 39
Correlation of population size and average leg lengths 47
DISCUSSION 48
Riviere-George 51
Riviere-aux-Feuilles 53
Beverly and Porcupine 54
Conclusion 55
ACKNOWLEDGEMENTS 57
GENERAL CONCLUSION 58
LIST OF TABLES
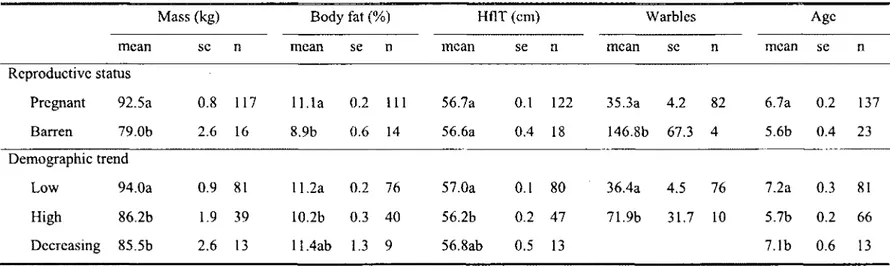
1. Average mass (kg), body fat (%), hind foot length (hflT) (cm), number of warbles and age with standard error (se) and sample size (n) grouped by reproductive status (pregnant or barren) and demographic trend (low and increasing, high and increasing or low and decreasing) of known-age female caribou (> 3 years) from the Riviere-George herd collected in 1980, 1984, 1986, 1987 and 2002. Presence or absence of a foetus was recorded during March and April, except for 5 individuals collected in late February in 1987. Values that differ significantly based on Tukey post-hoc tests for mass, body fat and hind foot length and based on Kruskal-Wallis tests for differences in age distribution and number of warbles, are denoted by different letters. Bonferonni correction was applied to determine significance
between demographic trends for age (p=0.017) 21
2. Model selection based on second order Akaike's information criterion corrected for small sample size (AICc) for the determinants of gestation in adult female migratory caribou of the Riviere-George herd in spring (March and April) 1980, 1984, 1986, 1987 and 2002. Models include 115 known-age individuals with all morphological measurements including mass (mass), percent body fat adjusted to March 23 (bodyfatC) and hind foot length (hflT). Population size (popest), and interactions denoted by asterisk (*) were also included in models along with a model containing no explanatory variables (null model). Models are listed in rank order with the 6 best models, with AICc values that do not differ by more than 2, in bold. Number of estimated parameters (k), change in AIC from lowest AICc value (AAICc), and cumulative weight of model (Cum. Wt) based on the likelihood that that model is
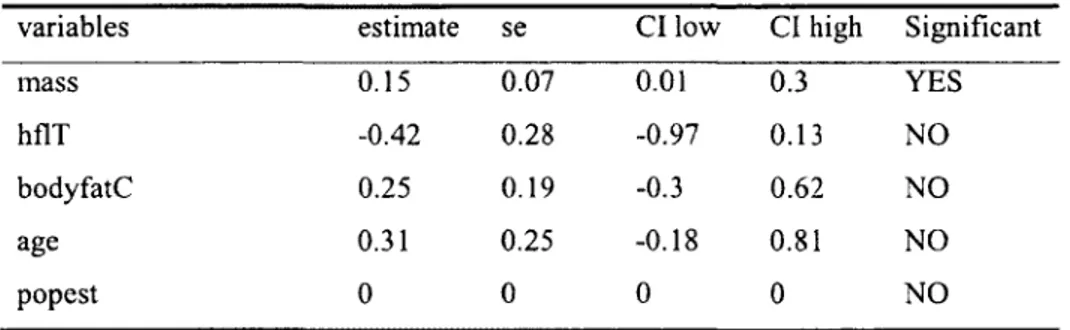
3. Model averaged parameter estimates, standard error (se) and 95% confidence intervals (CI) for variables from the 6 competing models from Table 2 for the determinants of gestation in adult female migratory caribou of the Riviere-George herd in spring (March and April) 1980, 1984, 1986, 1987 and 2002. Models included 115 known age individuals with all morphological measurements including mass (mass), percent body fat adjusted to March 23 (bodyfatC), hind foot length
(hflT) and population size (popest) 24
4. Model selection based on second order Akaike's information criterion corrected for small sample size (AICc) for the determinants of gestation in adult female migratory caribou of the Riviere-George herd in spring (March and April) 1980, 1984, 1986, 1987 and 2002. Models include 131 known age individuals with measured mass (mass) and hind foot length (hflT). Population size (popest) and interactions denoted by asterisk (*) were also included in models. Models are listed in ranked order with the best model in bold. Number of estimated parameters (k), change in AIC from lowest AICc value (AAICc), and cumulative weight of model (Cum. Wt) based on
the likelihood that that model is the best model (LL) are presented 25
5. Number of individuals and years where body condition variables were sampled in four migratory herds (Riviere-George, Riviere-aux-Feuilles, Beverly and Porcupine), according to age class (newborn, yearling, adult), season (summer, autumn, spring and autumn/winter), and physical traits measured (whole mass (mass), eviscerated mass (mass2), hind foot length (hfl), metatarsus length (meta), metatarsus bone length and percent body fat (fat)) with reference to publications. Traits with the same sample size are conjoined with a "+" and traits that differ appear in brackets, with associated sample sizes and changes in population size in brackets. Total number of individuals and years are shown for each trait, with the number of years during periods of population increase and decrease and the estimated change in population size for each growth and decline phases 40
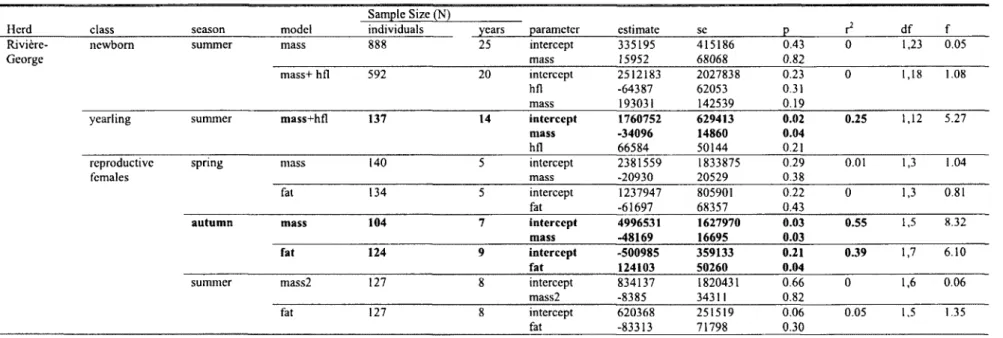
6. Correlations between estimated population size and average morphological measures (whole body mass (mass) eviscerated mass (mass2), hind foot length (hfl), and percent body fat (fat)) with condition corrected for collection date denoted with a "C", according to age class (calves, yearling females (yearling) and adult (>2 years old) females and season (spring, summer, autumn and autumn/winter), of caribou from four migratory herds (Riviere-George, Riviere-aux-Feuilles, Beverly and Porcupine). Females were considered reproductive if they were pregnant in spring or lactating in summer and autumn. Parameter estimates are shown with their standard error (se), p-values (p), variation they explained in population size (r2), degrees of freedom (df) and f-statistic (f)- Significant models (p<0.05) are in
bold 42
7. Correlations between estimated population size and average leg lengths (metatarsal length (meta) and hind foot length (hfl) for adult (>2.5 years old) female caribou from four migratory herds (Riviere-George, Riviere-aux-Feuilles, Beverly and Porcupine). Data that included transformations of measurements are denoted with a "T" (see text). Parameter estimates are shown with associated standard error (se), p-values (p), variation explained in population size estimate (r2) and degrees of freedom (df). Sample size of number of individuals and cohorts included in analyses are presented. Cohorts with fewer than 5 individuals were excluded from analyses.
LIST OF FIGURES
1. Distribution of major North American migratory tundra caribou herds with their associated calving grounds, including the four study populations: the Porcupine, Riviere-George, Riviere-aux-Feuilles and Beverly herds. Figure from
2. Population estimates (points) of the Riviere-George, Feuilles, Porcupine and Beverly migratory caribou herds over time. Bars represent 90% confidence intervals for the Riviere-aux-Feuilles and Riviere-George herds and standard error for the Beverly herd, when available. Lines depict population trajectories for all four herds
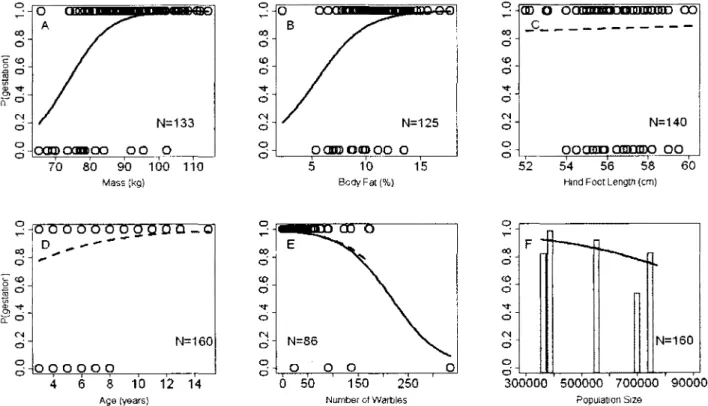
3. Logistic regressions of the probability of gestation according to body condition indices and population size for Riviere-George caribou females aged 3 to 16 years collected in spring of 1980, 1984, 1986, 1987 and 2002. Regressions predicting presence (1) or absence of foetus (0) for (A) mass, (B) percentage of body fat and (F) population size were significant. Regressions for (C) hind foot length and (D) age were not significant. Logistic regression of (E) the number of warbles was significant (solid line) but became marginally insignificant after removing the female with the highest warble count (dotted line). Raw data (points) are shown, except for (F), instead grey bars show the proportion of pregnant females at given
population sizes 22
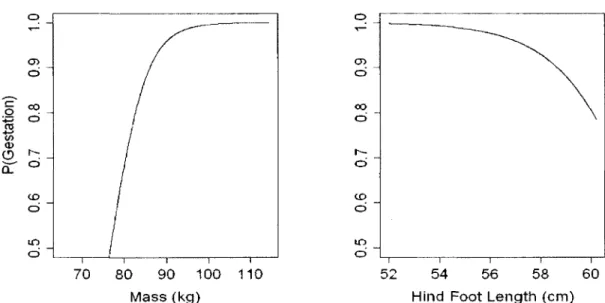
4. Model predictions, from best model with 131 individuals selected using AICc in Table 4, of gestation in relation to mass in April and May at average hind foot length (left panel), and in relation to hind foot length at average mass (right panel) for adult females of the Riviere-George herd in 1980, 1984, 1986, 1987 and
(Hummel et al., 2008) 9
based on loess smoothing 1 1
5. Average calf birth mass and yearling mass in June (kg) (a,c) and average calf and yearling hind foot length (cm) (b,d) with standard errors, overlaid with estimated population size (red line) (based on average growth rate between population counts)
over time for caribou of the Riviere-George herd 45
6. Average calf birth mass and yearling mass in June (kg) (left panels) and average calf and yearling hind foot lengths (cm) (right panels) with standard errors overlaid on estimated population size (based on average growth rate between population counts)
over time for caribou of the Riviere-aux-Feuilles herd 46
7. Average leg lengths (hind foot length (cm), metatarsus length (cm) and metatarsal bone length (mm) with standard error plotted according to year of birth, overlaid with estimated population size (based on average growth rate between population counts) over time, for caribou of the (a) Riviere-George, (b) Riviere-aux-Feuilles,
GENERAL INTRODUCTION
Population Dynamics and Monitoring
Wildlife management requires knowledge of population dynamics. Monitoring population size is not only fundamental (Morellet et al., 2007; Zannese et al., 2006), it is high priority for managers (Klein et al., 1999), yet it poses logistical difficulties. A plethora of ways to estimate population size or proxies of population size exist (Nugent and Frampton, 1994) but their accuracy and precision have been questioned (Jachmann, 2002; Pettorelli et al., 2007; Redfern et al., 2002). New statistical methods have been devised to analyze demographic data, but still offer an imperfect solution (Saether et al., 2007).
General Objectives
The overall objective of my research was to better understand population dynamics of migratory caribou (Rangifer tarandus) based on body condition indices, or individual physical traits. Individual body size and condition are associated to demographic parameters (ex.fecundity) that affect population dynamics, and are affected by a variety of factors including population density. The two main objectives of my research were to determine the effect of population size on the relationship between gestation and female size and condition and to determine the efficacy of physical traits to monitor population size. With the aim of improving our understanding of the factors that affect demographic parameters that in turn, influence population dynamics, to allow for more informed management decisions. Discovering new proxies of population size could improve methods of wildlife populations monitoring, especially populations of migratory caribou, where it is particularly difficult to obtain consistent population estimates.
Demographic Parameters
Changes in population size can be partitioned into their component demographic parameters such as age specific reproduction and survival (Fowler, 1987). For ungulates in general, juvenile survival is typically more sensitive to various ecological factors and variable over time compared to adult survival (Gaillard et al., 2000). Senescent individuals and males typically have relatively lower survival rates than prime-aged females (Dumont et al., 2000; Loison et al., 1999). Recruitment rates of juveniles affect population growth rates (Gaillard et al., 1998) but if adult female survival varies, it will typically have a dramatic impact on population growth (Crete et al., 1996; Eberhardt et al, 2007; Walsh et al., 1995).
Intrinsic factors such as the age-sex structure and density of a population (Coulson et al., 2001; Festa-Bianchet et al., 2003; Pelletier et al., 2011), along with extrinsic factors like predation (Sinclair et al., 2003), environmental stochasticity (Post and Forchhammer, 2002), disease (Joly and Messier, 2004), and catastrophes influence population dynamics through their impact on demographic rates. Similar factors influence several species but the relative importance of specific factors varies among species (Coulson et al., 2000) and populations. For example, the most important determinant of population growth was age structure in red deer (Cervus elaphus) (Pelletier et al., 2011), bighorn sheep (Ovis canadensis) and mountain goats (Oreamnos americanus) (Festa-Bianchet et al., 2003), but density superseded age structure for Soay sheep (Ovis aries) (Coulson et al., 2008). The effects of intrinsic and extrinsic factors can occur simultaneously (Coulson et al., 2000) or interact (Skogland, 1985). The effects of density can be exacerbated by harsh environmental conditions (Coulson et al., 2001; Pelletier etal., 2011).
Linking Size and Condition to Demographic Rates
which represents phenotypic quality. Phenotypic quality affects life history traits (Bergeron et al., 2011) including survival and reproductive success, ultimately influencing individual fitness and affecting population growth rates.
Individual condition and size are positively associated to individual survival in juvenile roe deer (Capreolus capreolus) (Gaillard et al., 1997), mule deer (Odocoileus hemionus) (White and Bartmann, 1998), bighorn sheep (Festa-Bianchet et al., 1997), elk (Cervus elaphus) (Singer et al., 1997) and moose (Alces alces) (Keech et al., 2000). Adult body condition and size are positively linked to reproductive success for many species. Females that are heavier (Adams and Dale, 1998), fatter (Crete et al., 1993) or both heavier and fatter (Thomas, 1982), breed at a younger age (Messier et al., 1988), have a higher probability of pregnancy (Cameron et al., 1993; Gerhart et al., 1997; Reimers, 1983; Russell et al., 1998), produce more offspring, reproduce more frequently (Cameron, 1994) and produce better quality offspring (Tveraa et al., 2003).
Factors that Affect Body Size and Condition
Individual morphology is partly determined by resource availability (Simard et al., 2008; Zedrosser et al., 2006) and quality (Cote and Festa-Bianchet, 2001). Nutritional plane during development affects individual growth, which determines structural size that is fixed once growth is completed, and current condition. Morphology is therefore affected by a multitude of heritable, intrinsic and environmental factors. Time to complete somatic growth varies between species, sexes, and the different bones and the allocation of resources to bone, tissue and organ growth is species-specific (Hilton et al., 2000). For example, caribou leg bones may have growth priority (Klein et al., 1987) and take 2.5 years to complete growth compared to mandibles whose growth takes 4 years for females and 5 years for males (Parker, 1981). For neonates that rely on maternal nutrition, growth and condition are influenced by maternal traits from conception to weaning (Taillon et al., 2012a; Therrien et al., 2007).
Individual reproductive strategy can also influence body condition of females. Age of primiparity can affect adult body size of females as seen by hindered growth in bighorn ewes due to early reproduction (Festa-Bianchet et al., 1995). In caribou, mandible length was thought to be affected by age at first reproduction (Gerhart et al., 1997). Female condition typically differs between reproductive classes (Allaye Chan-McLeod et al., 1999) during pregnancy (Cameron et al., 1993; Russell et al., 1998) and lactation (Gerhart et al., 1997; Reimers et al., 2005). The cost of lactation is high (Barboza and Parker, 2008) and can cause reproductive pauses (Adams and Dale, 1998) due to decreased body condition.
Climate can directly impact body condition through energy expenditures (Couturier et al., 2010), or indirectly by affecting the availability and abundance of resources (Boelman et al. 2005, Barrette and Vandal 1986). Availability and abundance of resources can vary between seasons causing body condition to vary (Chan-McLeod et al., 1999; Crete and Huot, 1993). For most northern ungulates, mass and body fat content typically decrease over winter (Bergerud et al., 2008), with the exception of the Riviere George herd females that gain fat over winter (Couturier et al., 2009a).
Effects of Density on Body Condition and Size
Density dependence can be defined as a decrease in population growth rate as density increases. As population size increases, body condition typically decreases although not necessarily linearly (Moller et al., 2004). Although few studies have provided empirical evidence of this negative density dependent effect (Bonenfant et al., 2009), the mechanism is thought to be nutritional limitation due to increased competition. When nutrition is limited, it affects a variety of morphological measures. Due to differential nutritional requirements, the effects of density are often age and sex dependent (Coulson et al., 2001).
al., 2009b; Post and Klein, 1999; Weladji et al., 2003). Female body mass in reindeer is negatively correlated to population density (Helle and Kojola, 1994). In roe deer, density had negative effects on body weight for juveniles and adult males, but not for adult females (Vincent et al., 1995). Yet an experimental increase of density in elk caused a reduction in the body condition of females (Stewart et al., 2005). Density dependent effects on adult body size have been documented in fallow deer (Dama dama) metacarpus length (Serrano et al., 2007), roe deer leg length (Zannese et al., 2006), diastema mandible height in fallow deer (Nugent and Frampton, 1994) and mandible length in roe deer (Hewison et al., 1996) and caribou (Couturier et al., 2010) but may differ between sexes as observed in muskox (Lyberth et al., 2007).
Different morphological measures may also respond differently to changes in resource availability. Juvenile mass may respond before skeletal measures to changes in density, as seen in roe deer (Toigo et al., 2006). White-tailed deer (Odocoileus virginianus) fawns under resource limitation allocated resources to lipogenesis before body growth, ultimately affecting body size (Lesage et al., 2001; Verme and Ozoga, 1980).
Effects of Density on Survival and Reproduction
Life history theory posits that under resource limitation, individuals must make trade-offs in the allocation of resources to growth, maintenance and reproduction (Stearns, 1992). In addition to the negative effects of density on growth and condition, negative effects on demographic rates including reproduction and survival have been well documented (Bonenfant et al., 2009). As a population increases and approaches carrying capacity, changes in its demographic parameters typically follow a predictable sequence beginning with an increase in juvenile mortality, followed by an increase in the age of primiparity, then a reduction in reproductive rates and lastly, in extreme cases, an increase in adult mortality (Eberhardt, 2002).
Density has been shown to reduce survival probability of juveniles in many species (Bonenfant et al., 2009 and Gaillard et al., 1998). Density affects juvenile survival more than adult survival, as adult female survival is buffered against density and environmental stochasticity (Gaillard et al., 1998). Density effects on adult survival have been reported for buffalo (Syncerus cafer) (Mduma et al., 1999), Soay sheep (Clutton-Brock et al., 1992) and reindeer (Helle and Kojola, 2008) where density interacted with climate. Females may buffer their own survival when resources are limited by reducing litter size (Sand et al., 1996), maternal care (Bardsen et al., 2008; Martin and Festa-Bianchet, 2010), or fertility (Albon et al., 1983; Sand et al., 1996). During demographic growth, age of primiparity increases (Messier et al., 1988), gestation rates decrease (Mduma et al., 1999), fecundity decreases (Hewison, 1996; Stewart et al., 2005), and the threshold mass needed to conceive increases (Albon et al., 1983; Heard et al., 1997; Sand et al., 1996).
In theory, the effects of density should become apparent either as a population approaches its carrying capacity (Fowler, 1981) or after a threshold density has been reached (Getz, 1996). Most studies of density dependence document negative effects during demographic growth. Because density acts indirectly to limit body size and condition by limiting resources, effects on body condition should be reversible. Indeed, adult female caribou from the Riviere George herd fed ad libitum gained weight and became fatter (Crete et al., 1993). Similarly, experimental reduction of a feral donkey (Equus asinus) population increased juvenile growth rate and condition (Choquenot, 1991). Population reduction led to an increase in white-tailed deer male mass and hind foot length for fawns, yearling and adults (Ashley et al., 1998). Other examples of improved condition during periods of natural population declines include mandible size of female caribou (Couturier et al., 2010), birth weights of caribou (Skogland, 1990), and roe deer (Hewison et al., 2002). Demographic parameters have also been shown to improve as populations declined, including age of primiparity in caribou (Crete et al., 1993), mortality rates of donkeys (Choquenot, 1991), and survival of mule deer fawns (White and Bartmann, 1998).
Density dependence can have an immediate effect on body condition (Gaillard et al., 2000), or it can manifest after a time lag (Fryxell et al., 1991; Messier et al., 1988) due to delays in vegetation re-growth (Henry and Gunn, 1991) after overgrazing. Lags in density dependent responses can also be due to cohort effects as conditions at birth may affect reproductive rates only after sexual maturity has been reached years later (Forchhammer et al., 2001; Gaillard et al., 2003; Pettorelli et al., 2002; Simard et al., 2011).
Ecological Indicators
Ecological indicators are density-dependent physical characteristics or demographic parameters that reflect changes in a population relative to its environment (Morellet et al., 2007). Ecological indicators have been proposed to monitor ungulate populations including roe deer (Hewison et al., 1996; Morellet et al., 2007; Toigo et al., 2006; Zannese et al., 2006) and several African species (Du Toit, 2002). Examples of ecological indicators used in roe deer include fawn leg length (Toigo et al., 2006), fawn mass (Gaillard et al., 1996), cohort mandible length (Hewison et al., 1996), and female to young ratios (Vincent et al., 1995). However, density-dependent responses vary according to whether a population is increasing or decreasing (Fryxell et al., 1991) and ecological indicators have only been validated during periods of demographic growth or high density (Zannese et al. 2006, Morellet et al. 2007, Hewison et al. 1996 and Vincent et al. 1995).
Model Species and Specific Objectives
Migratory caribou and reindeer are found throughout the circum-arctic and have high cultural importance for many aboriginal communities (Kendrick and Manseau, 2008) as well as economical importance. Currently, most populations are declining (Festa-Bianchet et al., 2011; Vors and Boyce, 2009). Populations of migratory caribou appear to fluctuate more rapidly and drastically than those of other large mammals (Bergerud et al., 2008) presenting a challenge to consumptive management of this species. Due to large home ranges and northern distribution (Figure 1), aerial surveys are currently the only effective way to obtain population
estimates. Because they are costly, population counts are infrequent (Figure 2). In addition, estimates often have large confidence intervals (Couturier et al., 2010) (Figure 2).
Factors that influence caribou population dynamics include large-scale climate patterns (Joly et al., 2011; Vors and Boyce, 2009), weather and predation (Adams and Dale, 1998; Boertje, 1990), parasites (Albon et al., 2002), density-dependent food limitation (Skogland, 1983) and reduced adult survival (Crete et al., 1996). Caribou managers have monitored growth, condition, survival and reproduction to better understand population fluctuations. However, the proximal causes of population fluctuations remain poorly understood. Density dependence in demographic parameters and morphology has been documented in many herds, along with the relationships linking body size and condition to demographic rates, but gaps in knowledge still exist. Body condition and size are positively correlated to fecundity and population size reduces productivity (Crete et al., 1996). Whether population size influences fecundity indirectly by affecting body condition or if females adopt a conservative reproductive strategy at high density as seen in other species, however, has yet to be investigated in migratory caribou. Similarly, many morphological measures of migratory caribou and vital rates have shown density dependence. However, unlike other species, morphological measures have not been validated as ecological indicators and the overall usefulness for ecological indicators to inform on changes at the population level during various phases of population abundance has not been assessed.
calving area herd range
CJJ»' ChurcMI
Figure 1. Distribution of major North American migratory tundra caribou herds with their associated calving grounds, including the four study populations: the Porcupine, Riviere-George, Riviere-aux-Feuilles and Beverly herds. Figure from (Hummel et al., 2008).
These gaps in knowledge led to the two main objectives of this study. Firstly, at the individual level, I sought to determine if females adopt a conservative reproductive strategy by investigating the mechanism by which population size affects fecundity rates through its interaction with body size and condition. More specifically, I wanted to determine which body size, condition or health indices, including mass, body fat, parasite infection and leg length, affect the probability of gestation. Also, I investigated the effect of population size on gestation rates and its effect on the relationship between physical condition and gestation rates. The Riviere George herd was examined to test this hypothesis since body condition data on pregnant and non-pregnant females were available over a large range of population sizes. 1 hypothesized that, similar to other herds, larger, heavier and fatter females with low parasite
infections would have a higher probability of gestation. And similar to other long lived iteroparous mammals, females would adopt a conservative reproductive strategy at high population size.
The second objective, at the population level, was to determine which physical traits act as ecological indicators for migratory caribou and to assess their usefulness to predict population size. Specifically, my goal was to quantify correlations between juvenile morphology (mass and leg length), seasonal adult condition (mass and fat) and adult size (leg length) with population size for four migratory caribou herds. Because nutrition can determine adult size and current condition (Parker et al., 2009), I hypothesized that average physical traits would vary according to population size when nutrition was the limiting factor. An increase in density often limits resource availability, whereas reduced density is not always associated with an increase in resources (Bonenfant et al., 2009). Therefore, I hypothesized that density dependence would be more prominent during periods of demographic growth. And as seen in other ungulates, I hypothesized that juveniles would respond more readily than adults to changes in population size (Gaillard et al., 2000). Ecological indicators that inform on population size would act as an alternative to infrequent population counts and be invaluable for caribou managers and the conservation of migratory caribou.
1400000 -Beverly Feuiiies George Porcupine 1200000 -N1000000 C 800000 600000 -Q. 400000 !00000 -—i— 1960 —i— 1970 1980 1990 i —i— 2000 2010 Year
Figure 2. Population estimates (points) of the Riviere-George, Riviere-aux-Feuilles, Porcupine and Beverly migratory caribou herds over time. Bars represent 90% confidence intervals for the Riviere-aux-Feuilles and Riviere-George herds and standard error for the Beverly herd, when available. Lines depict population trajectories for all four herds based on loess smoothing.
CHAPTER 1
SPRING-LOADED REPRODUCTION: EFFECTS OF BODY CONDITION AND POPULATION SIZE ON GESTATION RATES IN MIGRATORY CARIBOU
ABSTRACT
In many ungulates, including caribou, female fecundity is affected by body condition and has important effects on population dynamics. In some species, females adopt a conservative strategy, reducing reproductive effort when population density is high. We investigated what factors affect the probability of gestation in adult female caribou from the Riviere-George herd in northern Quebec and Labrador over five years that spanned various population sizes and trends. Similar to other populations of migratory caribou, the probability that a female was pregnant in spring increased with body mass and percentage of body fat. The probability of gestation appeared to be reduced by high warble infestation. The proportion of females pregnant varied between years and was reduced at high population size. Females of similar mass, however, were pregnant regardless of whether the population was increasing at low density, had reached a peak, or was declining. Compared to other ungulates that reduce maternal expenditure at high density, female caribou of the Riviere-George herd may have a risk-prone reproductive strategy.
INTRODUCTION
Life history theory assumes that limited resources force trade-offs among fitness components such as growth, reproduction and survival (Stearns, 1992). These trade-offs lead to variation in life history traits including fecundity, age at primiparity and reproductive lifespan or aging. Because fecundity affects population productivity (MacDonald et al., 2009; Promislow and Harvey, 1990), understanding female reproductive strategy is key to population dynamics and
(Couturier et al., 2009; Vincent et al., 1995) are regularly suggested as management tools to evaluate population performance.
Reproductive performance may vary with individual characteristics such as age (Festa-Bianchet, 1988; Ropstad, 2000; Sand et al., 1996), body condition (Sand et al., 1996; Testa and Adams, 1998) and previous reproductive experience. Extrinsic factors including density (Albon et al., 1983; Sand et al., 1996), predation, parasitism (Hughes et al., 2009) and weather (Adams and Dale, 1998; Post and Stenseth, 1999) may also affect reproductive performance. Most research has focused on how female body size and condition relates to reproductive success through age at primiparity (Jorgenson et al., 1993), lifetime reproductive success and fecundity (Crete et al., 1993; Dauphine and McClure, 1974; Reimers, 1983). Good body condition allows females to reproduce earlier, more often, and produce more or larger offspring with high survival rates (Tveraa et al., 2003). Environmental factors such as climate may affect body condition indirectly by affecting food availability and energy expenditure (Solberg et al., 2001). High population density can limit resource availability through increased competition (Clutton-Brock et al., 1982).
When resources are limited, females may increase their survival by limiting investment in reproduction. Indeed, long lived iteroparous animals typically adopt a conservative reproductive strategy at high population densities by reducing litter size (Sand et al., 1996), maternal care (Bardsen et al., 2008; Martin and Festa-Bianchet, 2010), or fertility (Albon et al., 1983; Sand et al., 1996). Few studies have revealed density-dependent effects on adult female survival (Gaillard et al., 2000) supporting the contention that females favor maintenance and survival over reproduction. That contention is also supported by the sequence with which vital rates usually change as population density increases: first survival of young decreases, then age of primiparity increases, after which reproductive rates decrease and lastly, but rarely, adult survival decreases (Eberhardt, 2002).
Potential mechanisms for how density impacts reproductive rates have been identified. Density affected age of primiparity through a reduction in body condition for bighorn sheep,
but also selected for a more conservative reproductive strategy, independent of body condition (Jorgenson et al., 1993). Similarly, density reduced not only adult female mass but also age-specific fecundity in moose (AIces alces), beyond what could be explained by the decrease in body condition (Sand et al., 1996). In red deer hinds, the threshold mass required for females to conceive was higher at high than at low population density (Albon et al., 1983).
Understanding reproduction of migratory caribou is of particular interest because populations undergo rapid and extensive fluctuations (Morneau and Payette, 2000). Reproduction is one of the first vital rates affected by an increase in population size in migratory populations (Crete et al, 1996). In rapidly increasing populations, yearling females have high pregnancy rates (Ouellet et al., 1997; Parker, 1980) but yearlings may stop conceiving at high density (Crete and Huot, 1993). Reproduction in caribou is associated with body size (Gerhart et al., 1997) and condition in both autumn (Adams and Dale, 1998; Cameron and Hoef, 1994; Cameron et al., 1993) and spring (Russell et al., 1998). Female caribou that first reproduce at a young age are typically heavier (Adams and Dale, 1998), fatter (Crete et al., 1993) or both heavier and fatter (Thomas, 1982) than those that delay primiparity. Among adults, females that conceive are heavier and fatter than those that do not conceive (Allaye Chan-McLeod et al., 1999). Fecundity-body condition relationships for adults have been determined for several populations, including the Denali herd (Adams and Dale, 1998), the Porcupine herd (Gerhart et al., 1997), the Central Arctic Herd (Cameron et al., 1993) and Peary populations (Thomas, 1982).
The relationship between body condition and fecundity in caribou varies with age (Adams and Dale, 1998; Cuyler and Astergaard, 2005), lactation status (Gerhart et al., 1997) and weather (Adams and Dale, 1998). Although the effect of density on reproductive rates has also been examined, its effect on the relationship between condition and fertility has yet to be assessed. Our objectives were to determine if (1) the relationship between body condition and fecundity seen in other herds was conserved in the Riviere-George herd and (2) if females adopted a
body fat) and health (lower parasitic infection) would have a higher gestation rate in spring compared to females in poorer condition and/or health. As well, because caribou are long-lived and iteroparous, we expected females to adopt a conservative reproductive strategy, so that the threshold body condition required to reproduce would increase with population density.
METHODS
Study Area and Population Estimates
The Riviere-George herd is a migratory caribou herd in Northern Quebec and Labrador. The annual range estimate was 213 390 km2 in 2009 (Taillon, J. per. comm.), although range size varies with population size (Couturier et al., 2010). The Riviere-George increased from approximately 5000 in the 1950s to an apparent peak approximating 1 000 000 individuals in 1989 (Crete et al., 1996). It then declined to 776 000 in 2001 (Couturier et al., 2009b) and to less than 75 000 individuals in 2010 (Quebec Government aerial count).
Data Collection
Scientific culls from the Riviere-George have been conducted for decades, but sampling methods and purposes differed between researchers and years. We restricted analyses to collections where the selection of females was not biased towards particular reproductive classes. Age of females was assessed by counting the cementum annuli of an incisor (Miller, 1974). Data we used were collected from late February to April and limited to known-age individuals, where the presence or absence of a foetus was recorded. Data meeting these requirements were collected in April 1980 by G. Parker; in April 1984 by J. Huot; and in March 1986-1987, February and April 1987, and March 2002 by S. Couturier.
Because not all age classes were sampled equally in all years and to avoid the possible complications associated with primiparity, we defined adult females as > 3 years old. Limited
number of old individuals sampled precluded the analysis of senescence effects. We therefore excluded the oldest female collected, a barren 17-year-old, from analyses. Our data set included 160 females, of which 23 were barren and 137 were pregnant.
Caribou Body Condition
Body condition indices typically measured included whole mass and/or eviscerated body mass, hind foot length and/or metatarsal length, kidney fat mass and kidney mass, percentage of femur marrow fat, and parasite load denoted by the absolute number of warbles (Hypoderma tarandi) counted. Protocols for animal culls and body condition measurements are described elsewhere (Couturier et al., 2009a; Huot, 1989; Parker, 1980). Percentage of body fat was calculated as 0.091*KFFI-1.382 based on (Crete et al., 1993), where KFFI is the kidney fat femur index (KFI + % Femur marrow fat) (Huot and Picard, 1988). KFI is the kidney fat index based on the Riney fat index (Riney, 1955). The average of the right and left kidney weights and kidney fat weights was used to calculate the KFI, except for 15 of 172 cases where only one kidney or kidney fat was weighed.
Because body condition varies seasonally, we used ANCOVAs to test for an effect of collection date on mass and percent body fat and for a possible interaction between these variables and pregnancy status. We used eviscerated masses collected from February to May in 1987 to test for an effect of collection date on body mass. Collection date did not affect eviscerated body mass (F(i,3g)=0.94, p=0.34) nor did it affect pregnant and barren females differently (interaction: p=0.63).
Pooling all years, percent body fat decreased from late February to April (F(3,i6l)=5.80, p<0.01) and in interaction with pregnancy status (p=0.02) such that there was a decrease in body fat for gestating but not for barren females. We therefore adjusted body fat of pregnant females to March 23, the middle of the sampling period for all years. Pregnant females lost on
To compare metatarsal lengths measured in 1980 with hind foot lengths measured in 1984-2002, we transformed metatarsal lengths using a correlation based on 132 adult females from the Riviere-George from 8 years (1986-1988, 2001-2003 and 2007) including collections outside of this study (F(lii29)==275.80, r2=0.68, p=2,20*10"16, hind foot length=1.31*metatarsal length+4.69).
Population Estimates
Population counts were available for two years when body condition data were collected (1980 and 1984). Population size for 1986, 1987 and 2002 was estimated by fitting a loess smoothing spline on available population counts. Aerial counts were made in 1988, 1993 and 2001, so all population estimates were within one or two years of actual counts. We accounted for population size and trend in three ways: (1) as a continuous vector using actual counts and inferred estimates, (2) grouped into two categories: above and below 500 000 individuals, following Couturier et al. (2009), and (3) grouped into three phases that accounted for both population density and trend: low and increasing (1980), high and approaching the peak (1984-1987), and declining (2002).
Statistical Analyses
We used R software version 2.12.1 (R Development Core Team 2010) for all statistical analyses. General Linear Models (GLM) with a binomial distribution were used to model the probability of gestation as a function of female age, mass, hind foot length, percent body fat, warble infection, population size and trend. Year of collection was tested as a random effect in mixed models but was not significant so analyses were performed using GLMs. Our data were non-orthogonal. Unequal sample sizes were due to missing data on several individuals. We first used maximum sample sizes (ranging from 86 to 160) to model the probability of gestation based on each variable separately. We then excluded warble counts from further multivariate analyses, as counts were only available for two of the five years, to test all other
body condition variables with population size and trend. These analyses were performed using a data set with 115 individuals. Subsequent analyses excluded body fat and therefore only included variables that can be measured or estimated on live animals. Body fat was not available for 16 females. Therefore when body fat was excluded for analyses, the sample increased to 131 individuals.
We checked all explanatory variables for collinearity before combining them in the same model. We used the vif function in the "car" package to test the variance inflation factor of variables in all full models. Variables were not combined in models if the variance inflation factor exceeded 2. The highest correlation for both sample sets was between mass and body fat (0.47) in the set containing all variables (n—115). All other variables were only weakly correlated (r<0.32). Older females were larger, heavier and fatter than younger females. Warble count and population size were negatively correlated to all other variables such that older, larger, heavier and fatter females had fewer warbles and were mostly sampled at low population size.
We considered all results significant at a<0.05 for univariate General Linear Models. Due to small sample size, model selection was performed using a second order Aikaike Information Criterion (AICc). The model with the lowest AICc was retained (Burnham and Anderson, 2002). Differences in AICc values of at least 2 were used to determine if one model was better than another. Because several models were indistinguishable based on AICc values, we used the modavg function from the "AlCmodavg" package in R to calculate weighted (w,) parameter estimates for explanatory variables along with their standard errors and 95% confidence intervals. Variables were considered significant if the confidence interval of their estimate did not overlap zero. Step-wise model selection following (McCullagh and Nelder, 1989) led to similar models being selected.
RESULTS
Fertility
When all years were pooled, 27% of 33 yearlings were pregnant. Gestation rates increased to 76% for 122 females aged two to four years and 90% for 103 females aged 5 years or older. Nine of 16 yearlings were gestating in 1980, when the population was low and increasing. These animals would have given birth as two-year-olds. In 1984, 1986 and 1987, none of 12 yearlings collected were pregnant. No yearlings were collected in 2002 when the population was decreasing.
Adult female body condition
Pregnant females were on average 13.5 kg heavier, 2.3% fatter, were older and had fewer warbles than barren females, but did not differ in hind foot length (Table 1). Females were in good condition when the population was low and increasing (1980), as they were heavier and larger (based on hind foot length) compared to when the population was high (1984-1987) or decreasing (2002) (Table 1). The different age distribution in 1980 compared to all other periods (Table 1) was likely due to differences in yearly sample sizes caused by variation in sampling methods. Based on percent body fat, females were in good condition with over 10% body fat for all periods of demographic trend (Table 1). However, females had 1.1 % less body fat when the population was nearing a peak compared to when the population was low (Table 1). Average number of warbles nearly doubled as the population increased (Table 1).
Gestation Predictors
For females aged 3 or older, hind foot length (estimate= 0.03 ± 0.17, n=140, p=0.90) and age (estimate= 0.26 ± 0.13, n=160, p=0.08) did not affect fecundity in simple logistic models (Figures 3C and 3D, respectively). Fecundity increased with both mass (estimate=0.17 ± 0.04, n=133, p<0.01) and percent body fat (estimate^ 0.44 ± 0.04, n=132, p<0.01) (Figures 3A and
3B). Fewer females were pregnant at high population size than at lower population size (estimate= -0.0004 ± 0.0001, n=160, p<0.01) (Figure 3F). Warble infestation reduced the probability of gestation (estimate= -0.02 ± 0.01, n=84, p=0.01, Figure 3E). When the female with the highest infestation (336 warbles) was removed, however, the regression was not significant (estimate= -0.02 ± 0.01, p=0.06, n=83, Figure 3E). If we excluded this potential outlier but included 2-year-olds as in Gerhart et al. (1997) and Hughes et al. (2009), the negative effect remained significant.
In simple logistic models, body mass was the best predictor of pregnancy rate and explained 22.5% of the variation in fertility. Percent body fat was significant but explained only 12.1% of the variation. At average mass (91.2 kg), females had a 91% probability of being pregnant. All but 3 non-pregnant females were lighter than this threshold. At average percent body fat (10.9%), females had a 95% chance of being pregnant.
Population Size as a Predictor of Pregnancy
Population size as a continuous variable had the lowest AICc value (62.8) compared to population size grouped into 2 groups (AICc=64.3) or population trend (3 groups) (AICc=63.1). Therefore, we used population size as a continuous variable in AICc model selection. There were 115 females with all variables measured, including body fat. Both AICc and step-wise model selection with nested models suggested that mass was the most important factor affecting the probability of gestation (Tables 2 and 3). The inclusion of a quadratic effect of age did not affect model selection based on AICc and did not alter parameter estimates. Although hind foot length was included among the best models using AICc, its parameter estimate did not significantly differ from zero (Table 2) and it bordered on significance (p-0.07) in models obtained by a step-wise selection. Based on AICc model selection, the relationship between mass and fertility did not vary according to population size as no interaction between population size and body condition variables were retained (Table
Table 1. Average mass (kg), body fat (%), hind foot length (hflT) (cm), number of warbles and age with standard error (se) and sample size (n) grouped by reproductive status (pregnant or barren) and demographic trend (low and increasing, high and increasing or low and decreasing) of known-age female caribou (>3 years) from the Riviere-George herd collected in 1980, 1984, 1986, 1987 and 2002. Presence or absence of a foetus was recorded during March and April, except for 5 individuals collected in late February in 1987. Values that differ significantly based on Tukey post-hoc tests for mass, body fat and hind foot length and based on Kruskal-Wallis tests for differences in age distribution and number of warbles, are denoted by different letters. Bonferonni correction was applied to determine significance between demographic trends for age (p=0.02).
Mass (kg) Body fat (%) HflT (cm) Warbles Age
mean se n mean se n mean se n mean se n mean se n
Reproductive status
Pregnant 92.5a 0.8 117 11.1a 0.2 111 56.7a 0.1 122 35.3a 4.2 82 6.7a 0.2 137
Barren 79.0b 2.6 16 8.9b 0.6 14 56.6a 0.4 18 146.8b 67.3 4 5.6b 0.4 23
Demographic trend
Low 94.0a 0.9 81 11.2a 0.2 76 57.0a 0.1 80 36.4a 4.5 76 7.2a 0.3 81
High 86.2b 1.9 39 10.2b 0.3 40 56.2b 0.2 47 71.9b 31.7 10 5.7b 0.2 66
Decreasing 85.5b 2.6 13 11,4ab 1.3 9 56.8ab 0.5 13 7.1b 0.6 13
N=133 oczd cxmoo 80 90 100 Mass (kg) N=125 O QD2) 0<ZD OO O 5 10 15 Body Fat (%) CO o <o o CN o o o qd
o
oamaMjasssmsnD oo c N=140 ooaffnannnx) oo 52 54 56 58 60Hind Foot Length (cm) o oo o ¥ i °-B 0 to 05 O) . Q_ O <N d o d
Age (years) Number of Warbles Popuiati on Size
Figure 3. Logistic regressions of the probability of gestation according to body condition indices and population size for Riviere-George caribou females aged 3 to 16 years collected in spring of 1980, 1984, 1986, 1987 and 2002. Regressions predicting presence (1) or absence of foetus (0) for (A) mass, (B) percentage of body fat and (F) population size were significant. Regressions for (C) hind foot length and (D) age were not significant. Logistic regression of (E) the number of warbles was significant (solid line) but became marginally insignificant after removing the female with the highest warble count (dotted line). Raw data (points) are shown,
Table 2. Model selection based on second order Akaike's information criterion corrected for small sample size (AICc) for the determinants of gestation in adult female migratory caribou of the Riviere-George herd in spring (March and April) 1980, 1984, 1986, 1987 and 2002. Models include 115 known-age individuals with all morphological measurements including mass (mass), percent body fat adjusted to March 23 (bodyfatC) and hind foot length (hflT). Population size (popest), and interactions denoted by asterisk (*) were also included in models along with a model containing no explanatory variables (null model). Models are listed in rank order with the 6 best models, with AICc values that do not differ by more than 2, in bold. Number of estimated parameters (k), change in AIC from lowest AICc value (AAICc), and cumulative weight of model (Cum. Wt) based on the likelihood that that model is the best model (LL) are presented.
Model K AICc AAICc AlCcWt Cum.Wt LL
mass+hfiT 3 60.64 0 0.19 0.19 -27.21 mass 2 61.14 0.5 0.15 0.34 -28.52 age+mass+hflT+bodyfatC 5 61.4 0.76 0.13 0.48 -25.42 mass+bodyfatC 3 61.59 0.95 0.12 0.6 -27.69 mass+hflT+bodyfatC 4 61.74 1.1 0.11 0.71 -26.69 popest+mass 3 62.49 1.85 0.08 0.79 -28.14 mass+age 3 62.51 1.87 0.08 0.86 -28.15 age+mass+h flT+bodyfatC+popest 6 62.67 2.03 0.07 0.93 -24.95 popest*mass 4 63.64 3 0.04 0.97 -27.64 bodyfatC+age 3 65.43 4.8 0.02 0.99 -29.61 popest+bodyfatC 3 68.13 7.49 0 1 -30.96 popest*bodyfatC 4 70.17 9.54 0 1 -30.9 bodyfatC 2 70.92 10.28 0 1 -33.41 hflT+bodyfatC 3 72.97 12.34 0 1 -33.38 popest 2 74.86 14.22 0 1 -35.37 popest*age 4 75.91 15.27 0 1 -33.77 age 2 76.82 16.18 0 1 -36.36 popest+hflT 3 76.87 16.24 0 1 -35.33 popest*hflT 4 77.52 16.89 0 1 -34.58 null 1 78.98 18.34 0 1 -38.47 hflT 2 81.05 20.41 0 1 -38.47
Table 3. Model averaged parameter estimates, standard error (se) and 95% confidence intervals (CI) for variables from the 6 competing models from Table 2 for the determinants of gestation in adult female migratory caribou of the Riviere-George herd in spring (March and April) 1980, 1984, 1986, 1987 and 2002. Models included 115 known age individuals with all morphological measurements including mass (mass), percent body fat adjusted to March 23 (bodyfatC), hind foot length (hflT) and population size (popest).
variables estimate se CI low CI high Significant
mass 0.15 0.07 0.01 0.3 YES
hflT -0.42 0.28 -0.97 0.13 NO
bodyfatC 0.25 0.19 -0.3 0.62 NO
age 0.31 0.25 -0.18 0.81 NO
popest 0 0 0 0 NO
When body fat was not considered, the best model explaining gestation in adult females included hind foot length and mass (Table 4; AIC=67.3, and AIC>69.7 for all other models). The relationship between mass and probability of gestation remained positive for mass (0.22 ± 0.07, CI: 0.09 to 0.34, Figure 4) but the effect of hind foot length became negative once mass was controlled (-0.58 ± 0.26, CI: -1.1 to -0.07, Figure 4). The model containing both hind foot length and mass explained 31% of the variation, 8.5% more than mass alone. To have a 50% chance of pregnancy, females had to be ~76kg in spring. However, females of a given mass were ~5% less likely to be pregnant if their hind foot length was ~4 cm larger.
DISCUSSION
Fecundity-condition relationships seen in other caribou herds were mainly confirmed in the Riviere-George. Mass and percent body fat positively affected gestation rates and there was no effect of age. High warble infection was associated with a reduced probability of pregnancy in
Table 4. Model selection based on second order Akaike's information criterion corrected for small sample size (AICc) for the determinants of gestation in adult female migratory caribou of the Riviere-George herd in spring (March and April) 1980, 1984, 1986, 1987 and 2002. Models include 131 known age individuals with measured mass (mass) and hind foot length (hflT). Population size (popest) and interactions denoted by asterisk (*) were also included in models. Models are listed in ranked order with the best model in bold. Number of estimated parameters (k), change in AIC from lowest AICc value (AAICc), and cumulative weight of model (Cum. Wt) based on the likelihood that that model is the best model (LL) are presented.
Model K AICc AAICc AlCcWt Cum.Wt LL
mass+hflT 3 67.26 0 0.72 0.72 -30.53 mass 2 70.96 3.7 0.11 0.83 -33.43 mass+age 3 71.68 4.43 0.08 0.91 -32.75 popest+mass 3 72.11 4.85 0.06 0.97 -32.96 popest*mass 4 73.84 6.58 0.03 1 -32.76 popest+age 3 93.38 26.12 0 1 -43.59 age 2 94.64 27.39 0 1 -45.27 popest 2 94.96 27.7 0 1 -45.43 popest*age 4 95.09 27.84 0 1 -43.39 hflT+age 3 96.55 29.29 0 1 -45.18 popest+hflT 3 96.71 29.45 0 1 -45.26 popest*hflT 4 98.65 31.39 0 1 -45.17 1 1 99.28 32.02 0 1 -48.62 hflT 2 101.26 34 0 1 -48.58
Population size negatively affected the proportion of females that were pregnant but contrary to our second hypothesis, threshold mass and body fat necessary for gestation did not vary with population size, suggesting that females did not adopt a conservative reproductive strategy when resources were scarce. Productivity of this herd remained high but was reduced by smaller mass at high population size.
o CO d o CD d m d 60 54 58 52 56 o •2 S CO a> CD ^
sr °
CD O m o 70 SO 90 100 110Mass (kg) Hind Foot Length (cm)
Figure 4. Model predictions, from best model with 131 individuals selected using AICc in Table 4, of gestation in relation to mass in April and May at average hind foot length (left panel), and in relation to hind foot length at average mass (right panel) for adult female caribou of the Riviere-George herd in 1980, 1984, 1986, 1987 and 2002.
Condition-Fecundity Relationships
As seen in other caribou herds, both mass and fat were important determinants of fecundity (Adams and Dale, 1998; Cameron et al., 1993; Dauphine and McClure, 1974; Russell et al., 1998; Thomas, 1982). Although it has been proposed that a critical level of mass and fat are needed for caribou to conceive (Crete et al., 1993), we did not observe a sharp threshold. A threshold may have existed during autumn when ovulation occurred but did not persist until spring. We did not detect an effect of age on the probability of gestation. Congruent with results from the Porcupine caribou herd (Gerhart et al., 1997), hind foot length in simple logistic regressions did not affect the probability of gestation; its negative effect after accounting for body mass suggests that caribou with relatively fewer body reserves were less