HAL Id: hal-00738501
https://hal.inria.fr/hal-00738501
Submitted on 4 Oct 2012
HAL is a multi-disciplinary open access
archive for the deposit and dissemination of sci-entific research documents, whether they are pub-lished or not. The documents may come from teaching and research institutions in France or abroad, or from public or private research centers.
L’archive ouverte pluridisciplinaire HAL, est destinée au dépôt et à la diffusion de documents scientifiques de niveau recherche, publiés ou non, émanant des établissements d’enseignement et de recherche français ou étrangers, des laboratoires publics ou privés.
the period March to August 2011
Ian Rowlands, David Clark, Hamid Jamali, David Nicholas
To cite this version:
Ian Rowlands, David Clark, Hamid Jamali, David Nicholas. PEER D5.2 USAGE STUDY Descriptive statistics for the period March to August 2011. [Technical Report] 2012, pp.45. �hal-00738501�
1
ECP-2007-DILI-537003
PEER
PEER USAGE STUDY
Descriptive statistics for the period
March to August 2011
Deliverable number/name D5.2
Dissemination level Public
Delivery date 18 June 2012
Status Final
Author(s) CIBER Research Ltd
eContentplus
This project is funded under the eContentplus programme1,
a multiannual Community programme to make digital content in Europe more accessible, usable and exploitable
1 OJ L 79, 24.3.2005, p. 1.
PEER USAGE STUDY
Descriptive statistics for the period March to August 2011
Dr Ian Rowlands (University of Leicester), Dr David Clark (CIBER Research Limited),
Dr Hamid Jamali (Kharazmi University, Tehran) and Professor David Nicholas (CIBER
Research Limited)
FINAL REPORT
2 PEER USAGE STUDY
Table of contents
EXECUTIVE SUMMARY 5
INTRODUCTION 7
AIMS AND OBJECTIVES 7
RESEARCH DESIGN 8
The PEER production process 8
The nature of the sample 9
A note on experimental control 11
FINDINGS 14
Commercial impact of Green open access 14
Effects of embargo periods 17
Impact of the PEER intervention 20
Usage correlations 28
Comparison of publisher and repository take-‐up rates 29
LIMITATIONS AND FURTHER RESEARCH 36
REFERENCES 38
ANNEX 1: PROFILE OF PEER CONTENT 39
ANNEX 2: TRENDS IN PEER USAGE BY SUBJECT 41
3 PEER USAGE STUDY
List of tables
1 Publisher and repository downloads by month 17
2 Repository downloads as a percentage of publisher downloads by subject 17
3 Repository and publisher downloads by embargo period 19
4 Repository downloads as a percentage of publisher downloads by embargo period 19
5 Full text downloads: PEER repositories and publisher sites 20
6 Before and after the PEER intervention: paired sample t-‐tests 20
7 Ratio statistics by broad subject 21
8 Ratio statistics by journal impact tertile 22
9 Ratio statistics by publication year 23
10 Ratio statistics by embargo period 24
11 Ratio statistics by months since first online publication 25
12 Ratio statistics by language of article 26
13 Ratio statistics by lead author status 27
14 Correlation between repository and publisher downloads 28
15 Publisher take-‐up by broad subject 29
16 Repository take-‐up by broad subject 29
17 Publisher take-‐up by journal impact tertile 30
18 Repository take-‐up by journal impact tertile 30
19 Publisher take-‐up by publication year 31
20 Repository take-‐up by publication year 32
21 Publisher take-‐up by embargo period 33
22 Repository take-‐up by embargo period 33
23 Publisher take-‐up by age of article 34
24 Repository take-‐up by age of article 35
25 Number of PEER preprints by deposit mechanism 38
26 Number of PEER preprints by language 38
27 Number of PEER preprints by subject 38
28 Number of PEER preprints by impact factor tertile 38
29 Number of PEER preprints by publication year 38
30 Number of PEER preprints by embargo period 39
31 Number of PEER preprints by lead author status 39
32 Number of PEER preprints by publisher 39
4 PEER USAGE STUDY
List of figures
1 PEER production processes 8
2 Broad overview of the Phase I research design 9
3 Detailed overview of the Phase I research design 9
4 Age profile of live PEER materials 10
5 Polysynchronous research design 11
6 The PEER experiment in the wider environment 12
7 Experimental assumptions and limitations 13
8 Aggregate use of all PEER content on the publisher and repository platforms 14
9 Cumulated full text downloads in all subjects 15
10 Relative performance of PEER repositories 16
11 Cumulated publisher downloads by age of article and broad subject 18
12 Ratio statistics by broad subject 22
13 Ratio statistics by journal impact tertile 23
14 Ratio statistics by publication year 24
15 Ratio statistics by embargo period 25
16 Ratio statistics by age of article in months since first online publication 26
17 Ratio statistics by language of article 27
18 Ratio statistics by lead author status 28
19 Repository take-‐up by broad subject 30
20 Repository take-‐up by journal impact tertile 31
21 Repository take-‐up by publication year 32
22 Repository take-‐up by embargo period 34
23 Repository take-‐up by age of article (months since first online publication) 35
24 Monthly full text downloads in the life sciences 40
25 Cumulated full text downloads in the life sciences 40
26 Monthly full text downloads in medicine 41
27 Cumulated full text downloads in medicine 41
28 Monthly full text downloads in the physical sciences 42
29 Cumulated full text downloads in the physical sciences 42
30 Monthly full text downloads in the social sciences and humanities 43
31 Cumulated full text downloads in the social sciences and humanities 43
5 PEER USAGE STUDY
EXECUTIVE SUMMARY
This study compares numbers of full text downloads of preprints from PEER
repositories with downloads of the equivalent version of record at the publisher’s
web site over a six-‐month period, March to August 2011.
The key points to emerge are
• Overall, full text downloads are currently growing in a linear cumulative
fashion for both PEER repositories and publishers. Publisher downloads are
growing at a faster rate than repository downloads and it seems unlikely that
the gap will close in the medium to short term. As a consequence, PEER’s
share of the combined PEER-‐publisher download market is likely to decline
gradually. It is unlikely that PEER has had a large or significant impact on
publisher downloads at the global level (p.15).
• The relative popularity of PEER, as measured by full text downloads as a
proportion of publisher downloads reveals considerable variation between
publishers, for reasons that are not yet clear. Over the 6-‐month period, PEER
usage stood at 11.5 per cent of publisher usage, but the figures for individual
publishers ranged between 2.0 and 24.0 per cent (p.17).
• PEER content in the social sciences, humanities and physical sciences is
significantly more popular than content in medicine and the life sciences
(p.17).
• An analysis of cumulated full text downloads by age of article (months since
first online publication) shows that articles continue to accumulate over a
long period and that an 18-‐month window represents only a small proportion
of lifetime use in all four subjects studied (p.18).
• PEER is at an early stage in its development to inject critical mass into the
project, a substantial backfill of content was entered during 2011. This makes
it difficult to interpret the findings in relation to embargo periods, but there
are indications that currency may not be such a critical issue for PEER users
compared with visitors to publisher sites (p.19). More work is needed on a
more stable set of data.
• An analysis of publisher:repository downloads shows that users tend to
strongly prefer the publisher site for more recent content. This may have
something to do with user expectations or the way sites are designed, since
we are comparing articles on a like-‐for-‐like basis (p.8).
6 PEER USAGE STUDY
• In broad terms, article-‐level usage correlates positively and significantly across
the publisher-‐repository divide. Articles that are popular on the one, tend
also to be popular on the other but the correlation coefficients are modest,
especially in the life sciences and in medicine and so there is strong possibility
that different kinds of information behavior are taking place on the different
platforms (p.28).
• During the six months March through August 2011, almost every single article
(99.0 per cent) of those was downloaded at least once from the relevant
publisher website. So was a very large majority, 73.6 per cent, from a PEER
repository. The scholarly literature is under heavy scrutiny (p.29).
7 PEER USAGE STUDY
INTRODUCTION
This report explores the use of PEER preprints over the six months of March to August 2011 and relates this activity to the use of the version of record on the publishers’ web sites. Nine publishers are featured in this study: BMJ Group, Elsevier, Institute of Physics Publishing, Nature, Oxford University Press, Portland Press, Sage, Springer and Wiley-‐Blackwell. For various technical and logistic reasons, data from EDP Sciences and from Taylor & Francis is unavailable for this report. The report outlines the research design for this first phase of the PEER usage study and presents a range of statistical descriptions and tests. The early body of the report compares the emerging evidence so far with the research aims and objectives of the project. A detailed statistical appendix then follows, showing the richness of the data that has been compiled as well as pointing to some of the limitations of that data. This is particularly important at this early stage where numbers and time windows are fairly restricted. The report also looks forward to the second phase of the study where a randomised controlled trial (RCT) will supplement the basic descriptive data presented here, and provide tighter experimental control.
AIMS AND OBJECTIVES
The research aims and objectives for the usage strand of the PEER programme follow. This report addresses the following questions:
What is the `commercial’ impact (if any) of Green open access?
Does PEER impact on the use of Stage III articles on publisher platforms? If so, what are the relative effects of:
• publisher deposit (PEER `publisher deposit’ model) • voluntary self-‐archiving (PEER `author deposit’ model)
What are the effects of embargo periods, if any?
Is there any relationship between length of embargo and use of PEER preprints articles in different subject areas?
What are the key drivers of repository usage?
To what extent, if at all, do journal origin, impact factor, date of official publication and other factors impact upon repository usage and information-‐seeking behaviour?
8 PEER USAGE STUDY
RESEARCH DESIGN
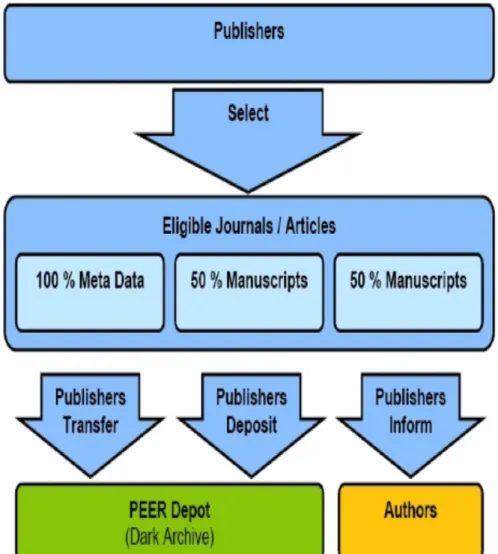
The PEER production processFigure 1 outlines the production processes by which materials are transferred from participating publishers to the PEER Depot and from there made available through a number of open access repositories. A detailed description can be found in Wallace (2011).
Figure 1: PEER production processes
The most important point for someone coming to PEER usage findings for the first time is that the experiment deals with a subset of the global literature: only articles, not other document types such as letters, errata or editorial matter, with at least one EU-‐27 author are ingested into the PEER Depot. The production model has two content supply streams: preprints (Stage II) materials that are deposited automatically by the publishers (100 per cent of EU-‐27 content in selected journals) and those which are voluntarily deposited by the author following a prompt to participate in the PEER experiment.
9 PEER USAGE STUDY
The nature of the sample
This production process generates two sets of experimental content (Figure 2) which crudely map onto the status quo (voluntary author deposit) and onto a hypothetical future scenario based on comprehensive deposit facilitated by publishers themselves.
Figure 2: Broad overview of the Phase I research design
In the original design for the PEER usage study, we had a third group of control articles, comprising preprint materials from a carefully matched set of titles that were not ingested into the PEER Depot as in Figure 1 and were thus independent of the PEER experiment. This control group has not been used in this report for reasons that will be discussed in a few moments in relation to the second phase of the study.
A more detailed overview of the structure of the PEER data sets that CIBER has worked with is given below.
Figure 3: Detailed overview of the Phase I research design
10 PEER USAGE STUDY
As a mini `experiment within an experiment’ two titles1 were selected to model the extreme case were all Stage II preprint content to be available (a `global mandate’) through institutional or other repositories, regardless of the geographic origin of the authors. This is represented above as subsets c and g.
The data presented in this first report relate to subsets b, c, f and g only since there were so few occurrences of voluntary submission within the time window. Looking at the PEER metadata more generally, levels of author submission so far have been too low to warrant any further statistically-‐ based research.
In framing how to structure the samples that would form the basis of the Phase I experiment, a further consideration needed to be thought through: that of timing. The pipe that feeds the PEER Depot comprises material of different ages (from the date of first online publication) and with different embargo periods. So what flows in is a mixed set in terms of age and embargo status. This is not a problem in itself except that efforts to establish critical mass have meant that substantial backfill activity has had to take place, leading to a sample whose temporal characteristics are really not representative of the state that would eventually be obtained were PEER to continue for an extended period and settle down into a natural rhythm (Figure 4).
Figure 4: Age profile of live PEER materials Numbers of articles, March 2011 to August 2011
The sample is particularly weak in relation to articles aged 3-‐10 months. For this report, we consider all PEER material that was ingested and exposed to the outside world by 1 March 2011 and track its use over the following six-‐months. This means we have a standard usage window and a mixture of publication ages and embargo expiries, as indicated in Figure 5.
1
11 PEER USAGE STUDY
Figure 5: Polysynchronous research design
Substantial backfill is not a normal situation in journal publishing, and this means that a great deal of caution needs to be applied: the findings may not be generalisable outside of this specific context.
A note on experimental control
It is important in any communication regarding PEER usage findings to be clear about the specific aims (and limitations) of the experimental design. The specific aim is to model the impacts, if any, of the large-‐scale deposit of EU-‐27 authored materials. It is not an experiment with wider ambitions to model the impact of Green open access more generally. The question is whether PEER itself made a difference?
The overall environment within which PEER is operating is extraordinarily complex and there are now many routes to discovering and accessing scholarly content. Some authors are almost certainly posting PEER-‐equivalent materials on their personal or departmental web sites, or depositing them in other non-‐PEER repositories, and this creates an uncertain background of noise which we have to accept as an experimental limitation, because it is simply not practical to develop robots to track all non-‐PEER open access incidences. Davis and others attempted this in their 2008 paper but on a very much smaller sample of articles (1,379) and it was clear that the practical issues invoked (crucially around manually identifying false positives) meant that this was not a scalable option for PEER.
The PEER experiment took place in real time in the real world and is thus subject to considerable external noise. Figure 6 shows some the most obvious known unknowns that surround the PEER set up.
12 PEER USAGE STUDY
Figure 6: The PEER experiment in the wider environment
Other shifts in the scholarly discovery landscape are also likely to have impinged on the PEER experiment: decisions about Google and Google Scholar indexing, for example, and the rise of powerful third party gateway services like PubMed and arXiv are certain to affect usage of materials on the publishers’ platforms and to do so differentially over time. Even the way that log data events are recorded over time may change and add further uncertainty. The key message is that longitudinal trends have to be treated with a caution since noise affects both sides of the equation (publisher and repository use) and in ways that are almost impossible to completely pin down.
Experimental control is obviously of major importance to the credibility of what PEER communicates to the outside world and we are tackling this issue in a subsequent report using a randomised controlled trial (RCT) following the example of Davis and others (2008) and Snijder (2010). This has many tactical advantages, the most important being that (a) we compare like with like, control is imposed from within the journal sets being considered, not from other journals with different characteristics, (b) control can be exercised within a very limited time span, even one month, rather than making comparisons across several years (a point that will be discussed later in this report), and (c) we have a full set of PEER metadata for both control and experimental articles. For these reasons, we have not used the list of control journals for this report. The difficulties of using them should become clear as we look at the first set of findings.
13 PEER USAGE STUDY
In summary, Figure 7 sets out the key assumptions, constraints and limitations of this study. We believe these are typical of the challenges facing scholarly communications researchers but that they will be helpful in guiding the reader of this report to a properly balanced conclusion on what can and what cannot be achieved in action research.
Figure 7: Experimental assumptions and limitations
Key assumptions
Full text downloads are a meaningful proxy for understanding the usage of scholarly materials.
A 6-‐month timeframe is a reasonable compromise for a usage study of this nature. It is long enough to allow a substantial amount of data to accumulate, but not so long that the external environment may changed out of all recognition by the end.
Key limitations
Delays in the implementation of PEER mean that the experimental sample is not fully representative of a steady state of PEER ingestion and release. It is limited in respect of newer materials (3-‐10 months post embargo) and materials with embargo periods greater than 18 months.
This study took place in the real world, in real time and against a background of noise and turbulence in the external environment. These factors are not easily measured and may play out differentially on the various actors involved, there is simply no way of telling.
PEER has unique characteristics that mean that it is not advisable to extrapolate from the findings presented here to make claims about green open access more generally. Generalisations should only be made based on the evaluation and triangulation of a critical mass of studies with similar objectives.
14 PEER USAGE STUDY
FINDINGS
Commercial impact of Green open access
In this first section of the findings we address the question ‘Does PEER impact on the use of the versions of record available from the publishers’ platforms?’
And, if so, what are the relative effects of:
• publisher deposit (PEER `publisher deposit’ model) • voluntary self-‐archiving (PEER `author deposit’ model)
Since there were very few incidences of voluntary self-‐archiving in the data set under consideration here (less than 0.2 per cent of deposits), we will focus on any evidence of the impact of PEER deposit on usage at the publishers’ web sites. We are unable to say anything about voluntary self-‐archiving except that it barely registered, for whatever reasons.
In Figure 8, we show aggregate use across all four subject areas and nine publishers over a 24-‐ month period to get a sense of the bigger picture.
Figure 8: Aggregate use of all PEER content on publisher and repository platforms Numbers of full text downloads for publisher web sites and PEER repositories, March 2010 to February 2012
Several important points arise from this high-‐level overview. Use is clearly seasonal, following the patterns of the scholarly calendar. As we move across the chart from left to right, we see a gradual and reasonably steady increase in PEER downloads from a base of negligible content (March 2010). If we compare publisher downloads on a monthly like-‐for-‐like basis (say comparing June 2010 with June 2011) we find a very inconsistent picture emerging with publisher downloads generally up in 2011 on the 2010 figures up until August, and from then on down.
15 PEER USAGE STUDY
Equivalent charts for the individual subject areas (life sciences, medicine, physical sciences, and social sciences and humanities) can be found in the annex as Figures 24 to 31 and they make any clear interpretation even more difficult to establish. We know from previous studies that usage data is highly volatile and so a much longer time period is really needed to see what is really going on.
It may be instructive to look another view of this same data: this time cumulating publisher and PEER repository downloads over the full period (Figure 9).
Figure 9: Cumulated full text downloads in all subjects Numbers for publisher web sites and PEER repositories, March 2010 to February 2012
Publisher traffic is growing cumulatively in a strongly linear fashion (linear R2=0.99) and at a faster rate than PEER traffic (also strongly linear, R2=0.94). As a result, it must be concluded, on the basis of current trends at least, that PEER’s share of the combined publisher-‐PEER download market is likely to decline, at least in the short to medium term. It should be borne in mind however that earlier part of the graph represents very low PEER critical mass since progress to populate the repositories with content was slower than anticipated.
The next chart plots the ratio of publisher to PEER repository full text downloads over the most recent twelve-‐month set of figures available. The higher the ratio, the greater the `preference’ of users to access full text from the publishers’ web site rather than a PEER repository and of course, vice versa.
16 PEER USAGE STUDY
Figure 10: Relative performance of PEER repositories Ratios of publisher to repository downloads, March 2011 to February 2012 (database level)
Users in the social sciences and humanities and the physical sciences are considerably more `PEER-‐ friendly’ on the basis of this metric than those in the life sciences and medicine, perhaps because of the greater value attached to the final version of record in these disciplines.
The key question, which this six-‐month report is unable to settle, is whether these PEER downloads are in addition to the publishers’ offerings and growing the overall market for scholarly information, or whether they are substitutes? The combined weight of evidence here is more suggestive of an additive rather than a competitive effect but these issues will be teased out in greater detail in the report on the randomised control trial (RCT) that follows this one.
CIBER holds the underlying data for this experiment in a large spreadsheet-‐like package, where the rows correspond to articles and the columns to values associated with those articles (e.g. numbers of repository downloads in March 2011). As might be expected, a large number of cells contain zero downloads either on the publisher or repository columns, or both. Since it is impossible to divide by zero, we have something of an issue defining repository-‐publisher ratios: depending on the level of aggregation and how the data are collapsed into bigger categories (article-‐level, journal-‐level, database-‐level) we get different values. Figure 10 above shows download ratios aggregated at the database level and the trends appear to be converging at a level of repository use approximately one eighth of that going to the publishers. It is too early to be clear whether PEER usage really is converging this way, especially given the highly seasonable nature of scholarly consumption.
17 PEER USAGE STUDY
It seems more appropriate when focusing on individual publishers to aggregate the ratios at the journal level, and this is what we see in Table 1.
There is considerable variation between publishers in the range 2.0% (CI95 1.8% to 2.3%) for Publisher E to 24.0% (CI95 23.5% to 24.6%) for Publisher G. A more detailed analysis and further research is needed to work out what is going on. We may be looking at an artifact of the backfill here, with age of articles being a confounding factor.
Table 1: Publisher and repository downloads by month (journal-‐level analysis) PEER full text downloads as a percentage of publisher downloads, March 2010 to August 2011 (n=14,292 articles)
Articles Mean 95% confidence intervals
low high Publisher A 781 7.8 7.7 7.9 Publisher B 4,809 11.9 11.7 12.0 Publisher C 981 3.9 3.8 4.0 Publisher D 630 4.6 4.5 4.8 Publisher E 110 2.0 1.8 2.3 Publisher F 1,292 11.3 10.6 12.1 Publisher G 1,469 24.0 23.5 24.6 Publisher H 2,690 6.5 6.3 6.7 Publisher I 1,529 17.9 14.0 21.9 All publishers 14,291 11.5 11.1 12.0
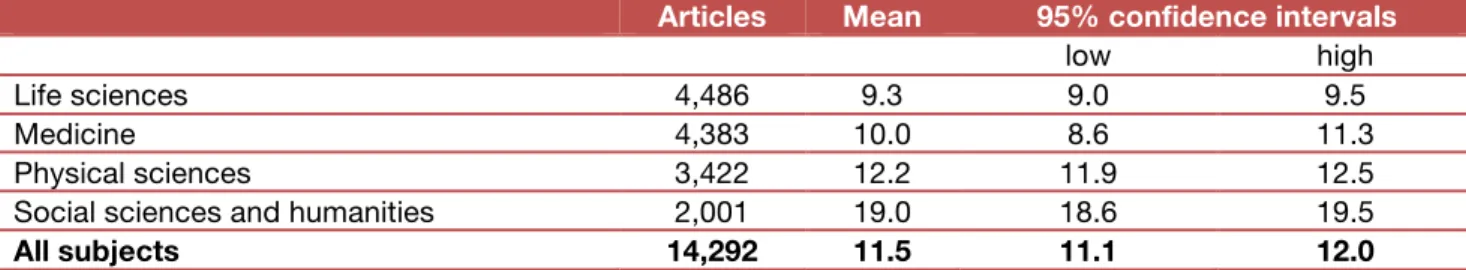
Cutting the same data by subject in Table 2, we can see that subject content is a major source of variation, with social science and humanities materials proving to be relatively more popular for PEER users than materials in the sciences. Again, this prompts the need for further investigation.
Table 2: Repository downloads as a percentage of publisher downloads by subject (subject level analysis) Numbers of articles and repository downloads expressed as a percentage of publisher downloads with 95% confidence intervals
Articles Mean 95% confidence intervals
low high
Life sciences 4,486 9.3 9.0 9.5
Medicine 4,383 10.0 8.6 11.3
Physical sciences 3,422 12.2 11.9 12.5
Social sciences and humanities 2,001 19.0 18.6 19.5
All subjects 14,292 11.5 11.1 12.0
Effects of embargo periods
In this section we address the question ‘Is there any relationship between length of embargo and the use of PEER preprints in different subject areas?’
Quantifying any possible effects of the length of embargo periods on repository usage is an issue of concern to the whole community because it speaks to the fundamental question as to whether repositories co-‐exist or compete with publishers’ offerings? (Beckett and Inger 2007).
Probably the best way to approach this question is to look at the age profile of downloads from
the publishers’ sites to get a sense of the point at which interest begins to wane, without the
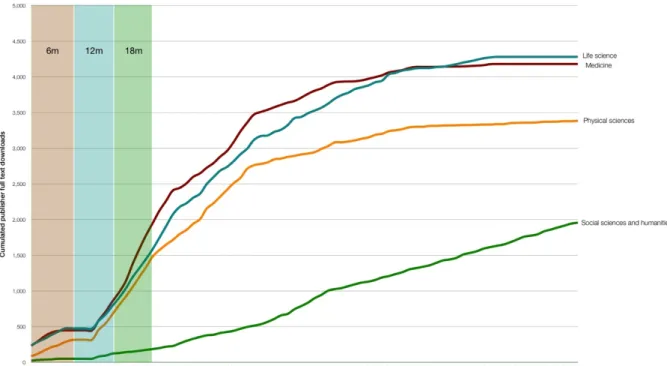
confounding factor of embargo periods to confuse the picture. In Figure 11 we analyse publisher downloads of PEER experimental articles over the period March to August 2011. We see cumulated numbers of downloads to the various publisher platforms on the vertical axis during
18 PEER USAGE STUDY
the period. The four broad subjects are picked out as different coloured lines and it is immediately obvious that they reveal different patterns of use. The horizontal axis represents the age of the articles downloaded (in months since first online publication) and the evident kinks round about month 8 show the effects of materials being released from their embargo periods. The results are broken down by subject.
Figure 11: Cumulated publisher downloads by age of article and broad subject Numbers of full text downloads over the period March to August 2011
It is clear that publisher downloads accumulate over a long period and that usage within the first 18 months represents a small proportion of lifetime use.
The way that PEER is set up is that there is a mixture of articles with varying lengths of embargo, from zero to 36 months. So far, there are very few articles with long embargoes (24-‐ or 36-‐ months) that have had time to mature and go live in PEER, so these are excluded from Table 9 below. Similarly, 3-‐ and 5-‐month embargoes are sparsely represented. Combined with the backfill issue, this makes it difficult to make reliable claims about the impact of embargo periods on PEER use. There is really no substitute for PEER reaching a steady state of ingestion in order to really test this.
In the case of embargo=0 months, there is no disadvantage to PEER users over visitors to the publisher’s website, so it seems reasonable to index subsequent downloads against this benchmark. The data in Table 3 suggests that as far as PEER users are concerned, currency is possibly not of the utmost importance. Downloads for articles immediately available are not noticeably different from those where the user has to wait 6 or 12 months before accessing the material. If currency were a critical factor, one would expect the levels of use at 6-‐ and 12-‐months to be considerably lower. This may well be a case of conditioning: repository users may not expect to find the same level of currency as they do on the publishers’ platform. As always, information
19 PEER USAGE STUDY
behaviour may also be conditioned by the features available on the websites: there may not be much volition, people are taken where they are taken by the machine.
Table 3: Repository and publisher downloads by embargo period Full text downloads and downloads indexed against no embargo
Repository downloads Publisher downloads
Downloads Index Downloads Index
No embargo 25,332 100 149,040 100
6 months 23,384 93 476,978 320
12 months 26,432 104 363,350 244
18 months 8,364 33 66,263 45
The publisher data in Table 3 shows a different story, and content retains very significant value over the first 12 months before decline begins to set in.
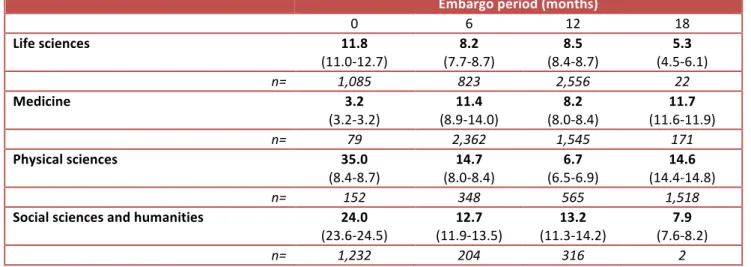
Looking at PEER downloads as a percentage of publisher downloads by subject (journal-‐level analysis) we find that PEER is highly popular for short embargo materials in the physical sciences and in the social sciences and humanities following by what appears to be a steady migration in favour of publisher content. In medicine, there is much less variation by embargo period and this really needs further investigation. As can be seen in the table, some of the cells represent low numbers of articles (n) and this is certainly an issue.
Table 4: Repository downloads as a percentage of publisher downloads by embargo period Numbers of articles and repository downloads expressed as a percentage of publisher downloads with 95% confidence intervals
Embargo period (months)
0 6 12 18 Life sciences 11.8 (11.0-‐12.7) (7.7-‐8.7) 8.2 (8.4-‐8.7) 8.5 (4.5-‐6.1) 5.3 n= 1,085 823 2,556 22 Medicine 3.2 (3.2-‐3.2) (8.9-‐14.0) 11.4 (8.0-‐8.4) 8.2 (11.6-‐11.9) 11.7 n= 79 2,362 1,545 171 Physical sciences 35.0 (8.4-‐8.7) (8.0-‐8.4) 14.7 (6.5-‐6.9) 6.7 (14.4-‐14.8) 14.6 n= 152 348 565 1,518
Social sciences and humanities 24.0
(23.6-‐24.5) (11.9-‐13.5) 12.7 (11.3-‐14.2) 13.2 (7.6-‐8.2) 7.9
n= 1,232 204 316 2
The evidence above data may have another implication which is related to the concept of information obsolescence. It is well understood from citation studies that the value of information content wanes with age, but at different rates in different disciplines. This has led to the development of concepts such as the half-‐life, or the median age (usually expressed in years), of citations to a particular set of articles, such as a journal or a field. Empirical data concerning the obsolescence of article usage is much more limited, the result of our ability only recently to map decreasing usage using full text downloads as a proxy measure.
20 PEER USAGE STUDY Impact of the PEER intervention
The final question we address is that ‘To what extent, if at all, do journal origin, impact factor, date of official publication and other factors impact upon repository usage and information-‐seeking behaviour?’
To answer this question we have carried out two sets of analysis. The first set looks at the usage before and after PEER intervention and presents ratio statistics. The second set of analysis looks at the the comparative take-‐up rates of publishers and repository.
An important question about the impact of the PEER is whether its usage is wholly complementary to what the publishers are offering – and so growing the market for scholarly information, or whether it is competitive? Or, more likely, a bit of both. Further clues as the nature and extent of these dynamics will emerge from the findings of the randomised control trial, but the descriptive evidence tends to suggests that PEER is complementary in net terms to the formal system.
In Table 5, we compare two 6-‐month periods: March-‐August 2010 and 2011. 2010 represents a very early point in the development of PEER content, before the Big Wave had kicked in and at a time when there was little use of PEER. Of course, a better benchmark would have been when repository use was zero, but we do not have access to a full set of publisher log data for 2009 and, in any case, that is going back a very long way in internet terms.
Table 5: Full text downloads: PEER repositories and publisher sites Numbers of full text downloads, March -‐August 2010 (`before’) and March -‐ August 2011 (`after’)
Before After
Repositories Publishers Repositories Publishers
Life sciences 5,125 263,513 28,407 425,572
Medicine 3,686 201,213 23,019 431,659
Physical sciences 2,229 164,200 17,312 172,793
Social sciences and humanities 2,021 122,439 22,320 136,843
All broad subjects 13,061 751,365 91,058 1,166,867
The message from Table 5 is that after the Big Wave, publisher use increased in absolute terms all four subject areas, `despite’ PEER.
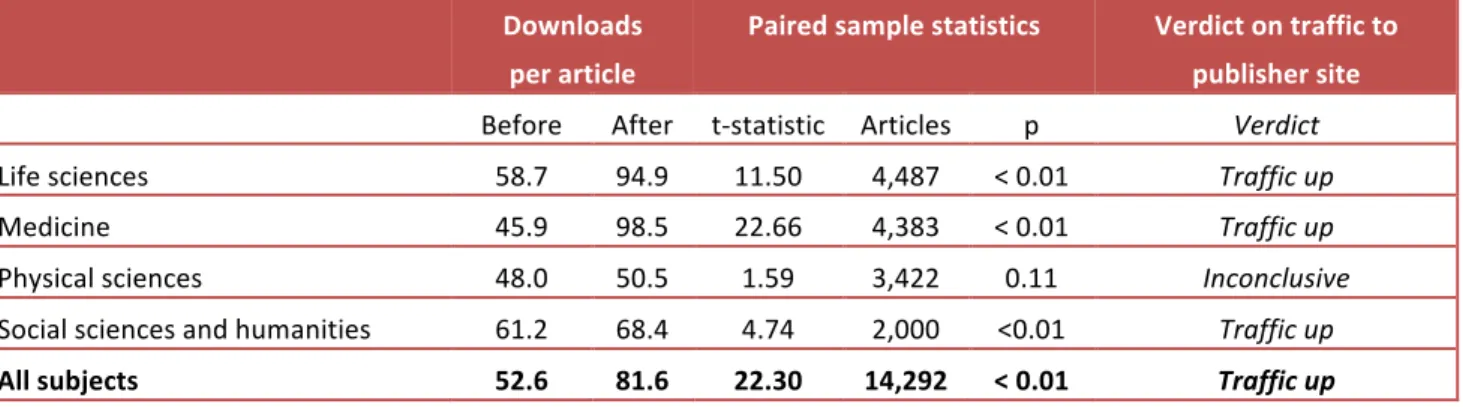
A paired sample t-‐test (Table 6) confirms that publisher downloads increased overall in relative terms as well as in absolute numbers. Downloads per article increased in all four subjects, although in the physical sciences, that increase was not statistically significant.
Table 6: Before and after PEER intervention: paired sample t-‐tests
Mean full text downloads per article on the publisher’s site, and test statistics, March -‐August 2010 (`before’) and March -‐August 2011 (`after’)
Downloads
per article
Paired sample statistics Verdict on traffic to publisher site
Before After t-‐statistic Articles p Verdict
Life sciences 58.7 94.9 11.50 4,487 < 0.01 Traffic up
Medicine 45.9 98.5 22.66 4,383 < 0.01 Traffic up
Physical sciences 48.0 50.5 1.59 3,422 0.11 Inconclusive
Social sciences and humanities 61.2 68.4 4.74 2,000 <0.01 Traffic up
21 PEER USAGE STUDY
The following sub-‐sections offers further analysis using a variant of the ratio statistic introduced earlier. This time the ratio of publisher to repository downloads within the time window of March to August 2011.
This statistic needs to be treated with caution given the difficulties in interpreting longitudinal data in a complex and fast moving scholarly information environment. Since it is a ratio it is sensitive both to the numerator (changes in usage on the publisher platform) and, especially, the denominator: PEER downloads which for the period reported here are relatively small. For this reason, 95 per cent confidence intervals are provided around the mean.
Usage patterns at the article level are very highly skewed, with most articles being used once or only a few times, and a small number very frequently: they typically follow a log-‐normal distribution rather than the familiar bell curve. This is the case for both the PEER and publisher usage data examined in this report. In order to create a meaningful average, the download data were transformed into natural logs, and this gives a very reasonable approximation of a normal bell-‐shaped distribution and facilitates the legitimate use of the statistical test used here: a one-‐ way Analysis of Variance (ANOVA).
By subject
This more formal analysis confirms the picture developed in Table 6, that users in the physical sciences and in the social sciences and humanities are the most `PEER friendly’. In fact, it shows that there is clear blue water, statistically, between these users and those in the life sciences and medicine. It is very unlikely indeed that what we are seeing here is just an artifact of a noisy system, these are strong clear signals. The higher the mean in this table, the greater the relative preference for the publisher version of record.
Table 7: Ratio statistics by broad subject
Ratios of publisher to repository full text downloads, March -‐ August 2011, means and confidence intervals (journal level analysis)
95% confidence intervals
Articles Mean SD low high
Life sciences 4,480 18.77 27.66 17.96 19.58
Medicine 4,362 22.09 20.62 21.48 22.70
Physical sciences 3,401 14.08 12.16 13.68 14.49
Social sciences and humanities 1,980 14.59 85.95 10.80 18.38
All subjects 14,223 18.09 38.02 17.46 18.71
ANOVA F=35.03, P<0.01
22 PEER USAGE STUDY
Figure 12: Ratio statistics by broad subject
Ratios of publisher to repository full text downloads, March -‐ August 2011, means (journal level analysis)
By journal impact factor tertile
In the original design of the PEER experiment, journals were sampled using a variety of criteria, including journal impact factors grouped in tertiles. The data laid out below show that users are much more likely to download material from the top and middle tertiles from the publisher’s website rather than from a PEER repository.
Table 8: Ratio statistics by journal impact tertile
Ratios of publisher to repository full text downloads, March -‐ August 2011, means and confidence intervals (journal level analysis)
95% confidence intervals
Articles Mean SD low high
Upper tertile 7,529 19.92 25.08 19.36 20.49 Middle tertile 4,708 18.03 57.47 16.39 19.67 Lower tertile 1,421 12.79 9.24 12.31 13.27 All tertiles 13,658 18.53 38.71 17.88 19.18 ANOVA F=20.97, P<0.01
23 PEER USAGE STUDY
Figure 13: Ratio statistics by journal impact tertile
Ratios of publisher to repository full text downloads, March -‐ August 2011, means (journal level analysis)
By publication year
Users also seem to `prefer’ the publisher site for newer articles. This may be behavioural (the publisher site is still their first port of call, perhaps) or it may be something to do with how the sites are organised. This effect has nothing to do with embargo periods since all the articles are live concurrently on both PEER and the publisher platforms.
Table 9: Ratio statistics by publication year
Ratios of publisher to repository full text downloads, March -‐ August 2011, means and confidence intervals (journal level analysis)
95% confidence interval
Articles Mean SD low high
2004 3 5.90 -‐ 5.90 5.90 2005 395 5.83 6.18 5.22 6.44 2006 564 7.46 5.21 7.03 7.90 2007 1,160 8.28 4.26 8.04 8.53 2008 1,874 10.46 6.42 10.17 10.75 2009 3,445 11.64 6.22 11.43 11.84 2010 5,148 23.97 44.86 22.74 25.20 2011 1,634 35.51 73.29 31.95 39.07 All years 14,223 18.09 38.02 17.46 18.71 ANOVA F=121.63, P<0.01
24 PEER USAGE STUDY
Figure 14: Ratio statistics by publication year
Ratios of publisher to repository full text downloads, March -‐ August 2011, means (journal level analysis)
By embargo period
It is not easy to interpret the data relating to embargo periods below and there are probably several things going on at the same time: it seems unlikely that users seem to prefer to download both very recent and quite old material from repositories. The data points at 24-‐ and 36-‐months represent low numbers of articles, as does the 5-‐month figure, and this is a case where a much longer run of data is needed, and greater representation of longer embargo periods.
Table 10: Ratio statistics by embargo period
Ratios of publisher to repository full text downloads, March -‐ August 2011, means and confidence intervals (journal level analysis)
95% confidence interval
Articles Mean SD low high
0 months 2,548 7.89 5.35 7.68 8.10 3 months 770 30.70 13.90 29.72 31.69 5 months 226 15.06 5.12 14.38 15.73 6 months 3,678 29.42 70.14 27.15 31.68 12 months 4,980 17.07 15.21 16.64 17.49 18 months 1,709 7.75 2.98 7.61 7.89 24 months 156 8.06 4.71 7.31 8.80 36 months 156 15.52 4.19 14.85 16.18 All embargoes 14,223 18.09 38.02 17.46 18.71 ANOVA F=111.10, p< 0.01