© Ali Rastqarfarajzadeh, 2020
Initiation of locomotion: Optogenetic stimulation of
midbrain nuclei
Mémoire
Ali Rastqarfarajzadeh
Maîtrise en neurosciences - avec mémoire
Maître ès sciences (M. Sc.)
II
Résumé
Initier la marche vient naturellement pour tout être vivant qui se déplace. Malgré cette apparente facilité, cet acte nécessite une interaction complexe entre différentes régions du cerveau et la moelle épinière. Une de ces régions a été découverte dans le mésencéphale et a été identifiée il y a maintenant 50 ans comme la région locomotrice mésencéphalique. En effet, la stimulation électrique de cette région engendre de manière systématique l’initiation de la locomotion dans de nombreuses espèces animales. Malgré tout, la localisation anatomique précise et l’identification des populations neuronales de cette région sont un sujet de débat encore aujourd’hui.
Dans notre projet, nous avons utilisé les outils optogénetiques accessibles chez la souris afin de stimuler spécifiquement les populations glutamatergiques ou cholinergiques des deux noyaux qui constituent la région locomotrice mésencéphalique, le noyau cunéiforme (CnF) et le noyau pedonculopontin (PPN). Nous avons découvert que nous ne pouvions initier la marche en stimulant seulement les neurones glutamatergiques du noyau cunéiforme, indiquant ainsi que ces neurones constituent le corrélat anatomique de la région locomotrice mésencéphalique.
Étant donné l’intérêt clinique de la stimulation profonde chez des patients parkinsoniens, épileptiques ou médullaires, il paraît d’autant plus urgent de définir la localisation et les fonctions précises des populations neuronales contribuant à cette région fonctionnelle.
III
Abstract
The act of initiating locomotion comes naturally to every living and moving the animal. Despite this apparent easiness, this act relies upon a complex neuronal interaction between brain regions and the spinal cord. One of those regions was found in the brainstem and has been identified 50 years ago as the mesencephalic locomotor region. Indeed, electrical stimulation of this region consistently leads to the initiation of locomotion in many species. However, the precise anatomical location and neuronal composition responsible for this effect on locomotion remained a matter of debate for years.
Here, using neuronal specific optogenetic stimulation in mice, we stimulated either the glutamatergic or the cholinergic population in the two proposed nuclei that form the MLR (cuneiform and pedunculopontine nuclei, CnF and PPN). We simultaneously recorded kinematics and EMG activity and found that we could only reliably induce locomotion when stimulating the glutamatergic neurons of the CnF, therefore establishing those neurons as the correlates of the MLR.
Considering that the MLR is being tested as a deep brain stimulation target for disease ranging from Parkinson to epilepsy and spinal cord injury, it seems even more urgent to ascertain precisely its anatomical location and physiological role.
IV
Table of content
Résumé ... II Abstract ... III Table of content ... IV List of figures ... VI List of abbrivations ... VII Dedication ... X Remerciements ... XI Foreword ... XIIIntroduction ... 1
Locomotion ... 1
Neural circuits responsible for locomotion ... 5
The spinal locomotor circuit ... 5
The role of primary afferent in regulating locomotion ... 6
Supraspinal neural centers involved in locomotion ... 9
Brief review of the organization of the descending motor control ... 11
The corticospinal pathway ... 11
The rubrospinal pathway ... 11
The reticulospinal pathway ... 12
Supraspinal locomotor center: the mesencephalic locomotor region (MLR) ... 14
Midbrain nuclei of the MLR ... 15
Cuneiform nucleus ... 16
Connectivity and physiology of CnF ... 17
Pedunculopontine nucleus ... 18
Connectivity and physiology of PPN ... 19
Overall insights on supraspinal circuits involved in locomotion ... 20
Justification and hypothesis ... 20
Chapter 1: Materials and Methods ... 21
1.1 Overal view ... 22
1.2 Animals ... 22
1.3 Surgery ... 22
1.4 Optogenetic and electrophysiological experiments ... 23
1.5 Kinematic and electromyographic recordings ... 24
1.6 Kinematic analysis ... 25
1.7 Neuroanatomy ... 25
1.8 Statistical analysis ... 26
Chapter 2: Results ... 27
2.1 Overal view ... 28
2.2 Verification of the optical probe location ... 28
2.3 Photostimulation of the cuneiform nucleus ... 30
V
2.5 The involvement of Cuneiform and Pedunculopontine nuclei in the initiation of movements ... 34
Conclusion ... 38 References ... 42
VI
List of figures
Figure 1. A schematic step cycle in human walking. ... 3 Figure 2. Important characteristics of a gait cycle. ... 4 Figure 3. Muscle spindle (left) and Golgi tendon organ (Right) ... 8 Figure 4. Schematic model of a) a rodent motor nervous system and b) the motor centers of an aquatic or terrestrial animal. ... 10 Figure 5. The projections from Gi , DPGi , LPGi and GiA/V to the different parts of the spinal cord. ...13 Figure 6. The first evidence about the contribution of the midbrain in locomotion. ... 15 Figure 7. The structures in the midbrain that play key roles in the initiation of locomotion in mammalian. ...16 Figure 8. Anatomical localization of Mesencephalic locomotor nuclei. ... 30 Figure 9. The schematic locations of kinematic recording markers, EMG probes, and photo-stimulation site. ... 29 Figure 10. The changes in the stick diagram, joint movement, EMG activity and gaiting after long photo-stimulation of glutamatergic neurons in the cuneiform nucleus of virally transfected mice. ... 31 Figure 11. Kinematic and EMG activities during the long photo-stimulation of
Pedunculopontine nucleus in virally transfected and crossed transgenic mice. ... 34 Figure 12. The involvement of Cuneiform (CNF) and Pedunculopontine nuclei (PPN) in the initiation of movements in virally transfected and transgenic mice. ... 35 Figure 13. The comparison between the quality of locomotion after Pedunculopontine and cuneiform nuclei photostimulation. ... 37
VII
List of abbrivations
5-HT : SerotonineAAV : Adeno Associated Virus BC : Brachium Conjonctivum BG : Basal Ganglia
BSN : Brainstem Nuclei ChR2 : Channel Rhodopsin 2 CIN : Comissural Interneurons ACC : Nucleus Accumbens AMD : Amygdala
AP : Anterioposterior Coordinate ChAT : Choline Acetyl Transferase CLR : Cerebrum Locomotor Region CnF : Cuneiform nucleus
CPG : Central Pattern Generator CPU : Striatum
D : Depth Coordinate
DBS : Deep Brain Stimulation
DSCAM : Down Syndrome Cell Adhesion Molecule DLR : Diencephalique Locomotor Region
DPGi : Dorsal Paragigantocellular Nucleus DpMe : Deep Mesencephalic Nucleus EMG: Electromyography
FB: Fast-Blue
FOG : Freezing Of Gait GL : Gastrocnemius Nateralis GABA: Gamma-Aminobutyric Acid GPi : internal Globus Pallidus GP: Globus Pallidus
GRN/Gi: Gigantocellular Relicular Nucleus HB : Half-Bound Hipp : Hippocampus IC : Inferior Colliculus IG : Imagery of Gait IHC : Immunohistochimy L : Lateral Coordonate LDT : Tegmentum Laterodorsal LF : Left forelimb
VIII
LH : Left hindlimb LL : Lateral Lemniscus
LPGi : Lateral Paragigantocellular Nucleus LPN : Long Propriospinal Neurons
LW : Lateral Walk
MdV : Ventral Medullary formation Mg : Magnocellular nucleus
MG : Medial Gastrocnemius
MLR : Mesencephalic Locomotor Region MRN : Mesencephalic Reticular Nucleus NPHR3 : Halorhodopsin 3
NM : Magnocellular nucleus NMDA : N-Methyl-D-Aspartat OPW : Out-of-Phase Walk
PAG : PeriAqueducal Grey Matter
PB : Posterior Biceps or Parabrachial Nucleus PMLS : PontoMedullary Locomotor Strip PFA : Paraformaldehyde
PPN : Pedunculopontine Nucleus PPR : Parapyramidal Region
PPTg : Pedunculopontine Tegmental Nucleus PRF : Pontoreticular Formation
REM : Rapid Eye Movements RF : Right forelimb RH : Right hindlimb RG: Rhythm Generator Rg: Rotary Gallop RM: Raphe Magnus RS : ReticuloSpinal SC : Superior Colliculus SCI : Spinal Cord Injury
SLR : Subthalamic Locomotor Region SN: Substantia nigra
SNc : Substantia Nigra pars compacta SOL : Soleus
SSRi : Selective Serotonin Reuptake Inhibitors SNr : Substancia Nigra Reticulata
SR : Slow Release
IX
T: Trot
TA: Tibialis anterior TG: Transverse Gallop
VGluT2 : Vesicular Glutamatergic Transporter 2 VL/M/I : Vastus lateralis/ medialis/intermedialis VP : Pallidum ventral
X
Dedication
En physiologie, un organe déterminé fonctionne toujours par un seul et même mécanisme ; seulement, quand le phénomène se passe dans d'autres conditions ou dans un milieu différent, la fonction prend des aspects divers ; mais, au fond, sa nature reste la même (Claude Bernard).
La physiologie est la science vitale active
à l'aide de laquelle l'homme pourra agir sur les
animaux et sur l'homme, soit à l'état sain, soit
à l'état malade. Ce serait une grande illusion
du médecin que de croire qu'il connait les
maladies pour leur avoir donné un nom, pour
les avoir classées et décrites, de même que ce
serait une illusion du zoologiste et du botaniste que de croire qu'ils
connaissent les animaux et les végétaux parce qu'ils les ont dénommés,
catalogués, disséqués et renfermés dans un musée après les avoir empaillés,
préparés ou desséchés.
Claude Bernard (1813-1878)
XI
Remerciements
Je tiens dans un premier temps à remercier mon directeur de mémoire Dr. Frédéric Bretzner qui m'a donné sa confiance et apporté son soutien inestimable mais qui a surtout permis, par ses orientations et ses conseils de mener ce travail à terme.
Je voudrais également remercier mon cher ami Nicolas Josset pour son aide précieuse dans la rédaction de ce mémoire. Mes vifs remerciements vont également à Maxime Lemieux, Marie Roussel et Chloé Lemaire, stagiaires et étudiants de l'équipe de recherche du Dr. Bretzner qui m'ont aidé et accompagné tout au long de l'élaboration de ce projet.
Je désire remercier aussi l'ensemble du personnel de l'installation animalière du centre de recherche du CHU de Québec université Laval qui a fourni de très bonnes conditions afin de mener mon projet de recherche de la meilleure façon possible.
Je souhaite exprimer ma reconnaissance et mon grand respect envers Dr. Elena Timofeeva qui avec ses conseils précieux m'a donné la possibilité de venir étudier au Canada. Enfin je voudrais exprimer également ma gratitude aux membres du jury Dr. Claude Rouillard et Dr. Martin Lévesque, pour leur présence et pour leur lecture attentive et leurs conseils sur mon mémoire de maîtrise.
J'espère avoir contribué à l’avancée de la recherche dans la communauté scientifique canadienne.
XII
Foreword
Chapter 1 of this thesis is a review of the literature that led to the research presented. It deals with the neuronal structures involved in locomotion, mainly the Mesencephalic locomotor region. Chapter 2 presents the material and methods related to our optogenetic stimulation of midbrain nuclei in freely moving animals. The results of this experiment constitute Chapter 3. Finally, Chapter 4 presents the conclusions of this study and a discussion or our results. I contributed to some extent in the analysis of a recent article entitled "Distinct Contributions of Mesencephalic Locomotor Region Nuclei to Locomotor Control in the Freely Behaving Mouse" published in the journal Current Biology in 2018, whose some results are presented in this MSc thesis.
1
Introduction
Locomotion is one of the important characteristics in the animal’s kingdom that enable them to find food, to escape hazard, to make a place for being safe, etc. This characteristic is done in many different forms like swimming, walking, crawling, flying, jumping, running, climbing, and so on (Grillner 2011; Berg et al. 2018). Neural mechanisms and networks that are responsible for locomotion are extensively studied in many animals like marine mollusk (Lennard, Getting, and Hume 1980), grasshopper (Robertson and Pearson 1985), lamprey (Sirota, Di Prisco, and Dubuc 2000), salamander (Cabelguen, Bourcier-Lucas, and Dubuc 2003), and many other vertebrates such as turtles, birds, and mammalian (Orlovsky and Grillner 1999).
Locomotion
Many researchers have tried to find the precise methods to evaluate the position of forelimbs and hindlimbs on-ground or off-ground, the locomotor patterns or locomotor gaits, such as walking, galloping or trotting (Baker 2007). This kind of study is called gait analysis. The development of videography and other measurement tools has allowed researchers to record and analyze gait (Nirenberg, Vernon, and Birch 2018). Now, the scientists are able to assess the rhythm of walking or running in the animal as a model of study or at clinical purposes (Lakes and Allen 2016). At the following sections, will be discussed the specific terminology and other aspects of gait analysis.
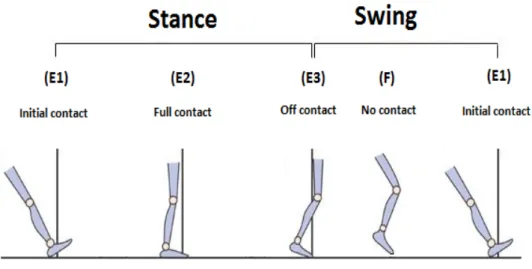
In bipedal and quadripedal animals, each step cycle can be divided into two parts according to flexions and extensions of engaged limb’s muscles (Grillner 1975a). Philipson for the first time cinematically analyzed each step cycle. Immediately after taking of foot from the ground or floor, a flexion takes place in knee, ankle, and hip and moves forward the limb that called flexion phase (F) (Figure 1). In this phase, the position of the limb is changed from caudal to rostral. Then, the extensor muscles of knee, ankle, and hip are activated and extension phase (E) starts. This phase is divided into three sub-phases E1, E2,
2
and E3. In E1 sub-phase, the limb is extended and come down to contact with the ground. During E2 sub-phase, the extension (somewhat the flexion in some muscles) is continued and cause the foot lyes fully on the ground to tolerates and supports body weight. At the final sub-phase, E3, extensor muscles are fully activated again and push forward the body. This sub-phase ends to the next F phase and one step cycle is completed (Philipson 1905).
Phase F and sub-phase E1 together make the swing phase where the foot lifts off the ground to contact with the ground and both E2 and E3 sub-phases make the stance phase where foot contact with the ground to lifting off from the ground. This terminology has been used by many researchers and it is accepted but sometimes there are some differences among the animals are used. It should be noted that this model and parts of step cycles has been applied to many animals like rodents, cats, and even bears as well as humans (Grillner 1975b).
Each step cycle for a given limb corresponds to the time spent on the ground and the time while the limb is in the air. The other synonym for this time period is stride (Figure 2A). Logically, the stride has both stance and swing parts (dark and white bars in figure 2B). Duty factor is a fraction of stride time that is related to stance time (Jacobs, Kloefkorn, and Allen 2014):
Duty factor = !"#$%& !"#$ !" !"#$!"#$%& !"#$ !" !"#$
Duty factor depends on the types of gaits. For examples in a walking gait, the duty factor is more than 0.5 because the value of stance time for a given limb is greater than half of the stride time but in running gait, this value is less than 0.5 because the limb spent a shorter time in stance phase.
3
Figure 1: A schematic step cycle in human walking. Each step cycle has two parts. One part is stance where starts from contacting the heel or forefoot (depending on the animal) with the ground to lifting off the toe from the ground (i.e., the foot is in overground). This part consists of two extension sub-phases E2 and E3. Another part is swing where starts from lifting off the toe to contacting the heel or forefoot with the ground. This part consists of one flexion or F phase and one extension sub-phase E1 (Modified from www.naturalrugs.store). Figure 2 is a schematic representation of these terms and equations.
The limb phase is the time between forelimb strike and hindlimb strike at the same side to overall stride time or (Jacobs, Kloefkorn, and Allen 2014):
Limb phase = !"#$ !" !"#$%&'( !"#$%&!!"#$ !" !!"#$!%& !"#$%& !" !"#$ !"#$!"#$%& !"#$
The phase limb is an important parameter for gait analysis. If a phase value for the hindlimbs is 0.5, it means there is the perfect alternation between both left and right hindlimbs. But, if both hindlimbs touch the ground at the same time, this value will be zero.
4
Figure 2: Important characteristics of a gait cycle. A) Spatial characteristics of gait parameters for a rat hindlimbs. B) Temporal characteristics of gait parameters at Hildebrand plot for a quadripedal animal (rat). Legends are in figure (Modified from Lakes and Allen 2016).
5
Generally, the gait is divided into two symmetrical and asymmetrical forms. At
symmetrical gait, the phase value between hindlimbs and between forelimbs is exactly 0.5
but it is not true about asymmetrical gait (Jacobs, Kloefkorn, and Allen 2014):
Temporal symmetry = !"#$ !" !"#!! !""# !"#$%&!!"#$ !" !"#$ !""# !"#$%&!"#$%& !"#$
Neural circuits responsible for locomotion
The spinal locomotor circuit
Locomotor gait is a rhythmic and automatic movement and it is generated by the spinal locomotor circuit. A central pattern generator is a collection of neurons that are connected together, without receiving input from sensory and motor centers is capable to generate basic motor output (Arshavsky, Deliagina, and Orlovsky 2015). These circuits are conserved across animal species but have evolved from simple models to very complex ones (Katz 2016).
Spinal cord preparations isolated from neonatal rodents have been isntrumental in showing that the spinal cord contains all the circuitry to generate locomotion (Kjaerulff and Kiehn 1997). In addition, the spinal locomotor circuit receives inputs from supraspinal locomotor centers of the brain and sensory afferents from the periphery (Kiehn 2006).
Many experiments have been done in different species to determine which parts of the spinal cord is the zone responsible for generating rhythmic movements. Across these studies, we can conclude that L1-L3 segments in rodents and L3-L5 in cats had a greater capacity to generate rhythmic motor output (Bonnot and Morin 1998; Christie and Whelan 2005; Cowley and Schmidt 1997; Gabbay, Delvolvé, and Lev-Tov 2002; Grillner and Zangger 1979). At least in the rodents, rhythmogenic neuronal pools located ventrally in
6
the spinal cord and project to lower thoracic segments with a rostral bias capacity in generating rhythm compared to caudal segments (Kiehn 2006).
Although each limb has its own rhythm generator (RG), during the transition of phase, animals require a precise interaction between limb’s RGs. All interactions between left and right RG circuits of the spinal cord are mediated by local commissural interneurons (CINs). However, all diagonal and homolateral interactions between corresponding RGs of the cervical and lumbar segments are mediated by long propriospinal neurons (LPNs) with descending and ascending, diagonal, and homolateral projections (Figure 4). Many research groups have confirmed electrophysiologically or anatomically the aforementioned circuits and responsible neural networks (Robert D. Skinner et al. 1979; Bannatyne et al. 2003; Jankowska et al. 2006; Juvin et al. 2012; Ruder, Takeoka, and Arber 2016).
The role of primary sensory afferents in regulating locomotion
During the execution of voluntary movements, CNS is faced with several complexities that may influence the quality of movements. These complexities arise in part from the inherent properties of the muscles involved in the production of a specific movement that may induce neuromuscular oscillations. The muscle fatigue and the coordination of several joints at the same time and accurate adjustment of joint angles to keep the balance and direction are among the problems that CNS deals with during each simple voluntary locomotion (Windhorst 2007). To solve them, afferent sensory inputs are relayed and integrated in the spinal cord to modulate the locomotor pattern and rhythm generated by the spinal locomotor circuit (Saradjian 2015). These sensory modalities include tactile and proprioceptive information.
Muscle spindles and Golgi tendon (Figure 3) organs provide the main proprioceptive signals from the skeletal muscles. Proprioception comes from the combination of the words "proprius" meaning one's own and the word "percipere" meaning to get information. It generally means to be aware of the position of joints in space, but
7
some authors have added the sensation of force to its word usage (Bragonzoni et al. 2019). Muscle spindles are small bundles of organized muscle fibers in which the equatorial zones are filled with multiple nuclei. In human, this zone receives the fastest fibers of the body (type Iα) that provide CNS with afferent sensory data with the least delay and also type II sensory fibers (Banks 2018). These fibers get branched in several orders before entering each spindle and eventually reach the intrafusal fibers in myelinated and unmyelinated forms(Carrasco, Vincent, and Cope 2017). The final branches make the sensory terminals between the basal lamina and sarcoplasm of the spindle fibers. The middle part of intrafusal fibers receives their own motor neurons (type γ) that are of two types of static and dynamic (Proske 2008). The Iα intra-spindle afferent fibers encode the magnitude and the rate of change in muscle tension while the afferent fibers of type II encode the muscle tension in static condition. Activation of the spindle through the γ motor neurons increases the tension inside the spindle itself and changes its sensitivity to the extra spindle muscle stretch (Tuthill and Azim 2018).
Golgi organs are located at the junction between the muscle and its tendon. These fusiform to trifid structures are encapsulated in connective tissue and are made up of college and muscle fibers connected in series with the body of the contracting muscle (Banks 2018). The collagen fibers in tendon organ are innervated by type Ib afferent fibers. When a single motor unit from which a muscle fiber is inserted in the Golgi capsule contracts, the produced tension is transferred to the capsule too. The Golgi capsule varies in the amount and ratio of collagen to muscle fiber they contain.
8
Figure 3. Muscle spindle (left) and Golgi tendon organ (Right) (Adopted from Plowman and Smith 2003).
This variation changes the sensitivity of the tendon organ to the force produced in the contracting muscle (Juergen Mai 2011). An abrupt contraction in muscle leads to the activation of dynamic responses in Golgi tendon organ that by activation of an inhibitory loop in the spinal cord causes relaxation in the contracted muscle and in parallel stimulates contraction in antagonist muscles. Using this response, the tendon organ prevents injury in muscle and detachment of the tendon from the bone during high force contractions (Plowman and Smith 2003).
The cell bodies of the proprioceptive sensory afferents reside in the dorsal root ganglions. These neurons along with the afferent neurons of the other modalities project in the spinal cord (Tuthill and Azim 2018). These sensory inputs affect the rate of activation of α motor neurons directly or via spinal interneurons. Ablation of proprioceptive afferents in rodents does not prevent forward locomotion, but induces ataxia, alterations in gate timing and interlimb coordination (Takeoka and Arber 2019).
9
Supraspinal neural centers involved in locomotion
For the achievement a goal-directed and sometimes precise movement or a series of consecutive movements, it needs the activation of more than one locomotor center. New research methods like optogenetic and chemogenetic tools have alloewd us to investigate particular neural circuits and neurotransmitter types in simple or complex locomotion (Ferreira-Pinto et al. 2018; Sharma, Kim, and Whelan 2019). As described earlier, the spinal cord circuit can generate a locomotor pattern and rhythm. The spinal circuit receives descending inputs from the brain to control and shape the motor outputs and coordination. The supraspinal centers also receive sensory and vestibular inputs to adapt themselves with changing environments and animal requirements (Goulding 2009).
Figure 4 shows a) schematic view of a rodent nervous system and b) model for aquatic and terrestrial neural networks that involved in the control of locomotion. The movement of muscle is locally regulated by pools of motor neurons in the spinal cord. These pools are part of a diffused CPG network and are modulated by proprioceptive sensory feedback via sensory afferents. Spinal motor centers receive descending inputs from reticulospinal (RtS) that is the primary pathway for initiating locomotion as well as from rubrospinal (RbS) and vestibulospinal (VS) and sends feedback vice versa. MLR projects to the hindbrain motor areas and can be activated by the inputs from the basal ganglia and the thalamus. The cerebellum only coordinates motor behaviors. The neural pathway from the motor cortex can directly refine and initiate muscle movements (dotted arrow) or indirectly modulates the activity of basal ganglia and midbrain motor centers (black arrows). Each motor center receives feedback from different compartments (grey arrows). These areas all together initiate, control, modulate, and stop locomotion in animals (Goulding 2009). In the next sections, the role of each area will be discussed in detail.
10
Figure 4. Schematic model of a) a rodent motor nervous system and b) the motor centers of an aquatic or terrestrial animal. Black arrows: direct pathways; Grey arrows: feedback control pathways; Dotted arrow: corticospinal pathways; MLR: mesencephalic locomotor region; RtS: reticulospinal pathway; VS: vestibulospinal pathway; RbS: rubrospinal pathway (Modified from Grillner 2003 and Goulding 2009).
11
Brief review of the organization of the descending motor control
The corticospinal pathway
Although the spinal cord is sufficient to generate locomotion, the cortex is important to voluntary locomotion. Projections of the visual and parietal cortex towards the motor cortex indicate that it integrates visual and somatosensory information of the environment. Like peripheral sensory afferents, the motor cortex can adapt the movement according to the environmental demands.
As an instance, the correlation between cortical activity with gait adaptation in the presence of visually detected obstacle has been demonstrated in studies of Drew (Drew et al. 1996). In addition, pyramidal neurons in the cortex discharge synchronously with steps during walking (Armstrong and Drew 1984) plus cortical stimulation can reset the locomotor rhythm (Bretzner and Drew 2005), and change the trajectory of limbs during locomotion (Armstrong and Drew 1985). This confirms that the cortex has control over the movement and can shape it according to the organism’s demands.
The rubrospinal pathway
The red nucleus is located in the rostral midbrain beside the reticular formation and substantia nigra (Milardi et al. 2016). Based on its cell types, It is divided into the magnocellular and parvocellular parts (Satoh et al. 2015). In human and other mammals the magnocellular part makes most of the rubrospinal tract that descends contralaterally (Mihailoff and Haines 2018) through the dorsolateral funiculus and makes synapses with interneurons of the intermediate lamina and motor neurons of the spinal cord (Wild, Mohan, and Morris 2017). In rats and human, the rubrospinal tract is shown to be involved in reaching movements and hand use (Wild, Mohan, and Morris 2017; van Kan and McCurdy 2002).
12
Lesions of the magnocellular red nucleus or the rubrospinal tract cause mild locomotor deficits. In cats, these lesions cause a transient dragging of the hind limb while walking, however, the animals with lesion could keep normal posture and locomotion (Squire 2009). In rats with a lesion of the corticospinal tract, sprouting in rubrospinal tract causes locomotor recovery to some extents and also in animals lacking the corticospinal projections there is a greater dependency on the activation of rubrospinal tract during locomotion (Serradj, Agger, and Hollis 2017). It seems that skilled control of forelimbs relies on the cooperation of both corticospinal and rubrospinal tracts (Al-Izki et al. 2008).
The reticulospinal pathway
The reticulospinal pathways originate from the medullary reticular formation (MRF) , which plays key roles in some physiological activities including arousal system (Boissard et al. 2002), pain modulation (Nagata et al. 2003; Mason 2005), motor functions (Fay and Norgren 1997; Hattox, Priest, and Keller 2002; Tellegen and Dubbeldam 1999). Among the nuclei of the MRF, four nuclei have been identified i.e. gigantocellularis reticular nucleus (GRN or Gi), alpha part of GRN (αGRN or GiA), ventral part of GRN (vGRN or GiV), and the lateral paragigantocellular nucleus (LPGi) which is involved in locomotion (Brownstone and Chopek, 2018). The Gi is composed of giant distinguishable neurons from adjacent parts. The GiA is located ventral to the Gi, which consists of smaller size neuron than Gi. The GiV is also ventral to Gi and posterior to GiA. The final nucleus, LPGi, is ventrolateral to the Gi and located between GiA/GiV and intermediate reticular nucleus (Liang, Watson, and Paxinos 2016).
Numerous MRF neurons project through the reticulospinal tract to the spinal cord (Reed, Shum-Siu, and Magnuson 2008; Holstege 1991; Peterson, Pitts, and Fukushima 1979; Martin, Vertes, and Waltzer 1985). Anatomical projections of the gigantocellularis reticular formation to all four segments of the mouse spinal cord is illustrated in figure 5.
13
Figure 5. The projections from A) Gi (black) and DPGi (red) and B) from LPGi (black) and GiA/V (red) to the different parts of the spinal cord. Gi: gigantocellularis reticular nucleus; DPGi: dorsal paragigantocellular nucleus; LPGi: lateral paragigantocellularis nucleus; GiA/V: alpha and ventral parts of the gigantocellularis nucleus; C: cranial segment of the spinal cord; T: thoracic segment of spinal cord; L: lumbar segment of spinal cord; S: sacral segment of spinal cord (From Liang, Watson, and Paxinos 2016).
14
Electrical stimulation in the caudal medullary reticular formation produces variable results with no clear behavioral changes or elicit full-body locomotion (Drew and Rossignol 1990; Kinjo et al. 1990; Ross and Sinnamon 1984).
Several nuclei of the medullary reticular formation contribute to motor control or locomotion. Recently, Capelli and his colleagues (Capelli et al. 2017b) have used retrograde tracing from the spinal cord and demonstrated that three nuclei (LPGi, lateral paragigantocellular nucleus; GiA, gigantocellular nucleus alpha; and GiV, gigantocellular nucleus ventral) and the Gi contain both excitatory and inhibitory neurons. Optogenetic activation of these nuclei did not result in initiation or modulation of locomotion, except the activation of glutamatergic neurons of the LPGi. Genetic ablation of glutamatergic LPGi neurons reduces the maximal locomotor speed during treadmill locomotion, but has no effects on exploratory and also, the low-speed locomotion remained unaffected.
Supraspinal locomotor center: the mesencephalic locomotor region (MLR)
Shik and Orlovsky (Shik, Severin, and Orlovskiĭ 1966) have shown that electrical stimulations of a specific region in the midbrain can initiate locomotion in a decerebrated cat. This functional region of the midbrain was then called the mesencephalic locomotor region (MLR). By increasing the intensity of electrical stimulation, they showed the decerebrated cat is able to increase its speed of movements and even to change the pattern of walking to trot or gallop. The MLR is phylogenetically conserved and recognized in many species such as lamprey (Sirota, Di Prisco, and Dubuc 2000), stingray (Bernau, Puzdrowski, and Leonard 1991), salamander (Cabelguen, Bourcier-Lucas, and Dubuc 2003), mouse (Liang, Paxinos, and Watson 2012; Josset et al. 2018), rat (Skinner and Garcia-Rill 1984), monkey (Eidelberg, Walden, and Nguyen 1981), and there is indirect evidence in the human (Sébille et al. 2019).
15
Figure 6. The first evidence about the contribution of the midbrain in locomotion. The electrical stimulation of MLR initiates locomotion in the decerebrated cat (Reproduced from Shik, Severin, and Orlovskiĭ 1966).
Midbrain nuclei of the MLR
The MLR is a functional region which is able to initiate and control locomotion. The anatomical characterization and components of MLR have been not fully identified. By electrical stimulation, reversible cooling, pharmacological agents, lesions, and tracing methods, researchers have tried to determine the exact anatomical location of the MLR (Shik, Severin, and Orlovskiĭ 1966; Shefchyk, Jell, and Jordan 1984; Ryczko and Dubuc 2013). The MLR locomotor nuclei can be classified as exploratory, appetitive and defensive areas according to their function (Figure 7). At least in mammalian, the MLR receives direct inhibitory inputs from some parts of basal ganglia and direct or indirect excitatory inputs from the periaqueductal gray (PAG) nucleus and the lateral and medial hypothalamus (Jordan 1998; Sinnamon 1993).
16
Figure 7. The structures in the midbrain that play key roles in the initiation of locomotion in mammalian. accumb: nucleus accumbance; v. pall: pallidum; neostr: neostriatum; SNr: substantia nigra; EP: entopeduncular nucleus; PAG:
periaqueductal gray (Reproduced from Jordan 1998).
In vertebrates, the cuneiform nucleus (CnF), the pedunculopontine nucleus (PPN), and the laterodorsal tegmentum nucleus (LDT) have been considered as the MLR (Xiao et al. 2016; Sébille et al. 2017). In the following sections, the location and neuronal diversity of midbrain nuclei will be explained and at the end, the role of these nuclei, as well as their projections to MRF, will be discussed in detail.
Cuneiform nucleus
The CnF has been proposed by Sinnamon first time as a defensive system (Sinnamon 1993). In addition to control of locomotion, this nucleus controls cardiovascular and analgesic responses (Ryczko and Dubuc 2013). Chemical (Shafei and Nasimi 2011) and
17
electrical (Korte et al. 1992) activation of the CnF have been shown to increase heart rate and arterial pressure. In decerebrate cats, electrical stimulation at the level of the proximal area of the CnF increases respiratory activity a few seconds before motor responses (Kawahara et al. 1989). The CnF appears to control cardiac, respiratory, and locomotor rhythms (Kawahara et al. 1994).
Anatomically it is located bilaterally in the dorsal part of the mesencephalic tegmentum. There are some differences through species from rat, cat, and even human but in general, CnF extends from the caudal part of the inferior colliculus to the rostral part of superior colliculus by progressively increasing in size caudorostrally. It ends rostrally to pretectal region, is bordered laterally by lateral lemniscus. The CnF is located on the dorsal part of the pedunculopontine nucleus and transversally it has a triangular shape (Olszewski and Baxter 1954; Taber 1961; Alam, Schwabe, and Krauss 2011; Zemlan and Behbehani 1984). The CnF expresses different kinds of neurotransmitters (i.e. glutamate, GABA, nitric oxide, and some peptides) (Ryczko and Dubuc 2013). Among these neurons, glutamatergic neurons occupy the largest portion of the CnF (Heise and Mitrofanis 2006).
Connectivity and physiology of CnF
The CnF descending fibers in the cat mainly project to ventromedial tegmentum contralaterally and to reticulospinal neurons (such as gigantocellular nucleus) ipsilaterally (Gioia and Bianchi 1987). Furthermore, descending projection of CnF to the magnocellular reticular nucleus in the monkey (Chung et al. 1983), or to raphe nucleus magnus in the rat (Beitz 1982). In the rat and the mouse, the CnF projects ipsilaterally to the gigantocellular reticular nucleus, the magnocellular nucleus and some different nuclei of raphe predominantly but, the caudal portion of the CnF terminates extensively in the ventral medulla (Bernard, Peschanski, and Besson 1989; Zemlan and Behbehani 1984). It receives inputs from the amygdala, hypothalamus, the periaqueductal gray matter, substantia nigra and even contralateral CnF (Bernard, Peschanski, and Besson 1989) but fewer projections from the cortex (Caggiano et al. 2018).
18
The CnF is a core station for defensive responses because it acts as an integrative system and sends appropriate commands for the regulation of locomotion, heart rate, blood pressure, and respiration against painful and threatening stimuli (Borelli, Ferreira-Netto, and Brandão 2006).
Pedunculopontine nucleus
The pedunculopontine nucleus (PPN) was identified by Olszewski and Baxter (Olszewski and Baxter 1954). The PPN has been proposed as an anatomical correlate of the MLR (Garcia-Rill 1986; Garcia-Rill et al. 1987). In contrast to the CnF which is a part of the defensive system, the PPN would be part of the exploratory system (Sinnamon 1993). The PPN is present in many animals like rats (Lavezzi, Parsley, and Zahm 2012), cats (Jones 1990), and gorilla (Noback 1959) as well as in humans (Mazzone et al. 2012) but it has sometimes a different name according to the species.
The PPN is bilaterally located in the mediolateral part of the mesencephalic caudal tegmentum in the midbrain. From the dorsal part, it is exactly bordered by CnF and from the lateral and ventral part is bordered by medial lemniscus. It is adjacent to the red nucleus. It composed of medium to large oval and elongated neurons (Ryczko and Dubuc 2013; Noback 1959; Rye et al. 1987).
In the human, the cholinergic cells have high density in the PPN, so that 90% of the large neurons are cholinergic (Mesulam et al. 1989). These values are tremendously different in the rat. In the pars compacta portion of PPN, 50% of neurons are glutamatergic, 31% are cholinergic, and 19% are GABAergic, whereas in the pars dissipata, 37% of neurons are glutamatergic, 23% cholinergic, and 40% GABAergic (Wang and Morales 2009). Across the rostrocaudal axis of PPN, the rostral part contains mainly GABAergic neurons which project to the basal ganglia, whereas the caudal part contains glutamatergic and cholinergic neurons which interact with the medullary reticular formation (J. Mena-Segovia et al. 2009; Martinez-Gonzalez, Bolam, and Mena-Mena-Segovia 2011).
19
Connectivity and physiology of PPN
The PPN generally projects to midbrain, pontine, medulla, and also to the spinal cord (Martinez-Gonzalez, Bolam, and Mena-Segovia 2011). In the human and rat, the rostral PPN projects to some thalamic nuclei, basal ganglia nuclei, and some other higher structures (Sébille et al. 2017; Mesulam et al. 1983; Hallanger et al. 1987). In the rat and cat, the cholinergic PPN directly descends to the pontomedullary reticulospinal neurons as well as the raphe nucleus (Jones 1990). The gigantocellular and magnocellular nuclei in the medullary reticular formation receive monosynaptic inputs from the PPN as shown by stimulation methods and retrograde labeling studies (Mitani et al. 1988; Lydic and Baghdoyan 1993; Lai et al. 1999). In the rat but not in the cat, projections of the PPN to the spinal cord have been reported (Rye et al. 1988; Edley and Graybiel 1983).
The PPN is reciprocally connected with structures of the basal ganglia (substantia nigra, subthalamic nucleus, and internal globus pallidus) and it is reported that substantia nigra sends numerous projections to glutamatergic neurons of the PPN (Juan Mena-Segovia, Bolam, and Magill 2004; Grofova and Zhou 1998). The retrograde and anterograde labeling in the rat and the monkey respectively revealed that the PPN receives inputs from the motor cortex and a lesser extent from other motor areas (Matsumura et al. 2000; Edley and Graybiel 1983; Monakow, Akert, and Künzle 1979). However, the PPN receives inputs from other parts of the brain such as the thalamus (parafascicular nucleus), the hypothalamus (lateral part), the cerebellum (deep nuclei), and even spinal cord (Martinez-Gonzalez, Bolam, and Mena-Segovia 2011).
It is believed that the PPN is involved in some physiological processes. The c-fos activity is high during REM sleep (Shiromani et al. 1995). The PPN also involved in the switch between wakefulness and sleep, however, the activity of its cholinergic neurons modulates cortical gamma activity during slow oscillation (Juan Mena-Segovia et al. 2008). In addition, the PPN has a role in locomotion. Electrical stimulation of the PPN could induce locomotion in rats (Garcia-Rill et al. 1987). But, in lesion studies by Ibotenic acid, the deficit in the PPN did not affect spontaneous and exploratory locomotion in open field experiments (Steiniger and Kretschmer 2004). Unilateral or bilateral electrolytic
20
experiments in primates (that have PPN) have resulted in severe akinesia that is in contrast with the rat experiments (Aziz et al. 1998; Munro-Davies et al. 1999).
Overall insights on supraspinal circuits involved in locomotion
The electrical stimulation or pharmacological tools alone cannot unwrap the complexity of these circuits. The effective electrical stimulation of the MLR from the rostral to caudal and from the dorsal to the ventral part that overlaps with the location of the PPN and CnF can elicit locomotion. This region has intermingled cholinergic (in the case of PPN), glutamatergic, and GABAergic neurons (Martinez-Gonzalez, Bolam, and Mena-Segovia 2011).
Justification and hypothesis
Although many studies indicate that the cuneiform and dorsal pedunculopontine nuclei could be the anatomical substrate for the MLR, it is still a disputed fact. The neurotransmitter responsible for the initiation of locomotion seems to be glutamate (Roseberry et al. 2016): but little is known about the nucleus involved (CnF vs. PPN) and the other neuronal population (cholinergic vs. glutamate) to initiation and modulation of locomotion.
The main goal of this thesis was to investigate the functional contribution of excitatory neuronal populations of the cuneiform and pedunculopontine nuclei to locomotion in the freely behaving mouse. We hypothesize that glutamatergic neurons of the cuneiform nucleus are the anatomical correlates of the MLR and contribute to initiate and accelerate locomotion, whereas glutamatergic and cholinergic neurons of the pedonculopontine nucleus contribute to modulation of locomotion.
22
1.1 Overview
In this chapter, we tried to summarize the material, animal model, surgery protocols, methods of recording and photostimulation, analysis, and all software that are used in this project.
1.2 Animals
We used VGluT2-IRES-Cre (RRID: IMSR_JAX:016963), ChAT-IRES-Cre (RRID: IMSR_JAX:006410), Ai32 (RCL-ChR2(H134R)/EYFP, RRID: IMSR_JAX:024109) mouse strains that they were maintained on a mixed genetic background (129/C57Bl6). Adult mice (both male and female genders) with approximately 60 days old weighing approximately 30 g were used randomly in this study. All mice were housed in groups of 5 per cage maximally before the surgery and after that, for avoiding implant damaging, they were housed alone in the cages without food baskets (a sufficient amount of food was placed directly in the cages).
For inducing restricted cre-lox recombination, AAV2/9 EF1-DIO-hChR2(H134R)-mCherry (Bouvier et al. 2015) was injected in VGluT2-IRES-Cre or ChAT-IRES-Cre mice both in the PPN or CnF. The housing of animals, surgery protocols, behavioral experiments, and euthanasia were accomplished in conformity with the guidelines of the Canadian Council on Animal Care and approved by the local committee of Université Laval.
1.3 Surgery
Under isoflurane (1,5%–2% O2) anesthesia, the mice were installed in a stereotaxic frame, and after shaving and cutting the skin, a craniotomy was performed for chronic implantation of a unilateral optical fiber with a diameter size about 200 µm above the nucleus of interest. For the CnF, the anteroposterior from the Bregma (AP) was from -4.6 to 4.9 mm; the mediolateral (ML) was from 1.2 to 1.4 mm and the depth was from 2.2 to
-
23
2.7 mm. For the PPN, AP was from -4.3 to -4.8 mm; ML was from 1 to 1.5 mm and the depth was from -3.1 to -4.3 mm. The fiber was held in place with dental acrylic and small screws (cat#19010-10, FST, North Vancouver, Canada).
For every vGlut-cre mouse, 100nL AAV2/9 (titer 1,2E13 GC/mL) was injected in a nucleus of interest (PPN or CnF) prior to chronic implantation of an optical fiber during the same surgery under isoflurane (1,5%–2% O2) anesthesia. For injection of virus, we used a glass micropipette (WPI, ID: 0.53 and OD: 1.19 mm) that was backfilled with mineral oil and fixed on a micro-injector (Nanoliter 2010 Injector, WPI). Before and after each injection, we did a test to be sure the injector is working well and if the tip of micropipette is blocked or not. The glass micropipette was lowered slowly into the nucleus of interest. After a 2 to 5 min period (the time is needed for stabilizing the brain), the AAV was injected at a very slow flow rate (50nL/min). To avoid any leaking of the AAV, the glass pipette was held in the place of interest for 2 to 5 min following the injection before being slowly retracted.
For chronic electromyographic EMG recordings in AAV-injected and implanted mice during isoflurane (1,5%–2% O2) anesthesia, for local anesthesia, lidocaine (7.5 mg/kg) was injected subcutaneously prior to inserting EMG electrodes. Stainless steel wires were implanted into both side hindlimb muscles including tibialis anterior (TA), gastrocnemius lateralis (GL), semitendinosus (ST), vastus Lateralis (VL). Stainless steel wires were run under the skin up to a connector attached to the back of the mouse.
For all surgical procedures, analgesics (Buprenorphine hydrochloride SR: 5mg/kg) were provided at the beginning of the surgery for long-duration release. After surgery for injection of virus and implantation of optical fiber, the weight, the stability of dental cement and optical fiber, and the general health of the animals were checked every day for one week and one time per week for three following weeks until a month.
1.4 Optogenetic and electrophysiological experiments
Kinematic and electromyographic (EMG) recordings were done upon optical manipulations of Channelrhodopsin 2 (ChR2) expressing neurons in freely behaving mice at rest and during treadmill locomotion. The pattern, timing, and power of laser delivery
24
were controlled using a mechanical shutter (Connectorized Mechanical Shutter Adapters; Doric, Canada) and controller (SR470 Laser Shutter Controller; Stanford Research Systems, California, USA) synchronized online during kinematic and EMG recordings.
For photostimulation of ChR2 expressing neurons, we used a blue laser 50mW power and 473nm wavelength (Laserglow Technologies, Ontario, Canada). Kinematic and EMG signals were recorded upon 10ms pulse photostimulations delivered in the animal at rest for determination of the laser power threshold. All locomotor experiments were done at the threshold and steady speed during treadmill locomotion. Regarding the timing of stimulations, trains of 10ms pulses at 20Hz were used for 1 s every 5 s. In the ChAT-Ai32-ChR2 mice, there were no initiation effects and only subtle effects on the locomotor output so; the intensity was set at the submaximal laser power (90% of the laser power) in this mouse model.
1.5 Kinematic and electromyographic recordings
All mice were trained to walk and run on a treadmill (LE 8700 Series, Panlab) over a wide range of speeds prior to any surgery. Reflective markers were painted on the hindlimb joints (iliac crest, hip, knee, ankle, and MTP) for post hoc kinetic and kinematic analysis. All experimental mice were filmed from the left and right sides with high-frequency cameras (Genie HM640, Dalsa Teledyne; 250 frames/s). Videos were digitized with StreamPix 6.0 (Norpix) and analyzed offline using custom-designed software and MATLAB.
Electromyographic activity of the tibialis anterior (TA, ankle flexor), gastrocnemius lateralis (GL, ankle extensor), semitendinosus (St, knee flexor), and vastus lateralis (VL, knee extensor) muscles were recorded. Electromyographic signals were high-pass filtered, rectified, and analyzed offline using custom-designed software and MATLAB.
25
1.6 Kinematic analysis
As described above (Lemieux et al. 2016), joint markers of the iliac crest, hip, ankle, and MTP were detected. To avoid skin slippage, the knee was inferred by triangulation using the length of the femur and the tibia. Stick and gait diagrams were generated for locomotor gait analysis. Data was collected before, during, and after photostimulation then was averaged and plotted as functions of time. Locomotor gaits were determined on the basis of the inter-limb coupling, the footfall pattern and the duty cycle of the stance phase to delineate running and walking gaits (i.e. hop, lateral walk, diagonal walk, pace, out of phase walk, trot, rotatory gallop, transverse gallop, half-bound, and bound). Using 200 ms bin width, locomotor gait predominance upon long optical manipulations (100 ms, 200 ms, or 1 s) was illustrated by histograms of frequency as a function of time. During photostimulation, mice walked at a comfortable speed with a stance duration ranging almost from 100 to 200 ms; therefore a locomotor arrest was considered when the stance phase outlasted 400ms or 200% of the pre-stimulus step cycle duration.
1.7 Neuroanatomical investigations
At the end of the experiment, animals were deeply anesthetized and transcardially perfused with 10 mL saline (0,9% NaCl) followed by 10 mL paraformaldehyde (4% PFA) and finally 10 mL 4% PFA plus 10% sucrose. Tissues were harvested and post-fixed overnight in 4% PFA plus 10% sucrose, then in 30% sucrose until saturation. After saturation in sucrose, the tissues were frozen in Leica tissue freezing medium, then cut on a Leica cryostat (Leica CM1860, Germany). The following primary antibodies were used: anti-choline acetyltransferase (ChAT) 1:100 (Chemicon-Millipore, AB144P), and anti-Cre recombinase (CRE) 1:1000 (EMD Millipore, MAB3120). The following secondary antibodies were used: donkey anti-mouse-AF594 1:1000 (Thermofisher Scientific, A-21203), donkey anti-goat-AF488 1:1,000 (Abcam, AB150129) and donkey anti-rabbit-AF594 (Invitrogen, A21207). Images were taken on an Axio Imager M2 microscope connected to an AxioCam camera using ZEN2 software (Zeiss, Germany). Low-magnification reconstructions were generated to delineate the extent of the cre-lox
26
recombination (AAV-mCherry) and determine the stereotaxic coordinates of the tip of the optical cannula according to anatomical landmarks (superior cerebellar peduncle, inferior colliculus, and the periaqueductal gray) and anatomical atlas (“Paxinos and Franklin’s the Mouse Brain in Stereotaxic Coordinates, Compact - 5th Edition” 2019.; VanderHorst and Ulfhake 2006). Cholinergic staining was used to identify and localize the cholinergic PPN. The cholinergic staining and the extent of cre-lox recombination were evaluated by outlining the area on low-magnification reconstructions to determine whether the stimulation site was located within the CnF or PPN.
1.8 Statistical analysis
Information about mice number and statistical tests are mentioned in the text. Data are represented as mean ± standard error of mean and statistical difference was indicated by asterisks (* p≤0.005, ** p≤0.001, *** p≤0.0001). Before every analysis, the normality of the data distribution was assessed using a Shapiro-Wilk test. In order to test the statistical difference from a specified value, we used a one-sample t-test if the distribution was normal or a Mann-Whitney test if the distribution was not normal. In order to compare groups, a one-way ANOVA was performed with a Bartlett post-test used if the distribution was normal. Otherwise, if the distribution was not normal, a Kruskal-Wallis test was performed with a Dunn’s multiple comparison post-test. In absence of differences between mouse models (transgenic versus virally-transfected mice), neuronal populations (glutamatergic versus cholinergic), or flexor or extensor muscles, data were pooled together.
28
2.1 Overview
In this study to investigate the roles of each neuronal population in control of locomotion in the MLR, we used the optogenetic approach to photo-stimulate different areas throughout the Mesencephalic locomotor region. MLR is mainly comprised of the two nuclei (the Cuneiform and the Pedunculopontine) and two types of excitatory neurotransmission system (Glutamatergic and cholinergic). In this study, glutamatergic and cholinergic neuronal populations were photo-stimulated in two groups of mice. One group of VGlut2-cre or ChaT-cre mice were virally transfected with Channelrhodopsin-2 (ChR2) in either glutamatergic or cholinergic neurons of each nucleus, and the second group was crossed with the transgenic Ai32 mice. Using these two types of blue laser sensitive neuronal populations, we selectively activated a specific neurotransmission system in the MLR with the transgenic mice. This allowed us to compare our results with previously published studies that had used the electrical stimulation methods. Moreover, we avoided any misinterpretation about the role of each nucleus in the initiation of locomotion by using virally transfected mice.
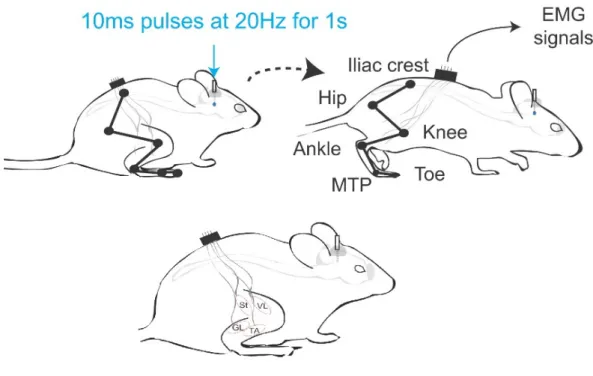
During the whole procedure, hindlimb joint movements of the iliac crest, hip, ankle, and MTP were videotaped. In addition, electromyorgraphic (EMG) recordings were performed from the tibialis anterior, gastrocnemius lateralis, semitendinosus, vastus lateralis (the location of each muscle is schematically shown in figure 8). The animal postural changes and locomotor gaits after photo-stimulation of each neuronal population were extracted as shown in stick diagrams in figures 10 and 11. Changes in the speed of movement in response to changes in the laser intensity of photo-stimulation in Cuneiform and PPN are shown in figure 13.
2.2 Verification of the optical probe location
The photo-stimulation was delivered through an optical probe in the right CnF or PPN. In order to confirm the correct positioning of optical probes, histological assessments were performed on post-mortem tissues.
29
Figure 8. The schematic locations of kinematic recording markers, EMG probes, and photo-stimulation site. In each of the virally transfected or crossed transgenic mice, an optical probe was planted in the right midbrain in cuneiform or Pedunculopontine nuclei. Six kinematic markers were located at the joints of the iliac crest, hip, knee, ankle, MTP and toes. The EMG probes were planted in four muscles of tibialis anterior, gastrocnemius lateralis, semitendinosus and vastus lateralis.
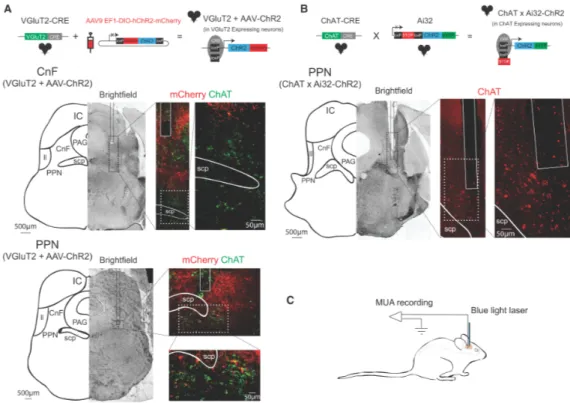
As demonstrated in figure 9, Glutamatergic neurons transfected with channelrhodopsin virus expressed the mCherry fluorescent protein and were observed in red. The positioning of the tip of the optical electrode in each nucleus was verified considering the anatomical landmarks including the periaqueductal gray matter area in the mediolateral side of CnF, the inferior colliculus in the posterolateral side of CnF, the lateral lemniscus in the ventrolateral side of CnF and the superior cerebellar peduncle in the medial side of PPN. Besides, ChAT immunostaining was used to determine the distribution of cholinergic neuronal populations which is a good marker of the Pedunculopontine nucleus. Immunostaining of cholinergic neurons allowed us to verify the exact position of the optic probe in the PPN.
30
Figure 9. Anatomical localization of Mesencephalic locomotor nuclei. A- B) Sections through the Mesencephalic locomotor region showing the trace induced by the tip of the optical electrode in the glutamatergic neuronal zone of the cuneiform nucleus (CnF) and glutamatergic and cholinergic neuronal areas in pedunculopontine nucleus (PPN). The mCherry fluorescent dye was expressed in virally transfected glutamatergic neurons mainly in CnF. The cholinergic neurons in each tissue section were ChAT immunostained (Green in virally transfected and red in transgenic mice). Outlines in schematic illustrations show the surrounding areas considered as the anatomical landmarks to verify the deepness of the optical probe, including inferior colliculus (IC), periaqueductal gray (PAG), Lateral lemniscus (LL) and superior cerebral peduncle (scp). C, schematic representation of the experimental setup for photo-stimulation of Mesencephalic locomotor region.
2.3 Photostimulation of the cuneiform nucleus
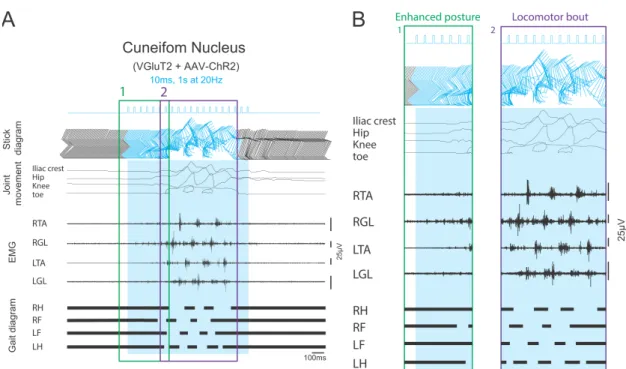
As shown in figure 10, in mice with virally transfected glutamatergic neurons in CnF, long photo-stimulation induced increases in the muscular tone in EMG and in the height of the iliac crest and hip prior to the initiation of
31
locomotion (enhanced posture). In this phase, an increase in ipsilateral (Right) and then contralateral EMG activities were recorded from Tibialis anterior and gastrocnemius muscles that accompanied the joint movements upward from the stance toward the swing position. In the later phase of photo-stimulation alternative sharp increases in muscular electrical activity in both ipsilateral and contralateral forelimbs and hindlimbs led to bouts of locomotion. In this phase, the kinematic recordings showed sharp alternative up and down movements of the iliac crest, hip and knee and twisting movements in toes.
Figure 10. The changes in the stick diagram, joint movement, EMG activity and gait after long photo-stimulation of glutamatergic neurons in the cuneiform nucleus of virally transfected mice. A) trains of 10 ms photo-stimulations with 20 Hz for a duration of 1 second generate locomotion as demonstrated by the rising of joints and alternative bouts of EMG firings recorded from ipsilateral and contralateral flexor and extensor muscles. The gaiting diagram shows regular and alternative stance (black line) and swing (the gap in black lines) status in left and right hindlimbs and forelimbs producing a continues locomotion after the stimulus. B) The locomotor response during the period of
32
stimulation in glutamatergic neurons of the cuneiform nucleus can be divided into two phases. By the start of photo-stimulation minor movements of joints and increase in the muscular tone produced an enhanced posture that by the continuation of the stimulus led to the start of swing movements (locomotion bout) after a delay. During the locomotor phase of photo-stimulation, stronger and sharp movements of joints along with alternative bouts of muscular firing induced regular muscular contractions in fore and hind limbs.
2.4 Kinematic activity after photostimulation of the Pedunculopontine nucleus
Figure 11 A and B show the kinematic response in limb muscles to the long photostimulation of either glutamatergic or cholinergic neurons of the pedunculopontine nucleus. As shown in figure 11 A, in virally transfected mice (VGluT2+AAV-ChR2) 20 Hz photostimulation of the glutamatergic neuronal population for 1 second did not trigger the locomotion. However minor increases of EMG activities were observed bilaterally in flexor and extensor muscles that unlike the muscular response after CnF stimulation. But, it did not obey any special pattern. These fluctuations did not match any kinematic activity of joints or any regular gaps in gait diagram, still, there was little increase in muscular tone in extensor muscles. Long photostimulation of cholinergic neurons in crossed transgenic mice (ChaT×Ai32-ChR2) did not induce kinematic, EMG or gaiting changes (Figure 12B).
33
Figure 11 C and D show the results of photo-stimulation of glutamatergic neurons of Cuneiform and Pedunculopontine nuclei in transgenic mice. We observed no differences in the locomotor response after photostimulation of glutamatergic neurons of the pedunculopontine nucleus in virally transfected or crossed transgenic mice. Alternative joint movement and gait pattern was observed in both. However comparison between the kinematic response in virally transfected or crossed transgenic mice revealed different responses after photo-stimulation of glutamatergic neurons in the pedunculopontine nucleus. Although photostimulation in virally transfected mice did not lead to any change from static to locomotion status, photo-stimulation in crossed transgenic mice produced running and similar patterns of locomotion as observed after stimulation of glutamatergic neurons of the cuneiform nucleus. Regular repetitive increases in the height of joint markers along with alternative movements of flexor and extensor muscles of both sides were observed.
34
Figure 11. Kinematic and EMG activities during the long photo-stimulation of Pedunculopontine nucleus in virally transfected and crossed transgenic mice. A) The absence of locomotion or joint translocation during the 1-second train of 10 ms photo-spikes with 20Hz of glutamatergic neurons in virally transfected mice. However minor increase was observed in the tone of extensor muscles. B) The lack of changes in the kinematic status or the EMG activity during and after long photostimulation of cholinergic neurons in PPN of transgenic mice. It induced no locomotion or gating. C-D) The gait diagram and kinematic changes showing the walking pattern in transgenic mice after long photostimulation of glutamatergic neurons in Cuneiform or Pedunculopontine nuclei. The gating diagram shows the stance position as a black line and the locomotion as a space in line in forelimbs and hindlimbs of both sides. Note the alternative patterns of limb movements in ipsilateral and contralateral and between homonym muscles of both sides.
2.5 The involvement of Cuneiform and Pedunculopontine nuclei in the initiation of movements
In order to determine the involvement of each different neuronal populations of the MLR in the initiation of locomotion, they were photo-stimulated using virally transfected and transgenic mice. Photo-stimulation of glutamatergic neuronal populations in the cuneiform nucleus resulted in the initiation of locomotion both in virally transfected and transgenic mice (Figure 12). Photo-stimulation of either glutamatergic and cholinergic neurons in PPN did not induce the initiation of locomotion in virally transfected mice. Locomotor activity was exclusively observed after photostimulation of PPN in crossed transgenic mice when glutamatergic neurons were stimulated in the most dorsal part of the PPN (In Ai32 transgenic mice among the 7 photo-stimulated glutamatergic sites, 5 resulted in the initiation of locomotion). However, even in the most dorsal areas in PPN, photo-stimulation of glutamatergic neurons in virally transfected mice failed to make any changes in the locomotion status.
35
Figure 12. The involvement of Cuneiform (CNF) and Pedunculopontine nuclei (PPN) in the initiation of movements in virally transfected and transgenic mice. In the coronal (left) and sagittal (right) sections through MLR, the photostimulated sites are shown schematically where most of the stimulations resulting in the initiation of locomotion were located at the glutamatergic neuronal populations in CnF (shown with a triangle). Photostimulation of Glutamatergic neurons in ventral PPN where cholinergic neurons are abundantly distributed (gray area) did not induce locomotion (shown with squares). In the most dorsal parts of PPN proximal to the CnF nucleus in Ai32 mice, photostimulation of Glutamatergic neurons led to the initiation of locomotion in some of the mice.
To test whether or not changing laser intensity could change the kinematic response in either Cuneiform or Pedunculopontine nuclei, we measured the speed of movement as a function of time in response to optimal, sub and supra threshold stimulations. As shown in figure 13, Increase and decrease in the laser power used to stimulate cuneiform nucleus for 1 second changed the speed of mice movements
36
proportionally while it did not affect the speed of movements during the long stimulation of glutamatergic neurons of PPN. Therefore glutamatergic neurons in PPN were not responsible for the initiation of locomotion. To check this, percentage of virally transfected or crossed transgenic mice in which, the stimulation of glutamatergic or cholinergic neurons of CnF and PPN had induced the initiation of movement was calculated that is shown in figure 13 B.
According to this plot, in almost all transgenic (n=7) and virally transfected (n = 9) mice stimulation of glutamatergic neurons of CnF led to the initiation of locomotion from the static status. We observed a significant difference (p < 0.0001) in the number of mice that showed locomotion during the long stimulation of cholinergic neurons of PPN in transgenic mice (n=7) and also in virally transfected mice during the stimulation of glutamatergic neurons of PPN (n=11) in comparison with the percentage of animals that showed initiation of locomotion after photo-stimulation of glutamatergic neurons of CnF in either types of photosensitive mice. There was no significant difference between the number of transgenic mice having locomotion after photostimulation of Glutamatergic neurons in PPN (n=7) and transgenic or virally transfected mice with CnF stimulation (Kruskal-Wallis with Dunn’s multiple comparison post-test).
37
Figure 13. The comparison between the quality of locomotion after Pedunculopontine and cuneiform nuclei photostimulation. A) The changes in the speed of movement in virally transfected mice during long photo-stimulation of glutamatergic neurons in cuneiform (CnF) and Pedunculopontine (PPN) nuclei with increasing laser power (from subthreshold to suprathreshold laser densities). Unlike the cuneiform nuclei, increasing the laser power in PPN did not change the result of photo-stimulation. B) A comparison between the percentage of animals in the experiment (the number of animals is mentioned in the text) that showed initiation of locomotion after long photostimulation of either glutamatergic neurons of CnF and PPN or the cholinergic neurons of PPN in virally transfected and crossed transgenic mice.